. 2024 Oct 17;16(10):1623.
doi: 10.3390/v16101623.

Activation-Induced Marker Assay to Identify and Isolate HCV-Specific T Cells for Single-Cell RNA-Seq Analysis

Affiliations

Activation-Induced Marker Assay to Identify and Isolate HCV-Specific T Cells for Single-Cell RNA-Seq Analysis

Mohamed Eisa et al. Viruses. .

Abstract

Identification and isolation of antigen-specific T cells for downstream transcriptomic analysis is key for various immunological studies. Traditional methods using major histocompatibility complex (MHC) multimers are limited by the number of predefined immunodominant epitopes and MHC matching of the study subjects. Activation-induced markers (AIM) enable highly sensitive detection of rare antigen-specific T cells irrespective of the availability of MHC multimers. Herein, we have developed an AIM assay for the detection, sorting and subsequent single-cell RNA sequencing (scRNA-seq) analysis of hepatitis C virus (HCV)-specific T cells. We examined different combinations of the activation markers CD69, CD40L, OX40, and 4-1BB at 6, 9, 18 and 24 h post stimulation with HCV peptide pools. AIM+ CD4 T cells exhibited upregulation of CD69 and CD40L as early as 6 h post-stimulation, while OX40 and 4-1BB expression was delayed until 18 h. AIM+ CD8 T cells were characterized by the coexpression of CD69 and 4-1BB at 18 h, while the expression of CD40L and OX40 remained low throughout the stimulation period. AIM+ CD4 and CD8 T cells were successfully sorted and processed for scRNA-seq analysis examining gene expression and T cell receptor (TCR) usage. scRNA-seq analysis from this one subject revealed that AIM+ CD4 T (CD69+ CD40L+) cells predominantly represented Tfh, Th1, and Th17 profiles, whereas AIM+ CD8 T (CD69+ 4-1BB+) cells primarily exhibited effector and effector memory profiles. TCR analysis identified 1023 and 160 unique clonotypes within AIM+ CD4 and CD8 T cells, respectively. In conclusion, this approach offers highly sensitive detection of HCV-specific T cells that can be applied for cohort studies, thus facilitating the identification of specific gene signatures associated with infection outcome and vaccination.

Keywords: AIM assay; antigen-specific T cells; hepatitis C virus; single-cell RNA sequencing.


Conflict of interest statement

The authors declare no conflict of interest.

Figures
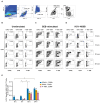
Figure 1
Figure 1
Expression of CD69, CD40L and OX40 at 18 h defines AIM+ CD4 T cells. (A) Representative gating strategy used for the detection of AIM+ cells among total CD4+ and CD8+ T cells. (BD) Representative staining for different AIM marker pairs. PBMC from a resolver of HCV reinfection were stimulated with either: (B) no peptide (unstimulated control), (C) staphylococcal enterotoxin B (SEB) (positive control), or (D) HCV non-structural protein (NS5B; aa 2708–3014) peptides pool for 6, 9, 18, or 24 h followed by the detection of AIM markers upregulation in CD4+ T cells using flow cytometry. AIM+ CD4+ T cells are defined by the expression of CD69 in conjunction with either CD40L, OX40, or 4.1BB and presented as a percentage of total CD4+ T cells. (E) Bar charts depicting the frequencies of AIM+ CD4+ T cells at the indicated time points post-stimulation. Data points represent different experimental replicates and bars represent median with interquartile range after background staining subtraction from unstimulated samples. Statistical analysis was performed using a two-way ANOVA followed by Tukey’s multiple-comparison posttest. * = p < 0.05.
Figure 2
Figure 2
AIM+ CD8+ T cells primarily express CD69 and 4-1BB at 18 h post-activation. (AC) Representative staining demonstrating the expression of various AIM marker pairs by CD8+ T cells. PBMC from a resolver of HCV reinfection were stimulated with either: (A) no peptide (unstimulated control), (B) staphylococcal enterotoxin B (SEB) (positive control), or (C) HCV non-structural protein (NS5B; aa 2708–3014) peptides pool for 6, 9, 18, or 24 h followed by the detection of AIM markers upregulation in CD8+ T cells using flow cytometry. Cells were gated as in Figure 1A. AIM+ CD8+ T cells are defined by the coexpression of CD69 and 4.1BB and presented as a percentage of total CD8+ T cells. (D) Bar charts depicting the frequencies of AIM+ CD8+ T cells at the indicated time points post-stimulation. Data points represent different experimental replicates and bars represent median with interquartile range after background staining subtraction from unstimulated samples. Two-way ANOVA followed by Tukey’s multiple-comparison posttest. * = p < 0.05.
Figure 3
Figure 3
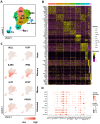
Gene expression analysis of AIM+ CD4 T cells. (A) Uniform Manifold Approximation and Projection (UMAP) plot of scRNA-seq data from AIM+ CD4 T cells that FACS sorted from an HCV-resolver subject. (B) Heatmap showing the expression of the top marker genes of each cluster. (C) Feature plots displaying the expression of representative markers of different CD4 subsets. (D) Dot plot presenting the expression of canonical CD4 markers in each cluster. Color represents the average expression and dot size represents the percentage of cells that express the gene.
Figure 4
Figure 4
Gene expression analysis of AIM+ CD8 T cells. (A) Uniform Manifold Approximation and Projection (UMAP) plot of scRNA-seq data from AIM+ CD8 T cells derived from an HCV-infected subject. (B) Heatmap showing the expression of the top marker genes of each cluster. (C) Feature plots displaying the expression of representative markers of different CD8 subsets. (D) Dot plot presenting the expression of canonical CD8 markers in each cluster. Color represents the average expression and dot size represents the percentage of cells that express the gene. Eff: Effector, EM: Effector memory, Exh: Exhausted, Exh-Pre: Precursor exhausted, Exh-Term: Terminally exhausted, ISG: Interferon-stimulated genes, TEMRA: Terminally differentiated EM.
Figure 5
Figure 5
T cell receptor analysis of AIM+ CD4 and CD8 T cells. (A,B) Uniform Manifold Approximation and Projection (UMAP) plots and bar charts showing the relative frequency of TCR clonotypes within the indicated categories in (A) AIM+ CD4 T cells and (B) AIM+ CD8 T cells. (C,D) Bar charts depicting the usage of (C) T-cell receptor alpha variable region (TRAV) and (D) T-cell receptor beta variable region (TRBV) genes in AIM+ CD4 T cells (left) and AIM+ CD8 T cells (right).

References

    1. Poloni C., Schonhofer C., Ivison S., Levings M.K., Steiner T.S., Cook L. T-cell activation-induced marker assays in health and disease. Immunol. Cell Biol. 2023;101:491–503. doi: 10.1111/imcb.12636. - DOI - PMC - PubMed
    1. Wu H., Witzl A., Ueno H. Assessment of TCR signal strength of antigen-specific memory CD8+ T cells in human blood. Blood Adv. 2019;3:2153–2163. doi: 10.1182/bloodadvances.2019000292. - DOI - PMC - PubMed
    1. Cimo A.M., Ahmed Z., McIntyre B.W., Lewis D.E., Ladbury J.E. CD25 and CD69 induction by α4β1 outside-in signalling requires TCR early signalling complex proteins. Biochem. J. 2013;454:109–121. doi: 10.1042/BJ20130485. - DOI - PMC - PubMed
    1. Altosole T., Rotta G., Uras C.R.M., Bornheimer S.J., Fenoglio D. An optimized flow cytometry protocol for simultaneous detection of T cell activation induced markers and intracellular cytokines: Application to SARS-CoV-2 immune individuals. J. Immunol. Methods. 2023;515:113443. doi: 10.1016/j.jim.2023.113443. - DOI - PMC - PubMed
    1. Grifoni A., Weiskopf D., Ramirez S.I., Mateus J., Dan J.M., Moderbacher C.R., Rawlings S.A., Sutherland A., Premkumar L., Jadi R.S., et al. Targets of T Cell Responses to SARS-CoV-2 Coronavirus in Humans with COVID-19 Disease and Unexposed Individuals. Cell. 2020;181:1489–1501.e1415. doi: 10.1016/j.cell.2020.05.015. - DOI - PMC - PubMed

Publication types

MeSH terms

Associated data