. 2024 Oct 26;12(10):e009588.
doi: 10.1136/jitc-2024-009588.

Dendritic cell-intrinsic PTPN22 negatively regulates antitumor immunity and impacts anti-PD-L1 efficacy

Affiliations

Dendritic cell-intrinsic PTPN22 negatively regulates antitumor immunity and impacts anti-PD-L1 efficacy

Santiago Acero-Bedoya et al. J Immunother Cancer. .

Abstract

Background: Individuals with a loss-of-function single-nucleotide polymorphism in the gene encoding PTPN22 have an increased risk for autoimmune diseases, and patients with cancer with such alleles may respond better to checkpoint blockade immunotherapy. Studies in PTPN22 knockout (KO) mice have established it as a negative regulator of T cell responses in cancer models. However, the role of PTPN22 in distinct immune cell compartments, such as dendritic cells (DCs), remains undefined.

Methods: We developed a novel PTPN22 conditional KO (cKO) mouse model that enables specific deletion in CD11c+ DCs by crossing to CD11c-Cre transgenic mice. Antitumor immunity was characterized using the B16.SIY and MC38.SIY cancer models and immune profiles of relevant tissues were evaluated by spectral flow cytometry. Antigen uptake, processing, and presentation, as well as DC proliferation to Flt3L, were characterized ex vivo.

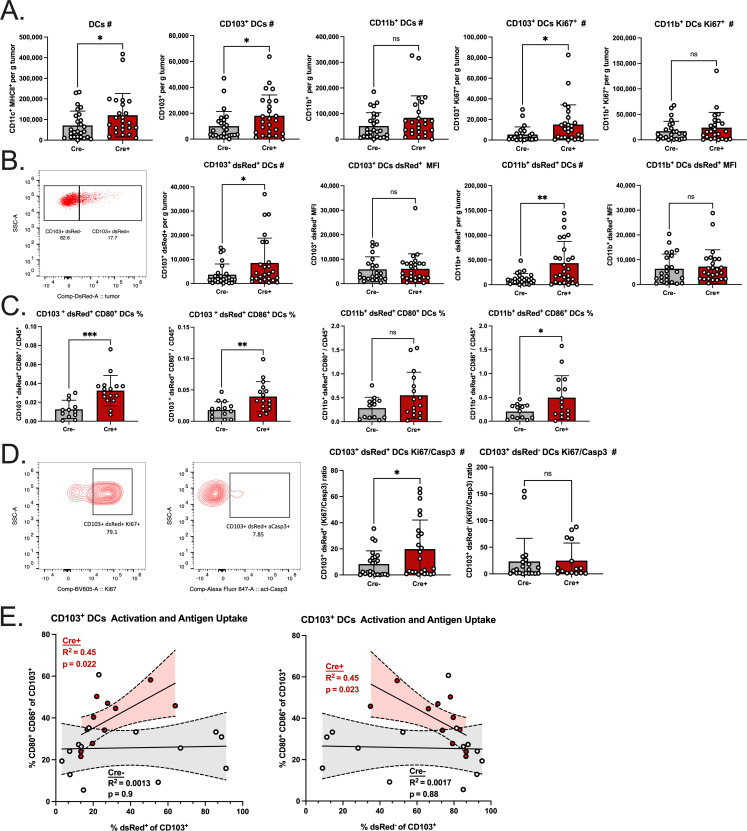
Results: Deletion of PTPN22 in DCs resulted in augmented antitumor immunity in multiple syngeneic tumor models. Tumor antigen-specific CD8+ T cells were increased in the tumor microenvironment (TME) of PTPN22 cKO mice and improved tumor control was CD8+ T cell-dependent. Augmented T cell priming was also detected at early time points in the draining lymph nodes, and these effects were correlated with an increased number of proliferating CD103+ DCs, also seen in the TME. In vitro studies revealed increased DC proliferation in response to Flt3L, as well as increased antigen processing and presentation. PTPN22 cKO mice bearing MC38 parental tumors showed combinatorial benefit with anti-PD-L1 therapy.

Conclusions: Deletion of PTPN22 in DCs is sufficient to drive an augmented tumor antigen-specific T cell response, resulting in enhanced tumor control. PTPN22 negatively regulates DC proliferation and antigen processing and presentation. Our work argues that PTPN22 is an attractive therapeutic target for cancer immunotherapy and highlights the potential to modulate antitumor immunity through the manipulation of DC signaling.

Keywords: Dendritic; Genetic; Immunotherapy; Myeloid; Solid tumor.


Conflict of interest statement

Competing interests: None declared.

Figures

Figure 1
Figure 1. Deletion of PTPN22 in DCs does not alter the immune profiles of naïve mice but drives increased spontaneous tumor control. (A) Schematic of PTPN22fl/fl CD11c-Cre+ and Cre age-matched, littermate female mice aged for 20 months for analysis, including body weight, spleen weight, and percent of CD45+ and CD3+ T cells in spleens and lymph nodes (LNs). N≥7 with control Cre mice in gray and cKO Cre+ mice in red. Data from spleens are represented as circles and from LNs as triangles. (B) Gating strategy for T cells and DCs. (C) Female mice were injected intradermally with 1 million B16.SIY (red) and male and female mice were injected subcutaneously with 1 million MC38.SIY (blue) cells and allowed to grow until endpoint. For B16.SIY, both N1H7 and N2B5 founder clones of the PTPN22fl/fl x CD11c-Cre+ mice were used with N≥15 per group and euthanized at day 27. For MC38.SIY, only the N1H7 clone of the PTPN22fl/fl x CD11c-Cre+ mice were used with N≥12 per group and euthanized at day 32. Pooled data from independent experiments are plotted for B16.SIY (N=3) and MC38.SIY (N=2). Control PTPN22fl/fl x Cre controls always presented as black/gray. Bar graph comparisons were analyzed by unpaired, two-tailed Student’s t-test and plotted as mean±SD. Tumor growth curves were analyzed by two-way ANOVA, using Sidak’s multiple comparisons tests when appropriate, and are plotted as mean±SE. Survival curves were analyzed by Kaplan-Meier survival analysis with p values for Gehan-Brewslow-Wilcoxon test reported. Significance is defined as *p<0.05, **p<0.01, ***p<0.001, ****p<0.0001. ANOVA, analysis of variance; cKO, conditional knockout; DCs, dendritic cells.
Figure 2
Figure 2. Tumors from PTPN22 cKO mice have increased activated DCs and T cells, and tumor control is dependent on CD8+ T cells. B16.SIY tumor immune infiltrates collected at day 27 from PTPN22fl/fl CD11c-Cre+ and Cre age-matched, littermate female mice showing (A) Dendritic cells (DCs) and CD103+ and CD11b+ DCs per gram of tumor. (B) The mean fluorescence intensity (MFI) of MHCII and percentage of CD103+ and CD11b+ DCs positive for Ki67. (C) Tumor immune infiltrating lymphocytes (TILS), CD8+ T cells, and antigen-specific CD8+ T cells (CD8+SIY+) per gram of tumor, along with representative gating strategies. (D) Activation and proliferation status are also shown as the percentage of CD8+SIY+ T cells positive for Ki67 and CD69. Lastly, the ratio of the number of CD8+ SIY+ T cells and regulatory T cells per gram of tumor is also shown. (E) Multivariable analysis showing the number of CD8+SIY+ T cells per gram of tumor by the number of CD103+ DCs per gram of tumor. Circle size represents tumor weight and end point, with red circles representing cKO Cre+ mice and black circles representing control Cre mice. Spearman R correlation values are reported. Pooled data from independent experiments are plotted for B16.SIY (N=3) with N≥15 per group. (F) Mice were injected weekly with 200 ng of Anti-CD8β (aCD8β) antibody or PBS. Control mice treated with PBS are represented by filled circles and solid lines, and aCD8β treated mice are represented as open triangles with dashed lines with N≥5 per group. Bar graph comparisons were analyzed using unpaired, two-tailed Student’s t-tests and plotted as mean±SD. Tumor growth curves were analyzed by two-way ANOVA, using Sidak’s multiple comparisons tests when appropriate and are plotted as mean±SE. Significance is defined as *p<0.05, **p<0.01, ***p<0.001, ****p<0.0001. ANOVA, analysis of variance; cKO, conditional knockout; DC, dendritic cell.
Figure 3
Figure 3. PTPN22 cKO mice have improved priming evident in the tdLNs at day 7 post tumor inoculation. PTPN22fl/fl x Cre+ and Cre aged-matched littermates were injected intradermally with 1 million B16.SIY cells. Spleens and tdLNs were harvested on day 7. (A) DCs in the tdLN were quantified as the total number per tdLN and subtyped as CD103+CD11b, CD8α+CD11b, and CD11b+CD103. (B) Activation and proliferation status of CD103+ DCs showing the percentage of CD80, CD86, and Ki67 positive cells along with representative flow plots. (C) Representative flow plot showing identification of CD8+SIY+ T cells along with the number of CD8+SIY+ T cells per tdLN. Splenocytes were cultured overnight to quantify IFN-γ production via ELISpot and IL-2 production via ELISA of conditioned media. Pooled data are plotted from independent experiments (N=2) with N≥9 per group. Bar graph comparisons were analyzed by unpaired, two-tailed Student’s t-test and plotted as mean±SD. Significance is defined as *p<0.05, **p<0.01, ***p<0.001, ****p<0.0001. DC, dendritic cell; tdLNs, tumor-draining lymph nodes.
Figure 4
Figure 4. Tumors in PTPN22 cKO mice have more proliferating and activated, antigen-loaded DCs. Intratumoral DCs from day 20 tumor-bearing, PTPN22fl/fl x Cre+ and Cre aged-matched littermate mice were quantified. (A) Number of DCs, CD103+ DCs, CD11b+ DCs, and CD103+ Ki67+ and CD11b+ Ki67+ DCs per gram of tumor. (B) Representative flow plot showing identification of dsRed+ DCs. Quantification of the number and percentage of dsRed+ CD103+ DCs and CD11b+ DCs, respectively. (C) Activation profile of dsRed+ DCs measured as percentage of CD80 and CD86 positive cells. (D) Representative flow plots of CD103+ dsRed+ DCs positive for Ki67 and activated-Caspase3 (aCasp3) and the ratio of the number of Ki67 positive cells per gram of tumor over the number of aCasp3 positive cells per gram of tumor for CD103+dsRed+ and CD103+dsRed DCs, respectively. (E) Correlation plots showing the percentage of CD80 and CD86 double-positive cells of CD103+ DCs by the percentage of dsRed positive (left) and dsRed negative (right) cells of CD103+ DCs, with Cre+ represented in red and Cre represented in gray. R2 and p value for non-zero slope from a simple linear regression model is reported with 95% CI shading in gray within dotted lines. Pooled data from three independent experiments are plotted (N≥16 per group). Bar graph comparisons were analyzed by unpaired, two-tailed Student’s t-test and plotted as mean±SD. Significance is defined as *p<0.05, **p<0.01, ***p<0.001, ****p<0.0001. cKO, conditional knockout; DC, dendritic cell.
Figure 5
Figure 5. PTPN22 cKO DCs are more responsive to Flt3L-mediated proliferation and process and present more antigen in vitro. scRNAseq data were used to test for the expression Flt3 and Flt3L in MC38.SIY tumors. (A) A UMAP of cell clusters and (B) expression of Flt3 and Flt3L across all populations. (C) Splenic and lymph node-derived DCs were treated with 100 ng/mL of recombinant Flt3L (rFLT3L) for 48 hours, and Ki67 staining was assessed. Separately, splenic DCs were cultured in vitro and exposed to multiple concentrations of DQ-OVA substrate for 4 hours. (D) Antigen processing was assessed in CD103+ DCs, represented by MFI of hydrolyzed DQ-OVA normalized to cells not exposed to any substrate. Area under the curve (AUC) for the entire serial dilution was calculated. (E) A monoclonal antibody against OVA-loaded MHCI was used to calculate the percentage of cells positive for H2-Kb-OVA for CD103+ DCs. (F) The percent of H2-Kb-OVA positive cells was also compared in PTPN22 cKO CD103+ DCs and CD11b+ DCs and the correlation of DQ-OVA MFI by the percent of H2-Kb-OVA positive CD103+ DCs. R2 and p value for non-zero slope are reported with a 95% CI in gray within dashed lines. Experiments are representative of 3–4 independent experiments performed with both female and male mice with N=7 per group. Violin plots were similarly analyzed by two-way ANOVA and Sidak’s multiple comparisons test and by calculating the AUC and comparing it with an unpaired, two-tailed Student’s t-test. Significance is defined as *p<0.05, **p<0.01, ***p<0.001, ****p<0.0001. ANOVA, analysis of variance; DC, dendritic cell; MFI, mean fluorescence intensities.
Figure 6
Figure 6. PTPN22 cKO in DCs improves efficacy of anti-PD-L1. (A) PTPN22fl/fl x Cre+ and Cre aged-matched littermate female mice were injected intradermally with B16.SIY and treated intraperitoneally with 200 ng of anti-PD-L1 (aPD-L1) or vehicle (PBS) on the days indicated by the red arrows. Growth curves (left) and survival plots (right) are shown with vehicle-treated mice represented by solid lines and open circles and aPD-L1 treated mice represented by solid circles and dashed lines. (B) PTPN22fl/fl x Cre+ and Cre aged-matched littermate male mice were injected subcutaneously with MC38 parental cell line and treated intraperitoneally with 200 ng of anti-PD-L1 (aPD-L1) or vehicle (PBS) on the days indicated by the red arrows. Growth curves (left) and survival plots (right) are shown with vehicle-treated mice represented by solid lines and open circles and aPD-L1 treated mice represented by solid circles and dashed lines. Data shown are representative of at least two individual experiments with N≥8 per group for B16.SIY and N≥10 per group for MC38. Tumor growth curves were analyzed by two-way ANOVA, using Sidak’s multiple comparisons tests when appropriate, and are plotted as mean±SE. Survival curves were analyzed by Kaplan-Meier survival analysis with p values for Gehan-Brewslow-Wilcoxon test reported. Significance is defined as *p<0.05, **p<0.01, ***p<0.001, ****p<0.0001. ANOVA, analysis of variance; DCs, dendritic cell.

References

    1. Mangani D, Yang D, Anderson AC. Learning from the nexus of autoimmunity and cancer. Immunity. 2023;56:256–71. doi: 10.1016/j.immuni.2023.01.022. - DOI - PMC - PubMed
    1. Darnell EP, Mooradian MJ, Baruch EN, et al. Immune-Related Adverse Events (irAEs): Diagnosis, Management, and Clinical Pearls. Curr Oncol Rep. 2020;22:39. doi: 10.1007/s11912-020-0897-9. - DOI - PubMed
    1. Conroy M, Naidoo J. Immune-related adverse events and the balancing act of immunotherapy. Nat Commun. 2022;13:392. doi: 10.1038/s41467-022-27960-2. - DOI - PMC - PubMed
    1. Hua C, Boussemart L, Mateus C, et al. Association of Vitiligo With Tumor Response in Patients With Metastatic Melanoma Treated With Pembrolizumab. JAMA Dermatol. 2016;152:45–51. doi: 10.1001/jamadermatol.2015.2707. - DOI - PubMed
    1. Guida M, Strippoli S, Maule M, et al. Immune checkpoint inhibitor associated vitiligo and its impact on survival in patients with metastatic melanoma: an Italian Melanoma Intergroup study. ESMO Open. 2021;6:100064. doi: 10.1016/j.esmoop.2021.100064. - DOI - PMC - PubMed

Substances

LinkOut - more resources