. 2024 Oct 26;15(1):9246.
doi: 10.1038/s41467-024-53388-x.

Atypical rhizobia trigger nodulation and pathogenesis on the same legume hosts

Affiliations

Atypical rhizobia trigger nodulation and pathogenesis on the same legume hosts

Kévin Magne et al. Nat Commun. .

Abstract

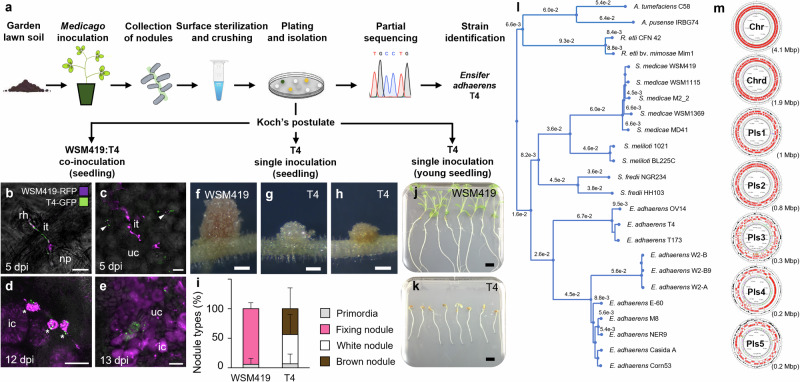
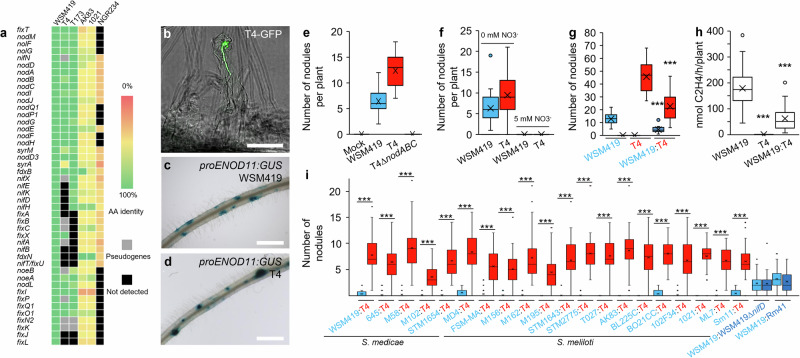
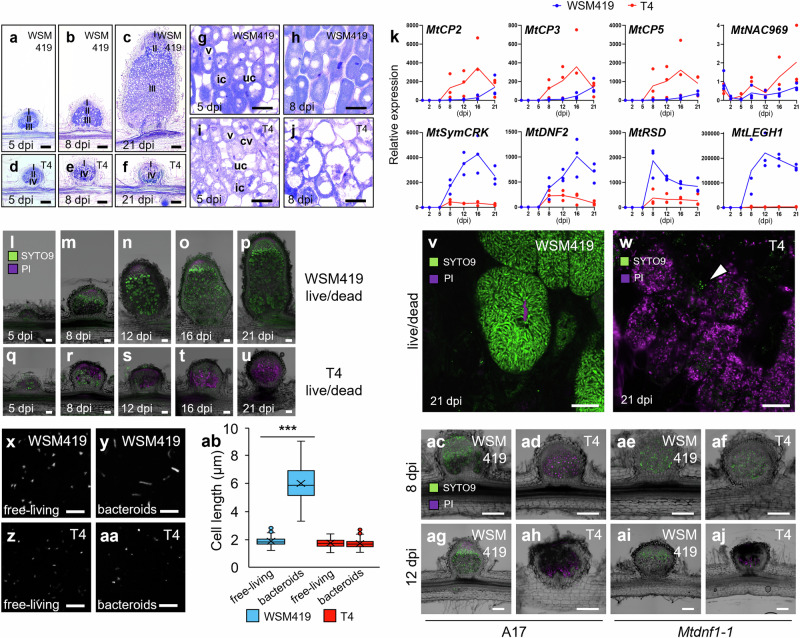
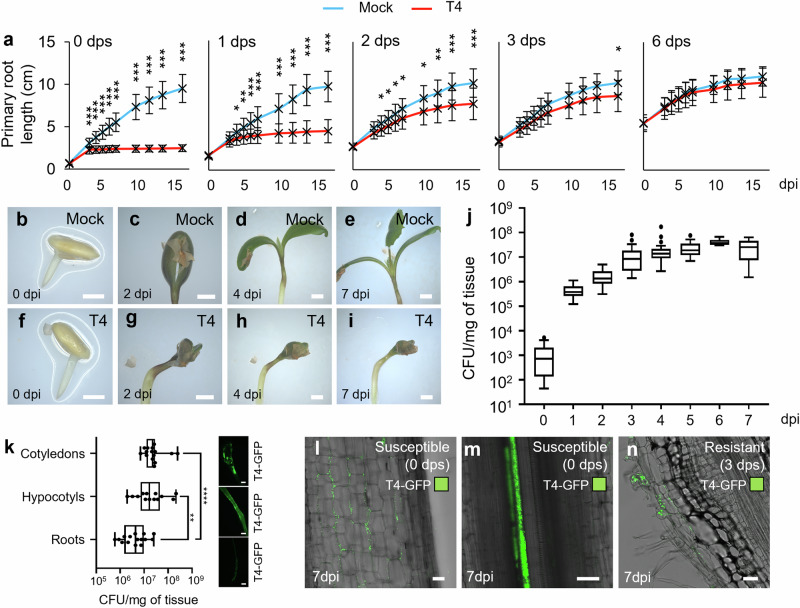
The emergence of commensalism and mutualism often derives from ancestral parasitism. However, in the case of rhizobium-legume interactions, bacterial strains displaying both pathogenic and nodulation features on a single host have not been described yet. Here, we isolated such a bacterium from Medicago nodules. On the same plant genotypes, the T4 strain can induce ineffective nodules in a highly competitive way and behave as a harsh parasite triggering plant death. The T4 strain presents this dual ability on multiple legume species of the Inverted Repeat-Lacking Clade, the output of the interaction relying on the developmental stage of the plant. Genomic and phenotypic clustering analysis show that T4 belongs to the nonsymbiotic Ensifer adhaerens group and clusters together with T173, another strain harboring this dual ability. In this work, we identify a bacterial clade that includes rhizobial strains displaying both pathogenic and nodulating abilities on a single legume host.


Conflict of interest statement

The authors declare no competing interests

Figures

Fig. 1
Fig. 1. T4 is an Ensifer adhaerens strain co-colonizing nodules with effective rhizobia, inducing ineffective nodules by itself and triggering the death of its host.
a Schematic procedure used to trap Medicago littoralis R108 (R108) nodule endophytes and to validate the Koch’s postulate. be When Ensifer adhaerens T4-GFP (T4-GFP, green signal) is co-inoculated with the efficient symbionts Sinorhizobium medicae WSM419-RFP (WSM419-RFP, violet signal), T4 behave as a nodule endophyte and co-colonized M. truncatula A17 (A17) nodules. b A 5-dpi root hair showing both WSM419-RFP and T4-GFP in a single infection thread. c WSM419-RFP and T4-GFP in common infection threads (white arrowheads), within a 5-dpi nodule primordium. d 12-dpi nodule cells showing the release of WSM419-RFP and T4-GFP bacteroids from infection threads in common infected-cells (white asterisks). e 13-dpi nodule infected cells containing both WSM419-RFP and T4-GFP. (Scale bars b, c, e, 20 µm; d, 50 µm). rh, root hair; it, infection thread; np, nodule primordium; uc, uninfected cell; ic, infected cell; dpi, days post-inoculation. For b-e, similar results were observed in three independent experiments. f-i T4 induced, by itself, the formation of nodules on A17 seedlings. f 14-dpi WSM419 nodule. g, h 14-dpi T4 nodules. (Scale bar fh, 500 µm). For fh, similar results were observed in four independent experiments. i Percentage of nodule types present on WSM419- and T4-inoculated plants shown as mean percentage ± s.d. (n = 24 plants). j and k T4 triggered the death of A17 young seedlings. WSM419- (j) and T4- (k) infected plants at 21 dpi. (Scale bars j and k, 1 cm). l Neighbor-joining phylogenetic tree based on whole bacterial genomes including that of T4 and of other strains of the same species, genus or order. m Organization of the T4 genome. The T4 genome is composed of seven circular replicons, one chromosome (Chr), one chromid (Chrd), and five plasmids (Pls1 to Pls5). Plasmid sizes are indicated. A remarkable feature of the T4 genome is the heterogeneous density of repeated regions along the different replicons. Especially, Pls3 harbors 27% of repeated sequences, mostly transposase encoding genes, whereas repeated sequences represent less than 3% of the genome in the other replicons (Supplementary Fig. 2; Supplementary Fig. 3). Source data for Fig. 1i are provided in Source Data file.
Fig. 2
Fig. 2. E. adhaerens T4 NF-dependent nodulation and T4 competitiveness.
a T4 harbors nod genes but lacks core nif genes. Heatmap representing the presence/absence of symbiotic genes in T4, T173, S. meliloti AK83, S. meliloti 1021 and S. fredii NGR234 using WSM419 as a reference. The color scale indicates the percentage of identities (amino acid, %) relative to WSM419 reference proteins. For each replicon carrying the nod genes of each strain, detected pseudogene and lacking genes are highlighted in gray and black, respectively. bf The nodulation ability of the T4 strain relied on the production of Nod factors. b Confocal imaging of T4-GFP entering root hair through an infection thread. (Scale bars, 50 µm). Confocal imaging experiments consisted of four independent experiments. c, d Induction of the Nod factor-reporter construct proENOD11:gusA by WSM419 (c) and T4 (d) in 2-dpi primary root of A17 stable transformants expressing the gusA reporter fusion proENOD11:gusA (n = 12 plants). (Scale bars, 1 mm). e T4 nodABC genes are required to induce nodule formation. For mock, WSM419, T4 and T4ΔnodABC, n = 8, 16, 13 and 32 plants. Experiments have been repeated twice. f Nitrogen inhibits T4 nodule formation. For WSM419 0 mM NO3, T4 0 mM NO3, WSM419 5 mM NO3, T4 5 mM NO3, n = 39, 39, 30 and 12 plants. Experiments have been repeated twice. g T4 induced more nodules than WSM419 upon single inoculation and reduced the formation of WSM419 nodules when co-inoculated. Three biological replicates have been performed (n = 30 plants). h T4 did not fix nitrogen and reduced the nitrogen fixation of plants when co-inoculated with WSM419. Three biological replicates have been performed (n = 30 plants). i T4 dominated nodule formation over efficient nitrogen-fixing symbionts. Co-inoculation of T4 with nitrogen-fixing S. medicae and S. meliloti strains. Each boxplot reflects the analysis of 40 plants. ei Plants were analyzed at 21 dpi. For each box-and-whisker plot, the box contains 50% of the data, the bottom and the top of the box represent Q1 and Q3, respectively, the center line indicates the median, the center cross indicates the mean, the whiskers indicate the data that range within 1.5 time the interquartile range and if they exist, outliers are shown. Asterisks indicate significant differences (***, P ≤ 0.001; P values in g = 9.10−13 and 7.10−10; P values in h = 3.10−19 and 7.10−10; Two-sided Student’s t-test). Source data for Fig. 2e-i are provided in Source Data file.
Fig. 3
Fig. 3. E. adhaerens T4 nodules are prematurely stopped in their development and undergo a senescence process.
a-f Histological analysis of WSM419 (ac) and T4 (df) nodule development. I, meristematic zone; II, infection zone; III, fixation zone and IV, premature senescence zone (IV). gj Histological analysis of WSM419 (g, h) and T4 (i, j) nodule infected cells. v, vacuole; cv, collapsed vacuole; uc, uninfected cell and ic, infected cell. (Scale bars af, 200 μm; gj, 40 μm). For a-j, similar results were observed using three independent kinetics. k RT-qPCR gene expression profiles of senescence marker genes MtCP2, MtCP3, MtCP5 and MtNAC969, and of symbiotic marker genes MtSymCRK, MtDNF2, MtRSD and MtLEGH1 along WSM419 (blue curves) and T4 (red curves) nodulation kinetics. Dots represent three independent biological replicates (n = 3). Gene accessions are provided (Supplementary Data 4). lu Live/dead staining showing the viability of WSM419 and T4 bacteroids during nodulation. SYTO9 green signals indicate alive bacteroids. PI violet signals indicate dead bacteroids, cell walls, nuclei and nodule meristem. (Scale bars lu, 100 µm). For lu, the kinetics experiment was done once. v and w Live/dead staining showing WSM419 and T4 bacteroid viability and morphological differentiation within infected cells of 21-dpi nodules. v WSM419 nodule-infected cells were densely filled with morphologically differentiated and alive bacteroids. w T4 nodule-infected cells were occupied by dead and undifferentiated bacteroids. Some T4 bacteria were alive (Arrowhead). (Scale bars v and w, 20 µm). x-ab Morphological differentiation and cell size of WSM419 and T4 under free-living and bacteroid states. xaa Fluorescence microscopy showing DAPI-stained undifferentiated free-living WSM419 (x), differentiated WSM419 bacteroids (y), undifferentiated free-living T4 (z) and undifferentiated T4 bacteroids (aa). (Scale bars xaa, 10 µm). For xaa, pictures were acquired from a single experiment. ab Cell length of WSM419 and T4 under free-living and bacteroid states. For each box-and-whisker plot, the box contains 50% of the data, the bottom and the top of the box represent Q1 and Q3, respectively, the center line indicates the median, the center cross indicates the mean, the whiskers indicate the data that range within 1.5 times the interquartile range and if they exist, outliers are shown (n = 100 cells). Asterisks indicate a significant difference compared to free-living WSM419 (***P value ≤ 0.001; P value in ab = 2.10-84; Two-sided Student’s t-test). acaj Live/dead staining showing the viability of WSM419 and T4 bacteroids in A17 and Mtdnf1-1 at 8 and 12 dpi. In Mtdnf1-1, the death of T4 bacteroids is delayed compared to the wild type. (Scale bars acaj, 200 µm). The experiment was performed twice. Source data for Fig. 3k, ab are provided in Source Data file.
Fig. 4
Fig. 4. T4 behaves as a virulent pathogens affecting young M. truncatula seedlings.
a A17 susceptible-to-resistant shift. Plants were inoculated, or not, with T4 (OD600nm: 0.1) at 0, 1, 2, 3 and 6 days post-stratification (dps). Primary roots length was monitored as a plant health proxy. Data represent means ± SEM of three biological replicates (n = 60 plants). Asterisks indicate significant differences (*P ≤ 0.01; **P ≤ 0.001; ***P ≤ 0.0001; Two-sided Student’s t-test). b-i T4 triggers the non-aperture of 0-dps A17 cotyledons (n = 51 plants). (Scale bars bi, 2 mm). j Dynamic of T4 proliferation on the whole A17 seedling. For 0, 1, 2, 3, 4, 5, 6 and 7 dpi, n = 19, 15, 15, 23, 23, 10, 10 and 5 plants. k T4 colonization of susceptible A17 cotyledon, hypocotyl and root at ten dpi. Experiments were performed twice. For cotyledon, hypocotyl and root, n = 15, 13 and 15 organs. Asterisks indicate significant differences (**P ≤ 0.01; ****P ≤ 0.0001; P values = 4.10−3 and 4.10−5; Two-sided Mann and Whitney test). Pictures show corresponding T4-GFP colonizations. (Scale bars k, 1 mm). j and k For each box-and-whisker plot, the box contains 50% of the data, the bottom and the top of the box represent Q1 and Q3, respectively, the center line indicates the median, the center cross indicates the mean, the whiskers indicate the data that range within 1.5 time the interquartile range and if they exist, outliers are shown. ln Localization of T4-GFP in susceptible (l and m) and resistant (n) A17 roots. (Scale bars ln, 50 µm). The experiment was performed twice and similar results were observed. Source data for Fig. 4a, j, k are provided in Source Data file.
Fig. 5
Fig. 5. T4 and T173 form a taxonomic cluster of virulent pathogens affecting young seedlings from various IRLC species.
a Pathogenic and nodulation abilities of T4 on legume species. Pie charts represent the percentage of alive and dead plants. For M. truncatula, charts correspond to A17, Parragio, F83005.5 and Ghor, and for M. sativa, to Super GRI8, WL903, G969, Salina and Oleron. Nod+ and Nod indicate nodulation ability. Maximum Likelihood phylogenetic tree shows the evolutionary history of legumes (Supplementary Data 5). The IRLC is indicated by an arrowhead. b The T4 virulence is NFs-independent. Primary root length and mortality at 21 dpi were used as proxy. For mock, WSM419, T4 and T4ΔnodABC, n = 16, 16, 16 and 32 plants. c Evaluation of the virulence of different E. adhaerens strains. Plant dry weight and mortality at 16 dpi were used as readouts. For mock, T4, T173, Casida A, R-7457, BR819 and OV14, n = 56, 64, 31, 32, 32, 32 and 32 plants. Nod+ and Nod indicate nodulation ability. b and c For each box-and-whisker plot, the box contains 50% of the data, the bottom and the top of the box represent Q1 and Q3, respectively, the center line indicates the median, the center cross indicates the mean, the whiskers indicate the data that range within 1.5 time the interquartile range and if they exist, outliers are shown. Asterisks indicate significant differences compared to mock treatments (***P ≤ 0.0001; P values in b = 2.10−13 and 6.10−22; P values in c = 2.10−22 and 2.10−15; Two-sided Student’s t-test). d Hierarchical clustering analysis of biolog phenotypic microarray datasets. The heatmap represents normalized areas under the curve for carbon usage plates PM01 and PM02 (Supplementary Data 6). #, data retrieved from Fagorzi et al., 2020. Source data for Fig. 5a, b, c are provided in Source Data file.

References

    1. Drew, G. C., Stevens, E. J. & King, K. C. Microbial evolution and transitions along the parasite-mutualist continuum. Nat. Rev. Microbiol19, 623–638 (2021). - PMC - PubMed
    1. Liang, Y. et al. Nonlegumes respond to rhizobial Nod factors by suppressing the innate immune response. Science341, 1384–1387 (2013). - PubMed
    1. Nishiguchi, M. K. et al. Deciphering evolutionary mechanisms between mutualistic and pathogenic symbioses. Vie et. milieu58, 87–106 (2008). - PMC - PubMed
    1. Sachs, J. L., Skophammer, R. G., Bansal, N. & Stajich, J. E. Evolutionary origins and diversification of proteobacterial mutualists. Proc. Biol. Sci.281, 20132146 (2014). - PMC - PubMed
    1. Sachs, J. L., Skophammer, R. G. & Regus, J. U. Evolutionary transitions in bacterial symbiosis. Proc. Natl Acad. Sci. USA108, 10800–10807 (2011). - PMC - PubMed

Publication types