. 2024 Oct 26;14(1):25519.
doi: 10.1038/s41598-024-75982-1.

Histamine stimulates human microglia to alter cellular prion protein expression via the HRH2 histamine receptor

Affiliations

Histamine stimulates human microglia to alter cellular prion protein expression via the HRH2 histamine receptor

Marcus Pehar et al. Sci Rep. .

Abstract

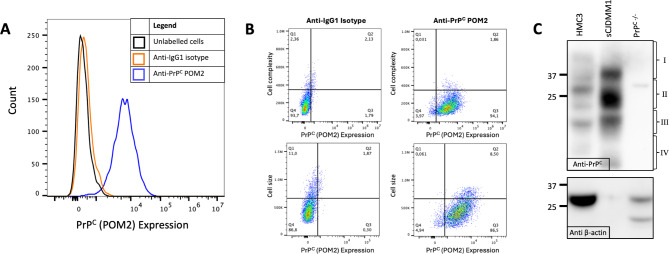
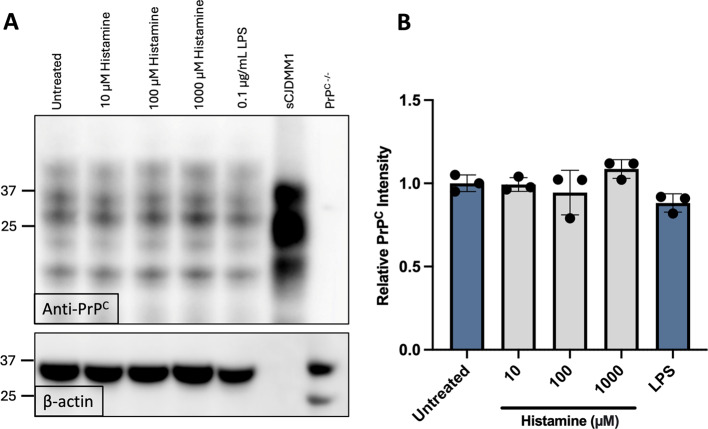
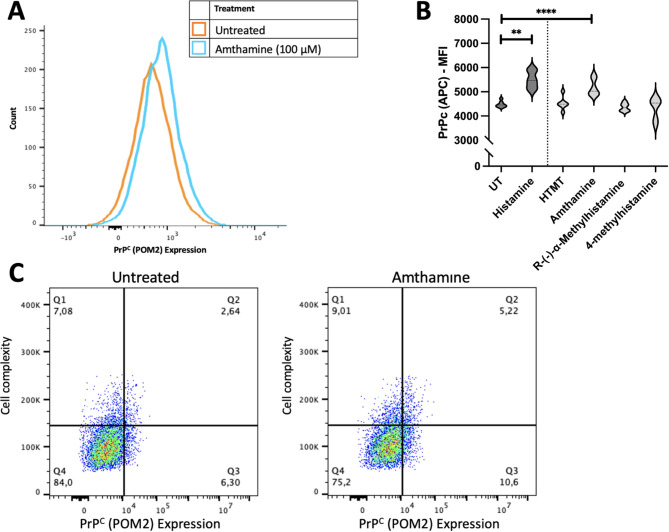
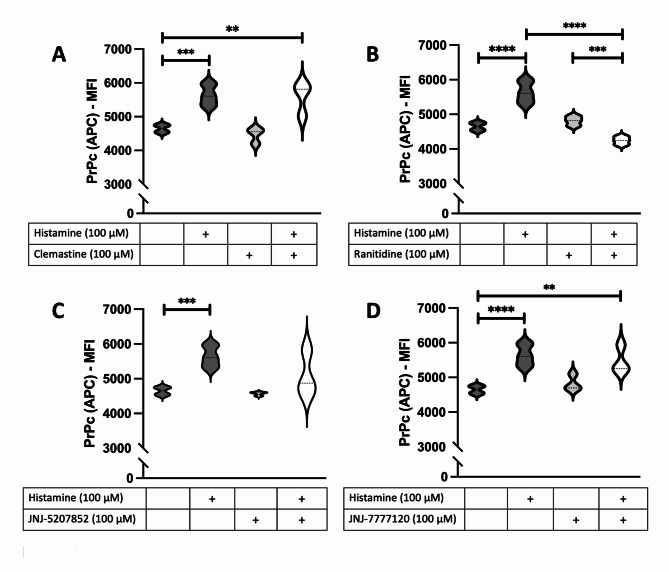
Although the cellular prion protein (PrPC) has been evolutionarily conserved, the role of this protein remains elusive. Recent evidence indicates that PrPC may be involved in neuroinflammation and the immune response in the brain, and its expression may be modified via various mechanisms. Histamine is a proinflammatory mediator and neurotransmitter that stimulates numerous cells via interactions with histamine receptors 1-4 (HRH1-4). Since microglia are the innate immune cells of the central nervous system, we hypothesized that histamine-induced stimulation regulates the expression of PrPC in human-derived microglia. The human microglial clone 3 (HMC3) cell line was treated with histamine, and intracellular calcium levels were measured via a calcium flux assay. Cytokine production was monitored by enzyme-linked immunosorbent assay (ELISA). Western blotting and quantitative reverse transcription-polymerase chain reaction were used to determine protein and gene expression of HRH1-4. Flow cytometry and western blotting were used to measure PrPC expression levels. Fluorescence microscopy was used to examine Iba-1 and PrPC localization. HMC3 cells stimulated by histamine exhibited increased intracellular calcium levels and increased release of IL-6 and IL-8, while also modifying PrPC localization. HMC3 stimulated with histamine for 6 and 24 hours exhibited increased surface PrPC expression. Specifically, we found that stimulation of the HRH2 receptor was responsible for changes in surface PrPC. Histamine-induced increases in surface PrPC were attenuated following inhibition of the HRH2 receptor via the HRH2 antagonist ranitidine. These changes were unique to HRH2 activation, as stimulation of HRH1, HRH3, or HRH4 did not alter surface PrPC. Prolonged stimulation of HMC3 decreased PrPC expression following 48 and 72 hours of histamine stimulation. HMC3 cells can be stimulated by histamine to undergo intracellular calcium influx. Surface expression levels of PrPC on HMC3 cells are altered by histamine exposure, primarily mediated by HRH2. While histamine exposure also increases release of IL-6 and IL-8 in these cells, this cytokine release is not fully dependent on PrPC levels, as IL-6 release is only partially reduced and IL-8 release is unchanged under the conditions of HRH2 blockade that prevent PrPC changes. Overall, this suggests that PrPC may play a role in modulating microglial responses.

Keywords: Degranulation; Histamine; Mast cell; Microglia; Neuroinflammation; Prion protein.


Conflict of interest statement

The authors declare no competing interests.

Figures

Fig. 1
Fig. 1
Cryo-SEM images of homeostatic HMC3 cells. HMC3 were cultured on coverslips treated with poly-D-lysine and Cryo-SEM images were collected. Cells were observed in various morphological states including (A) a homeostatic state, (B) an ameboid-like state, (C) a rod-like state, or (D) a ramified or hyper-ramified state. In bottom panels, boxes represent fields of view following increased magnification on the rod-like and ramified microglia.
Fig. 2
Fig. 2
Human-derived HMC3 microglia express three of the four known histamine receptors. (A) RNA from HMC3 or LAD2 cells were isolated, and the expression of HRH1, HRH2, HRH3, and HRH4 was analysed. The data are presented as the average delta Ct (cycle threshold) for four independently isolated RNA samples; the expression of mRNA for each gene is relative to the GAPDH mRNA expression for each cDNA sample. (N = 5, bars indicate ± SD). (B-E) HMC3 or human frontal lobe homogenates (HuFLH) were isolated, and lysates were analysed via western blotting to test for protein expression of (B) HRH1, (C) HRH2, (D) HRH3, or (E) HRH4. Representative images of three independent experiments are shown. Uncropped blots are shown in Supplementary A.
Fig. 3
Fig. 3
Histamine stimulates HMC3 cells to alter cytokine production and intracellular calcium levels, but not metabolic activity or Iba-1 expression. (A-B) HMC3 cells were stimulated with (A) histamine (0.1 µM – 1000 µM) or (B) LPS or left untreated for 24 hours and metabolic activity was measured by a reduction in XTT. The data are presented as the means ± SEMs (N = 6). (C-D) HMC3 cells were stimulated by histamine (10 µM, 100 µM, or 1000 µM), LPS (1 µg/mL), or left untreated for 24 hours, and (C) IL-8 and (D) IL-6 were measured by sandwich ELISA. Data are presented as the mean ± SEM (N = 9) and statistical significance was measured via one-way ANOVA and Dunnett’s multiple comparison post-hoc analysis relative to untreated (UT) cells. p ≤ 0.05 (*), p ≤ 0.01 (**), p ≤ 0.001 (***), p ≤ 0.0001 (****). (N = 4). (E) HMC3 cells were stimulated by histamine (100 µM) (blue) or 4-bromo-A23187 (1 µM) (orange) and intracellular calcium was measured via fura-2 AM dye which increases the 340/380 fluorescence ratio when bound to calcium ions. (F-H) Fluorescence microscopy images of HMC3 cells labelled with Hoechst 33342 (Hoechst) (blue) and Iba-1 (red) under (F) untreated conditions and following 24 hours treatment with (G) LPS and (H) histamine. Images are representative of four independent experiments using a 20× objective and a Leica Stellaris 5 microscope.
Fig. 4
Fig. 4
HMC3 cells express PrPC. (A) Flow cytometry immunolabelling of HMC3 cells with anti-PrPC POM2. Black line: unlabelled HMC3 cells; orange line: HMC3 cells labelled with an IgG1κ isotype control; blue line: HMC3 cells labelled with the POM2 anti-prion protein antibody. (B) Flow cytometry scatterplots showing side scatter (cell complexity, top) or forward scatter (cell size, bottom) relative to PrPC expression (x-axis). (C) Immunoblot of total PrPC expression in HMC3 cells. Top: The anti-PrPC 3F4 antibody indicated (I) di-, (II) mono-, and (III) unglycosylated forms, as well as (IV) PrPC C-terminal fragments. sCJDMM1 from human brain homogenates was included as a positive control. PrPC−/− BMMCs were included as negative control. Bottom: Anti-formula image-actin was used to indicate protein loading. (N = 3). Uncropped blots are shown in Supplementary B.
Fig. 5
Fig. 5
Histamine alters surface PrPCexpression on HMC3 cells. Flow cytometry analysis of cell surface PrPC following exposure to 10, 100, or 1000 µM histamine for (A) 6, (B) 24, (C) 48, or (D) 72 hours. MFI = Mean Fluorescent Intensity. Statistical significance was calculated using One-way ANOVA with Tukey’s post hoc analysis, p ≤ 0.01 (**), p ≤ 0.001 (***), p ≤ 0.0001 (****). Individual scatterplots were included to show side scatter against PrPC. Graphs plot side scatter (y-axis) as a measurement of cell complexity against PrPC expression (x-axis). The percentages in each corner reflect the population of cells in each quadrant. (N = 4).
Fig. 6
Fig. 6
Histamine does not change total PrPCexpression in HMC3 cells. (A) Representative western blot image of HMC3 cells treated with various concentrations of histamine or LPS for 24 hours. Top: Anti-PrPC 3F4 antibody. Bottom: Anti-formula image-actin was used to indicate protein loading. Human sCJDMM1 was included as a positive control. PrP−/− BMMC were included as negative control. (B) Quantification of western blot band intensity. The relative intensity was quantified against that of untreated controls. (N = 3 bars indicate ± SEM). Uncropped blots are shown in Supplementary C.
Fig. 7
Fig. 7
Immunofluorescence detection of surface PrPCexpression in HMC3 cells treated with histamine and LPS. Representative fluorescence microscopy images of HMC3 labelled with Hoechst 33342 (blue) and anti-PrPC POM2 (red) under (A) untreated conditions or after 24 hours of stimulation by (B) histamine or (C) LPS. Images are representative of three independent experiments using a 20× objective and a Leica Stellaris 5 microscope.
Fig. 8
Fig. 8
PrPCexpression following activation of histamine receptors. (A) HMC3 cells were stimulated with the HRH2 agonist amthamine for 24 hours and surface PrPC levels were measured via flow cytometry. (B) HMC3 cells were treated with 100 µM of histamine, HTMT (an HRH1 agonist), amthamine (an HRH2 agonist), R-(–)-α-methylhistamine (an HRH3 agonist), or 4-methylhistamine (an HRH4 agonist) for 24 hours and surface PrPC levels were measured via flow cytometry. The mean fluorescent intensity (MFI) was quantified, and statistical significance was calculated using one-way ANOVA with Tukey’s post hoc analysis, p ≤ 0.01 (**), p ≤ 0.0001 (****). (C) Individual scatterplots show side scatter against PrPC. Graphs plot side scatter (y-axis) as a measurement of cell complexity against PrPC expression (x-axis). The percentages in each corner reflect population of cells in each quadrant. (N = 4).
Fig. 9
Fig. 9
Histamine acts via the HRH2 receptor to upregulate surface PrPCexpression. HMC3 cells were treated with 100 µM (A) clemastine (an HRH1 antagonist), (B) ranitidine (an HRH2 antagonist), (C) JNJ-5207852 (an HRH3 antagonist), or (D) JNJ-7777120 (an HRH4 antagonist) for 1 hour, and then treated with 100 µM histamine for 24 hours, after which PrPC expression was measured by flow cytometry. Statistical significance was calculated using one-way ANOVA with Tukey’s post hoc analysis, p ≤ 0.01 (**), p ≤ 0.001 (***), p ≤ 0.0001 (****). (N = 4).

References

    1. Nimmerjahn, A., Kirchhoff, F. & Helmchen, F. Resting microglial cells are highly dynamic surveillants of brain parenchyma in vivo. Science308(5726), 1314–1318 (2005). - PubMed
    1. Kyrargyri, V. et al. P2Y(13) receptors regulate microglial morphology, surveillance, and resting levels of interleukin 1β release. Glia68(2), 328–344 (2020). - PMC - PubMed
    1. Dong, H. et al. Histamine induces upregulated expression of histamine receptors and increases release of inflammatory mediators from microglia. Mol. Neurobiol.49(3), 1487–1500 (2014). - PubMed
    1. Sandhu, J. K., Kulka, M. Decoding mast cell-microglia communication in neurodegenerative diseases. Int. J. Mol. Sci. 22(3), (2021). - PMC - PubMed
    1. Scammell, T. E., Jackson, A. C., Franks, N. P., Wisden, W., Dauvilliers, Y. Histamine: Neural circuits and new medications. Sleep. 42(1), (2019). - PMC - PubMed

LinkOut - more resources