. 2024 Oct 26;7(1):1398.
doi: 10.1038/s42003-024-06967-z.

Validation of metaxin-2 deficient C. elegans as a model for MandibuloAcral Dysplasia associated to mtx-2 (MADaM) syndrome

Affiliations

Validation of metaxin-2 deficient C. elegans as a model for MandibuloAcral Dysplasia associated to mtx-2 (MADaM) syndrome

Chloé Talarmin-Gas et al. Commun Biol. .

Abstract

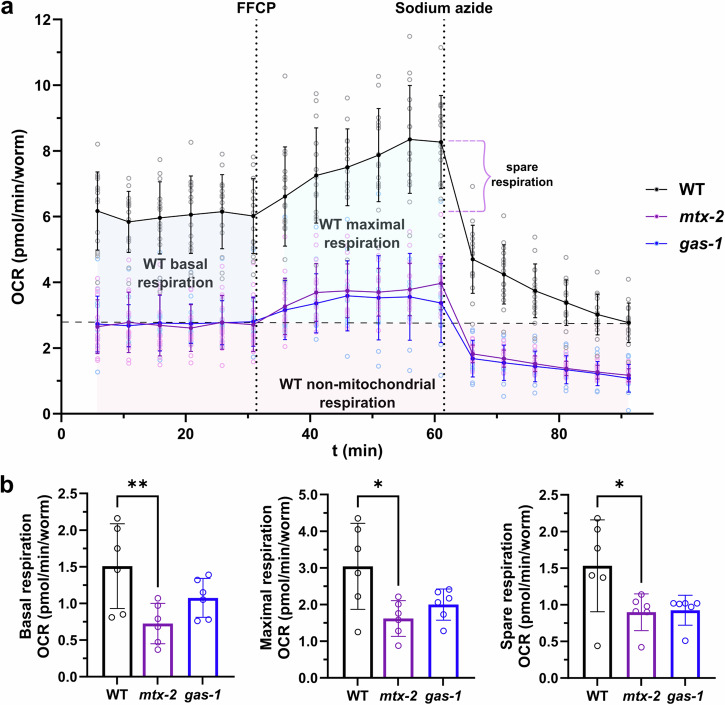
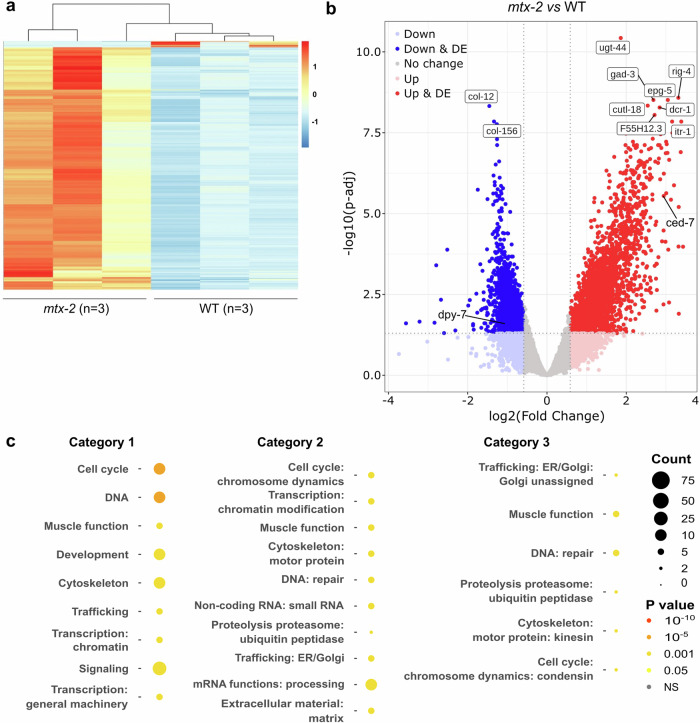
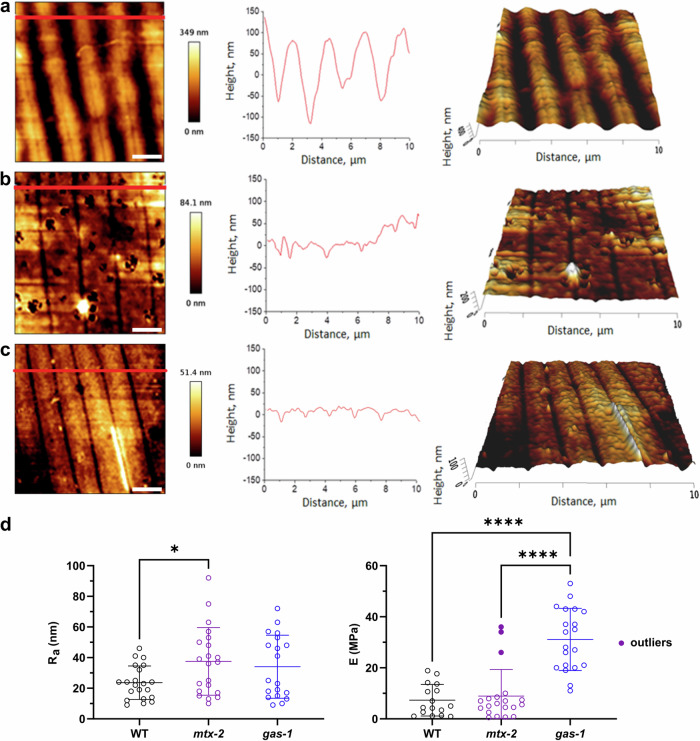
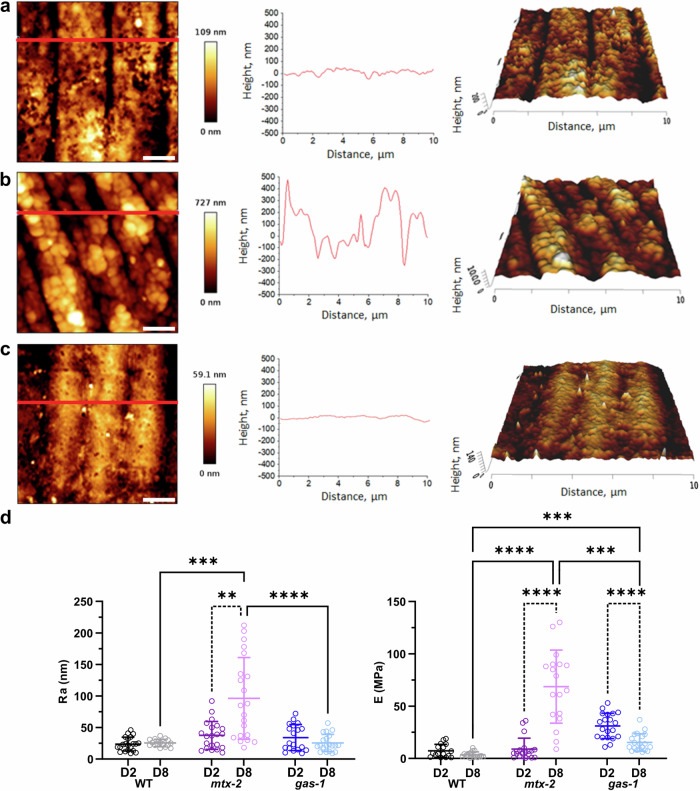
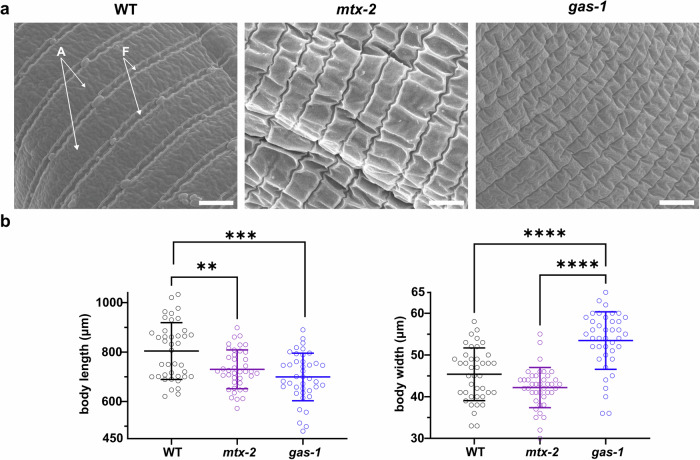
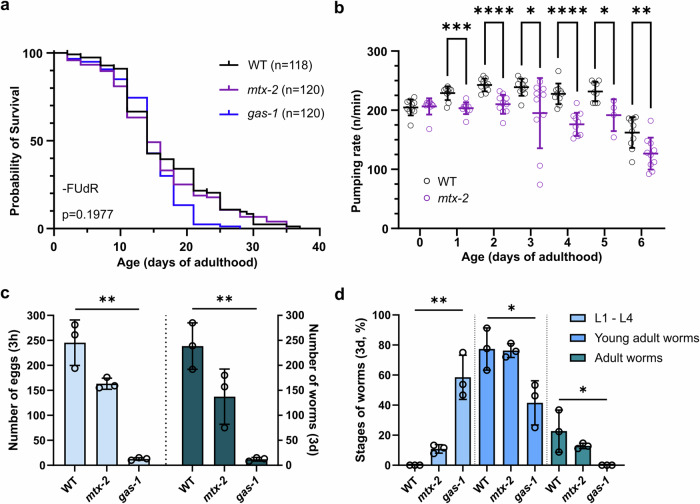
MandibuloAcral Dysplasia associated to MTX2 gene (MADaM) is a recently described progeroid syndrome (accelerated aging disease) whose clinical manifestations include skin abnormalities, growth retardation, and cardiovascular diseases. We previously proposed that mtx-2-deficient C. elegans could be used as a model for MADaM and to support this, we present here our comprehensive phenotypic characterization of these worms using atomic force microscopy (AFM), transcriptomic, and oxygen consumption rate analyses. AFM analysis showed that young mtx-2-less worms had a significantly rougher, less elastic cuticle which becomes significantly rougher and less elastic as they age, and abnormal mitochondrial morphology. mtx-2 C. elegans displayed slightly delayed development, decreased pharyngeal pumping, significantly reduced mitochondrial respiratory capacities, and transcriptomic analysis identified perturbations in the aging, TOR, and WNT-signaling pathways. The phenotypic characteristics of mtx-2 worms shown here are analogous to many of the human clinical presentations of MADaM and we believe this validates their use as a model which will allow us to uncover the molecular details of the disease and develop new therapeutics and treatments.


Conflict of interest statement

The authors declare no competing interests.

Figures

Fig. 1
Fig. 1. Characterization of morphology and mechanical properties of individual mitochondria by AFM.
From left to right: representative 2D topography image of the mitochondrial surface (scale bar 500 nm), height profile performed along the red line of the 2D topography image, and corresponding 3D topography image for L4 stage a WT, b mtx-2, and c gas-1 worms. Scatter plots (mean ± SD) of (from left to right) length, width, height, aspect ratio, and elastic modulus (E) of mitochondria extracted from d the 3 worm strains at L4 stage (length, width, height, and aspect ratio: WT n = 22, mtx-2 n = 19, gas-1 n = 20; Elastic modulus: WT n = 16, mtx-2 n = 20, gas-1 n = 18) and e WT worms at L4 stage, D2, and D8 of adulthood (length, width, height, and aspect ratio: D2 n = 22, D8 n = 24; Elastic modulus: D2 n = 21, D8 n = 17). Statistically significant differences are shown (*p < 0.05, **p < 0.01, ***p < 0.001, ****p < 0.0001).
Fig. 2
Fig. 2. Oxygen consumption rate (OCR) of whole worms.
a Representative OCR kinetic graph of a single experiment using the 3 worm strains (WT n = 15, mtx-2 n = 15, gas-1 n = 14). The basal, maximal, non-mitochondrial, and spare respiration areas are indicated on the graph for the WT strain. b Bar charts (mean ± SD) of basal respiration (left), maximal respiration (middle), and spare respiration (right) of three independent experiments (n = 6 measurements). Statistically significant differences are shown (*p < 0.05, **p < 0.01). FCPP: carbonyl cyanide-p-trifluoromethoxyphenylhydrazone.
Fig. 3
Fig. 3. Differentially expressed genes (DEGs) in mtx-2 worms.
a Heatmap of DEGs (n = 323) with p value adj < 0.05 and a ≥ ± 2-fold change in expression. b Volcano plot of DEGs (n = 323). The 10 most statistically significant DEGs and the 2 DEGs further tested by RT-qPCR are indicated on the plot. c WormCat categorisation of final upregulated DEGs (n = 315): Category 1 (physiological function), Category 2 (molecular function), Category 3 (cellular location). Circle size indicates number of genes, color indicates p value.
Fig. 4
Fig. 4. Characterization of cuticle structure and mechanical properties of worms at D2 of adulthood by AFM.
From left to right: representative 2D topography image of a scanned tile of the cuticle surface (scale bar 2 μm), height profile performed along the red line of the 2D topography image, and corresponding 3D topography image for a WT, b mtx-2, and c gas-1 worms. d Scatter plots (mean ± SD) of roughness (Ra, left) and elastic modulus (E, right) of the 3 worm strains. The E values for mtx-2 worms identified as outliers, but not excluded from the analysis, are highlighted (Ra: WT n = 21, mtx-2 n = 21, gas-1 n = 19; E: WT n = 16, mtx-2 n = 20, gas-1 n = 20). Statistically significant differences are shown (*p < 0.05, ****p < 0.0001).
Fig. 5
Fig. 5. Characterization of cuticle structure and mechanical properties of worms at D8 of adulthood by AFM and comparison with worms at D2 of adulthood.
From left to right: representative 2D topography image of a scanned tile of the cuticle surface (scale bar 2 μm), height profile performed along the red line of the 2D topography image, and corresponding 3D topography image for a WT, b mtx-2, and c gas-1 worms. d Scatter plots (mean ± SD) of roughness (Ra, left) and elastic modulus (E, right) of the 3 worm strains at D8 and their comparison with D2 data. The plain lines show the comparison between the 3 worm strains at D8 and the dashed lines the comparison between D2 and D8 of adulthood for the same strain (D8 Ra: WT n = 16, mtx-2 n = 21, gas-1 n = 20; E: WT n = 16, mtx-2 n = 18, gas-1 n = 20). Statistically significant differences are shown (**p < 0.01, ***p < 0.001, ****p < 0.0001).
Fig. 6
Fig. 6. Morphological analysis of WT, mtx-2, and gas-1 worms.
a Representative SEM images of fixed L4 stage worms. Examples of annuli (A) and furrows (F) of the cuticle are indicated on the SEM image of a WT worm by white arrows (scale bars 1 μm). b Scatter plots (mean ± SD) of body length (left) and width (right) at D1 of adulthood (n = 40). Statistically significant differences are shown (**p < 0.01, ***p < 0.001, ****p < 0.0001).
Fig. 7
Fig. 7. Phenotypic characterization and comparison of worm strains.
a Lifespan; Kaplan-Meier survival curves (without FUdR). b Pharyngeal pumping (PP) in WT and mtx-2 strains (n = 10 except for D5 WT n = 9 and mtx-2 n = 4). c Reproductive capacity of a total of 45 individual gravid worms per strain assessed by; number of eggs laid during 3 h (left axis) and number of worms after incubating those eggs for 3 days (right axis). d Developmental assay showing the percentages of worms at different stages on D1 of adulthood of WT worms. For b, c, and d, data are represented as mean ± SD. For c and d, n = 3 independent experiments. Statistically significant differences between different worm types are shown (*p < 0.05, **p < 0.01, ***p < 0.001, ****p < 0.0001). YA: young adult.

References

    1. Lamis, A. et al. Hutchinson-Gilford progeria syndrome: a literature review. Cureus14, e28629 (2022). - PMC - PubMed
    1. Puente, X. S. et al. Exome sequencing and functional analysis identifies BANF1 mutation as the cause of a hereditary progeroid syndrome. Am J Hum Genet88, 650–656 (2011). - PMC - PubMed
    1. David, A. et al. Werner syndrome: Clinical features, pathogenesis and potential therapeutic interventions. Ageing Res Rev33, 373–378 (2017). - PMC - PubMed
    1. Gordon, L. B. et al. Association of lonafarnib treatment vs no treatment with mortality rate in patients with Hutchinson-Gilford progeria syndrome. JAMA319, 1687–1695 (2018). - PMC - PubMed
    1. Elouej, S. et al. Loss of MTX2 causes mandibuloacral dysplasia and links mitochondrial dysfunction to altered nuclear morphology. Nat Commun11, 4589 (2020). - PMC - PubMed

Publication types

MeSH terms

Substances