

Regulating the metabolic flux of pyruvate dehydrogenase bypass to enhance lipid production in Saccharomyces cerevisiae
- PMID: 39462103
- PMCID: PMC11513081
- DOI: 10.1038/s42003-024-07103-7
Regulating the metabolic flux of pyruvate dehydrogenase bypass to enhance lipid production in Saccharomyces cerevisiae
Abstract
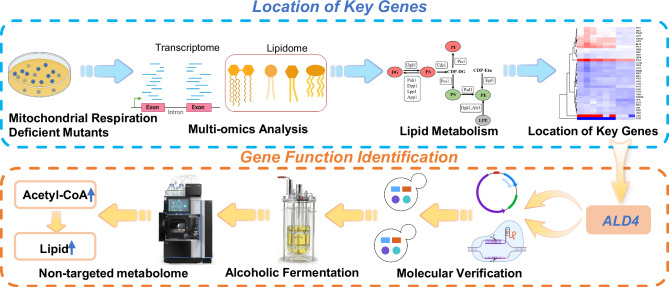
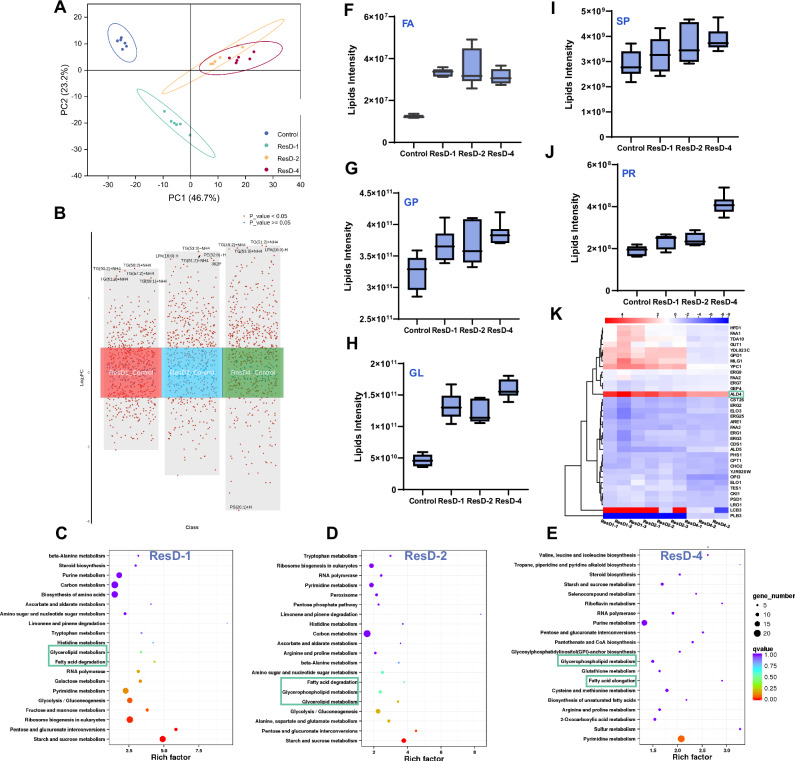
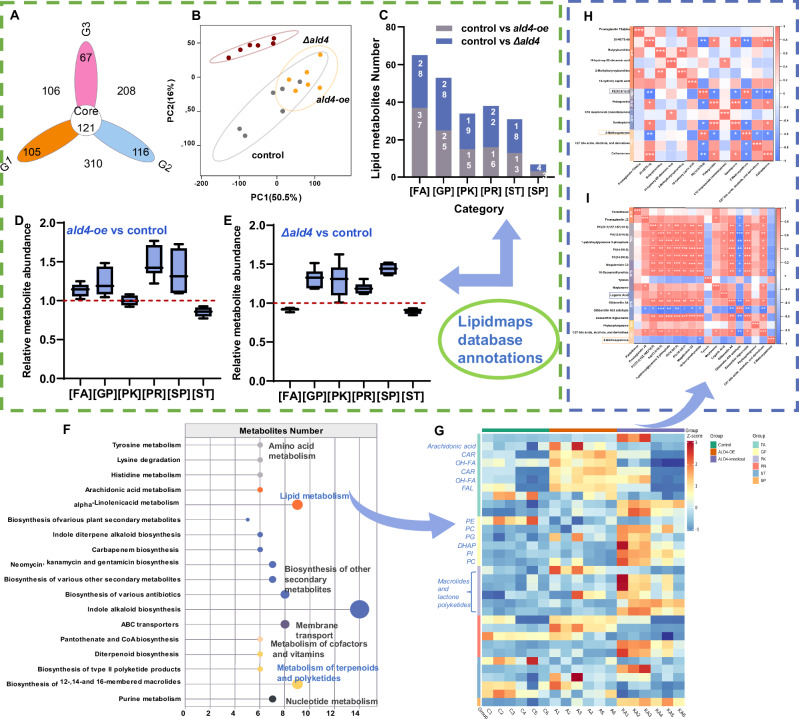
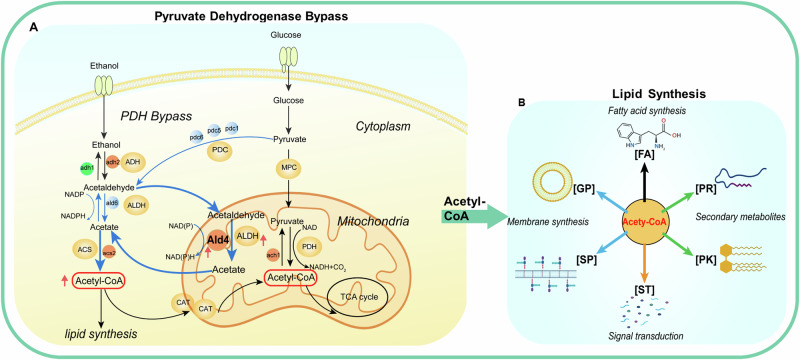
To achieve high efficiency in microbial cell factories, it is crucial to redesign central carbon fluxes to ensure an adequate supply of precursors for producing high-value compounds. In this study, we employed a multi-omics approach to rearrange the central carbon flux of the pyruvate dehydrogenase (PDH) bypass, thereby enhancing the supply of intermediate precursors, specifically acetyl-CoA. This enhancement aimed to improve the biosynthesis of acetyl-CoA-derived compounds, such as terpenoids and fatty acid-derived molecules, in Saccharomyces cerevisiae. Through transcriptomic and lipidomic analyses, we identified ALD4 as a key regulatory gene influencing lipid metabolism. Genetic validation demonstrated that overexpression of the mitochondrial acetaldehyde dehydrogenase (ALDH) gene ALD4 resulted in a 20.1% increase in lipid production. This study provides theoretical support for optimising the performance of S. cerevisiae as a "cell factory" for the production of commercial compounds.
© 2024. The Author(s).
Conflict of interest statement
The authors declare no competing interests.
Figures


Similar articles
-
Primary and Secondary Metabolic Effects of a Key Gene Deletion (ΔYPL062W) in Metabolically Engineered Terpenoid-Producing Saccharomyces cerevisiae.Appl Environ Microbiol. 2019 Mar 22;85(7):e01990-18. doi: 10.1128/AEM.01990-18. Print 2019 Apr 1. Appl Environ Microbiol. 2019. PMID: 30683746 Free PMC article.
-
Metabolic pathway engineering for fatty acid ethyl ester production in Saccharomyces cerevisiae using stable chromosomal integration.J Ind Microbiol Biotechnol. 2015 Mar;42(3):477-86. doi: 10.1007/s10295-014-1540-2. Epub 2014 Nov 25. J Ind Microbiol Biotechnol. 2015. PMID: 25422103
-
Engineering acetyl coenzyme A supply: functional expression of a bacterial pyruvate dehydrogenase complex in the cytosol of Saccharomyces cerevisiae.mBio. 2014 Oct 21;5(5):e01696-14. doi: 10.1128/mBio.01696-14. mBio. 2014. PMID: 25336454 Free PMC article.
-
Engineering cytosolic acetyl-coenzyme A supply in Saccharomyces cerevisiae: Pathway stoichiometry, free-energy conservation and redox-cofactor balancing.Metab Eng. 2016 Jul;36:99-115. doi: 10.1016/j.ymben.2016.03.006. Epub 2016 Mar 23. Metab Eng. 2016. PMID: 27016336 Review.
-
Advances in metabolic engineering for enhanced acetyl-CoA availability in yeast.Crit Rev Biotechnol. 2025 Jun;45(4):904-922. doi: 10.1080/07388551.2024.2399542. Epub 2024 Sep 12. Crit Rev Biotechnol. 2025. PMID: 39266266 Review.
Cited by
-
Identification of key transcription factors, including DAL80 and CRZ1, involved in heat and ethanol tolerance in Saccharomyces cerevisiae.Biotechnol Biofuels Bioprod. 2025 May 3;18(1):50. doi: 10.1186/s13068-025-02653-2. Biotechnol Biofuels Bioprod. 2025. PMID: 40319324 Free PMC article.
References
-
- Ko, Y. S. et al. Tools and strategies of systems metabolic engineering for the development of microbial cell factories for chemical production. Chem. Soc. Rev.49, 4615–4636 (2020). - PubMed
-
- Su, B. et al. Engineering a balanced acetyl coenzyme a metabolism in Saccharomyces cerevisiae for lycopene production through rational and evolutionary engineering. J. Agric. Food Chem.70, 4019–4029 (2022). - PubMed
-
- Yuan, J. F. & Ching, C. B. Mitochondrial acetyl-CoA utilization pathway for terpenoid productions. Metab. Eng.38, 303–309 (2016). - PubMed
-
- Chen, Y., Daviet, L., Schalk, M., Siewers, V. & Nielsen, J. Establishing a platform cell factory through engineering of yeast acetyl-CoA metabolism. Metab. Eng.15, 48–54 (2013). - PubMed
-
- Lin, P. et al. Direct utilization of peroxisomal acetyl-CoA for the synthesis of polyketide compounds in Saccharomyces cerevisiae. ACS Synth. Biol.12, 1599–1607 (2023). - PubMed
MeSH terms
Substances
Grants and funding
LinkOut - more resources
Full Text Sources
