. 2024 Oct 26;15(1):9258.
doi: 10.1038/s41467-024-53469-x.

Reentrant DNA shells tune polyphosphate condensate size

Affiliations

Reentrant DNA shells tune polyphosphate condensate size

Ravi Chawla et al. Nat Commun. .

Abstract

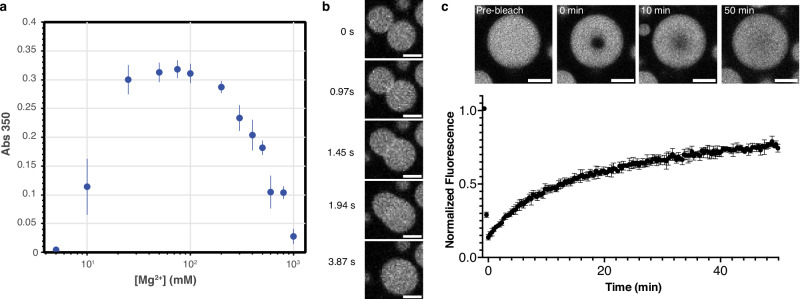
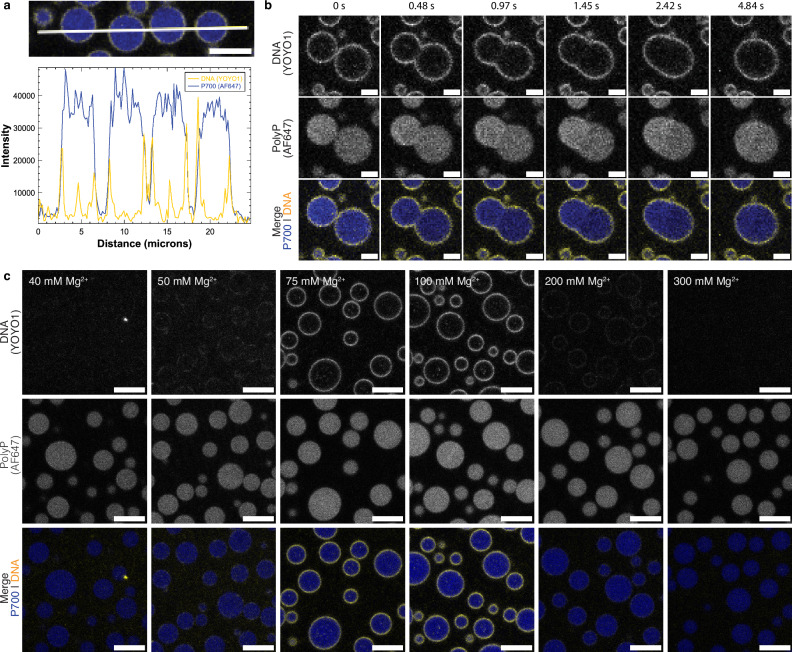
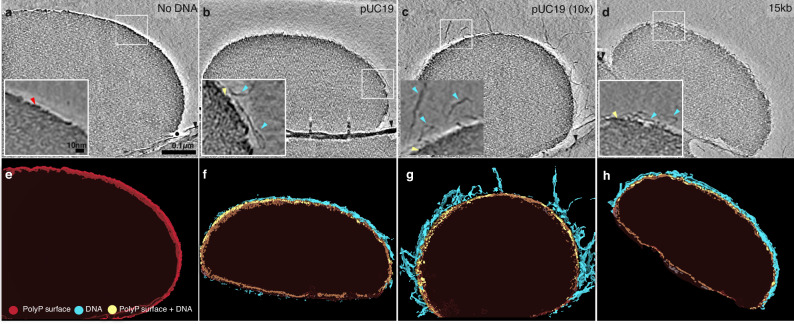
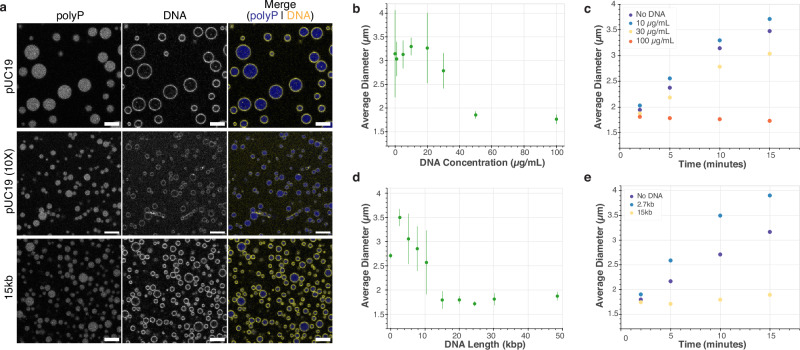
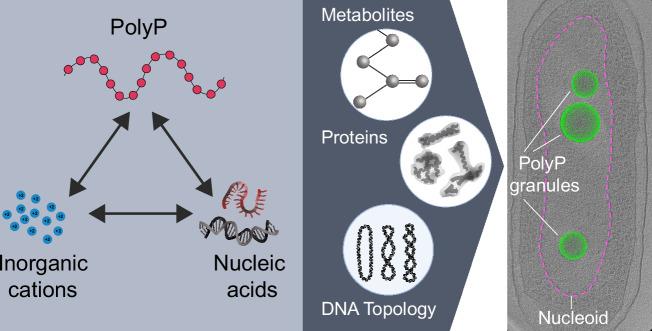
The inorganic biopolymer polyphosphate (polyP) occurs in all domains of life and affects myriad cellular processes. A longstanding observation is polyP's frequent proximity to chromatin, and, in many bacteria, its occurrence as magnesium (Mg2+)-enriched condensates embedded in the nucleoid region, particularly in response to stress. The physical basis of the interaction between polyP, DNA and Mg2+, and the resulting effects on the organization of the nucleoid and polyP condensates, remain poorly understood. Here, using a minimal system of polyP, Mg2+, and DNA, we find that DNA can form shells around polyP-Mg2+ condensates. These shells show reentrant behavior, that is, they form within a window of Mg2+ concentrations, representing a tunable architecture with potential relevance in other multicomponent condensates. This surface association tunes condensate size and DNA morphology in a manner dependent on DNA length and concentration, even at DNA concentrations orders of magnitude lower than found in the cell. Our work also highlights the remarkable capacity of two primordial inorganic species to organize DNA.


Conflict of interest statement

The authors declare no competing interests.

Figures

Fig. 1
Fig. 1. PolyP-Mg2+ coacervates exhibit reentrant phase transition and are dynamic.
a Phase boundary curve for polyP-Mg2+ coacervates as determined by the solution turbidity ([polyP] = 1 mg/mL, 50 mM HEPES-NaOH, pH 7.5). Individual points represent the mean of three replicates, while error bars represent the standard deviation. b Representative confocal fluorescence microscopy images of polyP-Mg2+ mixtures that correspond to 100 mM MgCl2 of the phase diagram 8 min after droplet induction. Images represent fusion of polyP-Mg2+ coacervates ([polyP] = 1 mg/mL, polyP-AF647 = 10% polyP, [Mg2+] = 100 mM, 50 mM HEPES-NaOH, pH 7.5; scale bar = 2 µm). A movie showing a larger field of view of droplet fusion is available (Supplementary Movie 1). c PolyP-Mg2+ coacervates reached around 75% recovery within 50 min in Fluorescence Recovery After Photobleaching (FRAP) experiments (dbleached ROI = 1.7 µm, ddroplets = 8.4–8.5 µm, n = 4). Points represent the time-binned averages of four independent runs and error bars represent the SD. Representative images from a single run showing recovery at select time points are inset (scale bar = 5 µm).
Fig. 2
Fig. 2. DNA interacts with the surface of polyP-Mg2+ coacervates and forms shells that exhibit reentrant behavior.
a Intensity profiles across polyP-Mg2+-DNA coacervate confocal image showing the surface localization of DNA [P700] = 1 mg/mL, P700-AF647 = 10% of the total polyP, 50 mM HEPES-NaOH, pH 7.5; scale bar = 5 µm; P700, blue; DNA (YOYO-1, 1 µM, yellow). b Confocal fluorescence microscopy images at different time points of polyP-Mg2+-DNA coacervate fusion (for conditions described in (a), scale bar = 2 µm). See Supplementary Fig. 2c for the full frame fusion and Supplementary Movie 3 for a wider field-of-view video. c Confocal fluorescence microscopy of polyP-Mg2+ coacervates and pUC19 (2.7 kb) plasmid under different MgCl2 conditions. DNA forms a shell on the surface of polyP-Mg2+ coacervates within a Mg2+ concentration range of 50–200 mM. For each Mg2+ concentration, N = 1. Three channels corresponding to Alexa Fluor 647 (P700), YOYO-1 (DNA), and the merge of these two channels are shown (10–12 min, scale bar = 5 μm).
Fig. 3
Fig. 3. Cryo-electron tomography shows topologies of different types of DNA on polyP condensates.
ad Representative tomographic slices of polyP condensates incubated with different types of DNA. Red arrow highlights the dense edge of polyP, cyan arrows highlight DNA, yellow arrows highlight the dense edge+DNA surface, and the black arrow highlights the carbon hole (scale bar = 100 nm, inset scale bar = 10 nm). Representative slices were selected from multiple droplets and tomograms from a single experimental run (see “Methods” section for details). The phenotypes shown are consistently observed in multiple tomograms and droplets (see Supplementary Fig. 6 for additional examples). The entire dataset is deposited on EMDB under the following accession ID: EMPIAR-11701 (eh) 3-dimensional renderings of tomograms shown in (ad), respectively. The dense edge of polyP condensate is shown in red, the dense edge+DNA is shown in yellow, and DNAs are shown in cyan.
Fig. 4
Fig. 4. Effect of DNA concentration and length on polyP-Mg2+ size distribution and average droplet size.
a Representative confocal images of polyP-Mg2+ droplets given different DNA concentration (top & middle) and length (top & bottom) ([polyP] = 1 mg/mL with ~10% P700-AF647, [DNA] = 10 µg/mL or 100 µg/mL, [YOYO-1] = 1 µM, 50 mM HEPES, scale bar = 5 µm, n = 1). These representative images are selected from an expanded set of concentrations and lengths, which are available in Supplementary Figs 13, 14, 18, and 19. b Scatter plot showing the average of mean droplet size across three experiments with respect to varied DNA concentrations (error bars = SD of mean diameters of each experiment) ([polyP] = 1 mg/mL with ~10% P700-AF647, [DNA] = as shown, 50 mM HEPES, n = 3). c Scatter plot showing average droplet size as a function of time for three representative DNA concentrations (n = 3). d Scatter plot showing the average of mean droplet size across three experiments with respect to different DNA lengths (error bars = SD of mean diameters of each experiment). ([polyP] = 1 mg/mL with ~10% P700-AF647, [DNA] = 10 µg/mL, [YOYO-1] = 1 µM, 50 mM HEPES, n = 3) e Scatter plot showing average droplet size as a function of time for three representative DNA lengths (n = 3).
Fig. 5
Fig. 5. A potential framework for polyP-chromatin interactions.
In this study, we have developed a three-component polyP-Mg2+-DNA system (interactions represented by black arrows) which is a fundamental physicochemical interaction unit underlying the functional coupling between polyP granules and chromatin in cells. Our results highlight the tunable nature of a polyP-Mg2+-DNA system, showing that in vitro DNA interacts with and forms reentrant shells around polyP-Mg2+ condensates in the absence of DNA protein binding partners and modulates condensate size in a DNA-length- and concentration-dependent manner. Future in vitro and in vivo studies building on this framework to include cationic organic metabolites, relevant proteins, such as DNA binding proteins known to associate with polyP (Hfq and AlgP, for example), and DNA topology, are needed to understand how polyP granules affect chromatin structure and function in cells (gray arrow). Right: Cryo-ET of nitrogen-starved P. aeruginosa cells with nucleoid region (ribosome depleted) delineated with dashed magenta line, polyphosphate granules shown as green spheres (image: Fig. 5 adapted from Racki et al.).

Update of

References

    1. Rao, N. N., Gómez-García, M. R. & Kornberg, A. Inorganic polyphosphate: essential for growth and survival. Annu. Rev. Biochem.78, 605–647 (2009). - PubMed
    1. Gray, M. J. & Jakob, U. Oxidative stress protection by polyphosphate-new roles for an old player. Curr. Opin. Microbiol.24, 1–6 (2015). - PMC - PubMed
    1. Bowlin, M. Q. & Gray, M. J. Inorganic polyphosphate in host and microbe biology. Trends Microbiol.29, 1013–1023 (2021). - PMC - PubMed
    1. Denoncourt, A. & Downey, M. Model systems for studying polyphosphate biology: a focus on microorganisms. Curr. Genet.67, 331–346 (2021). - PubMed
    1. Baker, C. J., Smith, S. A. & Morrissey, J. H. Polyphosphate in thrombosis, hemostasis, and inflammation. Res Pract. Thromb. Haemost.3, 18–25 (2018). - PMC - PubMed

Publication types

LinkOut - more resources