Analysis of the role of perfusion parameters in predicting rupture of brain arteriovenous malformations: a multi-center study
- PMID: 39462139
- PMCID: PMC11513006
- DOI: 10.1038/s41598-024-77316-7
Analysis of the role of perfusion parameters in predicting rupture of brain arteriovenous malformations: a multi-center study
Abstract
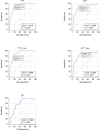
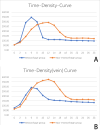
This study aimed to investigate the potential correlation between the perfusion parameters of brain arteriovenous malformations (bAVMs) as determined by multiphase CT angiography and bAVM rupture. Based on the occurrence of bAVM-related hemorrhage, 480 diagnosed bAVM patients were divided into hemorrhage (n = 220) and non-hemorrhage (n = 260) groups in this retrospective multi-center study spanning 2010 to 2020. On initial rupture CT images, the bAVM nidus and major draining vein were segmented, and time-density curves were extracted to compute perfusion parameters including mean transit time (MTT), time to peak (TTP), blood volume (BV), and blood flow (BF). To examine the potential correlation between these parameters and bAVM rupture, logistic regression was utilized to analyze multifactorial data and compare differences between the two groups. The ruptured group demonstrated a bAVM nidus characterized by an increased BF, a shorter TTP and MTT, and a higher peak density. The veins that were draining exhibited a reduced TTP, MTT, and peak density. A nidus TTP of less than 4s was identified by the multifactorial analysis as a critical risk factor for bAVM rupture. The statistical results highlight the noteworthy correlation between nidus TTP and bAVM rupture, presenting an original framework for assessing the risk of rupture.
Keywords: Brain arteriovenous malformations; CT perfusion; Cerebrovascular circulation; Computed tomography angiography; Intracranial hemorrhages.
© 2024. The Author(s).
Conflict of interest statement
The authors declare no competing interests.
Figures


References
-
- Lawton, M. T. et al. Brain arteriovenous malformations. Nat. Rev. Dis. Primers. 1, 15008. 10.1038/nrdp.2015.8 (2015). - PubMed
-
- Hernesniemi, J. A. et al. Natural history of brain arteriovenous malformations: a long-term follow-up study of risk of hemorrhage in 238 patients. Neurosurgery. 63, 823–829. 10.1227/01.NEU.0000330401.82582.5E (2008). discussion 829–831. - PubMed
-
- Kim, H. et al. Racial/Ethnic differences in longitudinal risk of intracranial hemorrhage in brain arteriovenous malformation patients. Stroke. 38, 2430–2437. 10.1161/STROKEAHA.107.485573 (2007). - PubMed
Publication types
MeSH terms
Grants and funding
LinkOut - more resources
Full Text Sources
Miscellaneous

