Multicenter Study
. 2024 Oct 26;23(1):379.
doi: 10.1186/s12933-024-02468-9.

Monocytes perturbation implicated in the association of stress hyperglycemia with postoperative poor prognosis in non-diabetic patients with Stanford type-A acute aortic dissection

Affiliations
Multicenter Study

Monocytes perturbation implicated in the association of stress hyperglycemia with postoperative poor prognosis in non-diabetic patients with Stanford type-A acute aortic dissection

Shuai Zhao et al. Cardiovasc Diabetol. .

Abstract

Objectives: The study aimed to investigate the interaction of intraoperative stress hyperglycemia with monocyte functions and their impact on major adverse events (MAEs) in acute aortic dissection (AAD) patients who underwent open repair surgery.

Methods: A total of 321 adults who underwent open surgery for AAD at two tertiary medical centers in China were enrolled in the study. The primary endpoint was defined as the incidence and characteristics of perioperative stress hyperglycemia. The secondary endpoints included the incidence of postoperative MAEs, postoperative monocyte counts and inflammatory cytokine expression. Multi-logistic, linear regression and receiver operating characteristic (ROC) curve analyses were used to establish relationships between intraoperative time-weighted average glucose (TWAG), day-one postoperative monocyte counts, serum inflammatory cytokines and postoperative outcomes. In addition, in vitro experiments were conducted to evaluate changes in the inflammatory features of monocytes under high glucose conditions.

Results: Intraoperative hyperglycemia, as indicated by a TWAG level over 142 mg/dL, was associated with elevated postoperative monocyte counts and inflammatory cytokines, which correlated with extended intensive care unit (ICU) stays and worsened outcomes. In vitro, high glucose treatment induced mitochondrial impairment in monocytes, increased the release of inflammatory cytokines and the proportion of classical monocytes from AAD patients.

Conclusions: Intraoperative stress hyperglycemia, in combination with day-one postoperative monocyte counts, were clinically significant for predicting adverse outcomes in AAD patients undergoing open repair surgery. Elevated glucose concentrations shaped the inflammatory features of monocytes in AAD by impairing mitochondrial functions.

Keywords: Acute aortic dissection; Inflammation; Mitochondria; Monocyte; Stress-Induced hyperglycemia.


Conflict of interest statement

The authors declare no competing interests.

Figures

Fig. 1
Fig. 1
Intraoperative Stress Hyperglycemia Predicts Postoperative MAEs in AAD. A ROC curves illustrating the AUC and 95% CI for various predictors of postoperative MAEs. B Multivariate logistic regression analysis depicting the adjusted OR and 95% CI for MAEs predictors. C–E Patients were categorized into an intraoperative hyperglycemia group (TWAG > 142 mg/dL) and a non-hyperglycemia group (TWAG ≤ 142 mg/dL) for analyses comparing infections, cerebral injuries, and ICU stay durations. Chi-square tests (C and D) and unpaired t-tests (E) were utilized. All depicted correlations reached statistical significance, with *P < 0.05; **P < 0.01. Abbreviations: ACCT, aortic cross-clamp time; AUC, area under the curve; CPB, cardiopulmonary bypass time; CI, confidence interval; HCA, hypothermic circulatory arrest; ICU; intensive care unit; MAEs, major adverse events; OT, operation time; OR, odds ratio; ROC, receiver operating characteristic; TWAG, time-weighted average glucose; BG, blood glucose
Fig. 2
Fig. 2
Correlation between Intraoperative TWAG and Postoperative Monocyte Counts, and Their Prediction of MAEs in AAD Patients. A–C Linear regression analysis assessed relationships between intraoperative Max BG, Mean BG, and TAWG with postoperative day 1 monocyte counts, and their mean and max values within the first 3 postoperative days. D Patients were categorized based on whether their intraoperative TAWG was > 142 mg/dL, to compare monocyte counts (Monocyte day1, Monocyte mean, and Monocyte Max) between these groups. E The ROC curve demonstrates the diagnostic performance of combining intraoperative TWAG and postoperative day 1 monocyte counts to predict MAEs. The AUC is 0.75 with a 95% CI of 0.69–0.80. Max or mean refers to the highest or average monocyte counts within the first three postoperative days. Data are presented as the mean ± SEM. Student’s t-test was utilized for statistical analysis (D). *P < 0.05; **P < 0.01; ***P < 0.001; ****P < 0.0001. Abbreviations: AUC, area under the curve; BG, blood glucose; MAEs, major adverse events; TWAG, time-weighted average glucose
Fig. 3
Fig. 3
Associations between Monocyte Counts, Inflammatory Cytokines and Poor Prognosis in AAD Patients Experiencing Intraoperative Hyperglycemia. Serum samples were obtained from HDs and AAD patients one day after surgery for ELISA tests. A ELISA measured IL-1β, IL-6 and TNF-α cytokines in serum from both HDs and AAD patients pre- and post-surgery day 1. B Concentrations of IL-1β/IL-6 in serum were compared between MAEs or non-MAEs. C Linear regression analyzed the link between IL-1β levels and ICU stay length. D–E Linear regression analyzed the link between monocyte counts postoperative day 1 and IL-1β/IL-6 levels. F The serum level of IL-1β/IL-6 were compared between intraoperative hyperglycemia and non-hyperglycemia. Data are presented as mean ± SEM. Unpaired Student’s t-test was used (A, B, and F). TWAG, time-weighted average glucose. Statistical significance was denoted as *P < 0.05; **P < 0.01; ***P < 0.001; ****P < 0.0001. Abbreviations: AAD, acute aortic dissection; AAD, Stanford type-A acute aortic dissection; HDs, healthy donors; ICU, intensive care unit; MAEs, major adverse events
Fig. 4
Fig. 4
Transcriptomic Landscape and Subpopulations and Inflammatory Cytokines of CD14+ Monocytes in Response to High Glucose. PBMCs (F) and CD14+ monocytes (AE, G) from AAD and HDs were cultured in their serum, with the experimental group exposed to 30 mM glucose for 24 h. A Bar chart illustrates the differentially expressed genes in response to the high-glucose environment, with red bars indicating upregulated genes and blue bars indicating downregulated genes. B A volcano plot that highlights the significantly upregulated genes. C A heatmap which displays the differential gene expression patterns. D–E An enrichment analysis reveals differentially expressed genes within KEGG pathways GSEA. F Flow Cytometry analysis details changes in the proportions of monocyte subtypes. G An ELISA assay measures inflammatory cytokines IL-1β, and IL-6 in cell supernatants. Data are presented as mean ± SEM. A paired Student’s t-test (FG) was performed for statistical analysis. Statistical significance was denoted as **P < 0.01. Abbreviations: AAD, Stanford type-A acute aortic dissection; CM, classic monocytes; GSEA, Gene Set Enrichment Analysis; HDs, healthy donors; IM, intermediate classic monocytes; KEGG, Kyoto Encyclopedia of Genes and Genomes; NCM, non-classic monocytes; PBMCs, peripheral blood mononuclear cells
Fig. 5
Fig. 5
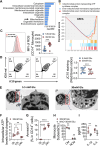
High Glucose-Driven Mitochondrial Functional Impairment Mediating Inflammatory Features. PBMCs (C-D, F) or CD14+ monocytes (A-B, E, G) isolated from AAD patients were cultured in matched AAD serum conditions, and the experimental group was co-cultured with 30 mM glucose for 24 h. A–B Gene enrichment analysis was conducted using GO and GSEA. C–D FCM was utilized to measure the mean fluorescence intensity of ROS, while the analysis of mitochondrial membrane potential was conducted following JC-10 staining. E Transmission electron microscopy was used to evaluate alterations in mitochondrial morphology. F–G The intracellular ATP levels and the proportion of Annexin V+ apoptotic cells were measured in CD14+ monocytes co-cultured in a high-glucose environment at 0 h, 12 h, and 24 h. H FCM analyzed the proportions of monocyte subgroups, including CM and NCM. I ELISA was employed to measure concentrations of IL-1β and IL-6 in cell supernatants. Data are presented as the mean ± SEM. A paired Student’s t-test (CD, F, G) was performed for statistical analysis. Significance levels are indicated as **P < 0.01; ***P < 0.001. Abbreviations: AAD, Stanford type-A acute aortic dissection; CM, classical monocytes; GO, gene ontology; GSEA, Gene Set Enrichment Analysis; NCM, non-classical monocytes; PBMCs, peripheral blood mononuclear cells; ROS, reactive oxygen species. NAC, n-acetylcysteine. FCM, flow cytometry

References

    1. DeMartino RR, Sen I, Huang Y, Bower TC, Oderich GS, Pochettino A, et al. Population-based assessment of the incidence of aortic dissection, intramural hematoma, and penetrating ulcer, and its associated mortality from 1995 to 2015. Circ Cardiovasc Qual Outcomes. 2018;11(8):e004689. - PMC - PubMed
    1. Carrel T, Sundt TM 3rd, von Kodolitsch Y, Czerny M. Acute aortic dissection. Lancet. 2023;401(10378):773–88. - PubMed
    1. Golledge J, Eagle KA. Acute aortic dissection. Lancet. 2008;372(9632):55–66. - PubMed
    1. Trimarchi S, Nienaber CA, Rampoldi V, Myrmel T, Suzuki T, Mehta RH, et al. Contemporary results of surgery in acute type a aortic dissection: the international registry of acute aortic dissection experience. J Thorac Cardiovasc Surg. 2005;129(1):112–22. - PubMed
    1. Knipp BS, Deeb GM, Prager RL, Williams CY, Upchurch GR Jr., Patel HJ. A contemporary analysis of outcomes for operative repair of type A aortic dissection in the United States. Surgery. 2007;142(4):524–8. discussion 8.e1. - PubMed

Publication types

MeSH terms

LinkOut - more resources