. 2025 Mar;31(3):879-889.
doi: 10.1111/odi.15171. Epub 2024 Oct 27.

Salivary Extracellular Vesicles Separation: Analysis of Ultracentrifugation-Based Protocols

Affiliations

Salivary Extracellular Vesicles Separation: Analysis of Ultracentrifugation-Based Protocols

Castillejos-García Itzel et al. Oral Dis. 2025 Mar.

Abstract

Introduction: The clinical potential of extracellular vesicles (EVs) is widely acknowledged, yet the standardization and reproducibility of its separation remain challenging. This study compares three protocols: ultracentrifugation (UC), UC with purification step (UC + PS), and a combined protocol using polymer-based precipitation and UC (PBP + UC).

Methods: Salivary samples were collected from healthy donors. EVs were separated (UC, UC + PS, and PBP + UC) and characterized using transmission electron microscopy, nanoparticle tracking analysis, EV purity, RNA concentration, and Western blotting. miRNA expression was evaluated by quantitative RT-PCR. Statistical analyses comparing groups were performed using ANOVA.

Results: All methods successfully separated CD9+ and CD63+ EVs from saliva. The UC + PS and PBP + UC protocols yielded the highest concentrations of EVs, enriched in < 200 nm vesicles. EV purity and RNA recovery were comparable among all methods. Expression of miR-16, miR-27a, and miR-99a was successfully detected using all methods.

Conclusions: The UC + PS and PBP + UC protocols demonstrate comparable efficiency in separating salivary EVs. However, the combined PBP + UC protocol, with its simplified processing capability, offers a significant advantage, particularly in the initial phase of EV separation. This finding suggests its potential application in clinical settings where time-sensitive simple processing is critical. Further validation is needed to confirm its effectiveness for transcriptomic and proteomic analyses.

Keywords: PEG; extracellular vesicles; miRNAs; saliva; ultracentrifugation.


Conflict of interest statement

The authors declare no conflicts of interest.

Figures
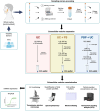
FIGURE 1
FIGURE 1
Workflow of salivary extracellular vesicle separation. Unstimulated whole saliva was collected from five healthy individuals, and preprocessing for EV separation by Ultracentrifugation (UC) (red box), ultracentrifugation + purification step (UC + PS) (yellow box), and polymer‐based precipitation + UC (PBP + UC) (blue box). The EV characterization was performed using transmission electron microscopy (TEM), nanoparticle tracking analysis (NTA), Western blotting (WB), and total protein and RNA quantification. Additionally, an RT‐qPCR was performed to assess miRNA expression.
FIGURE 2
FIGURE 2
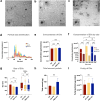
Characterization of salivary EVs by NTA. Representative transmission electron microscopy (TEM) images of EVs separated by UC (a), UC + PS (b), and PBP + UC (c) protocols exhibit characteristic morphology and differing sizes. Magnified morphology (100,000×) of typical EVs can be observed within the small square for each method (a–c). Histogram of separated EVs depicts distinct patterns of particle size distribution and concentration among the three methods, with the broadest EV distribution in UC method (d). NTA analysis demonstrated that UC + PS (yellow) and PBP + UC (blue) protocols yielded higher EV recovery than UC (red) (e). Regarding size, all methods showed greater concentrations of vesicles under 200 nm than those over 200 nm; nonetheless, UC methods exhibited the highest concentration of EVs exceeding 200 nm in comparison to UC + PS and PBP + UC (f). In agreement, UC method (red) separated the largest EVs (mean and median), while PBP + UC yielded the smallest (blue) (g). The total protein amount measured by the BCA assay displays a similar total amount among all methods (h). Similarly, the EV purity (particle number/protein ratio) was comparable across all methods (i). Data are presented as mean ± SEM and median with interquartile intervals (n = 5 per method), ****p < 0.0001, ***p = 0.0004, **p = 0.001, and ns = not significant.
FIGURE 3
FIGURE 3
Western blotting. The expression of CD9 and CD63 markers was confirmed on salivary EVs separated by all protocols and verified with positive control of EVs from the cell line (MDA‐MB‐468). The absence of a calnexin signal was observed in EV samples compared to cell lysate control (a). The relative expression of tetraspanins in relation to GAPDH of EV samples was not significantly different between all methods (b). Data are presented as mean ± SEM (n = 3 per method). All experiments and quantification were conducted in triplicate, ns = not significant.
FIGURE 4
FIGURE 4
Total RNA and miRNA expression in salivary EVs. RNA concentration varied for each EV separation protocol without statistical significance (a). Representative bioanalyzer electropherograms of EVs show the total RNA size distribution and fluorescence intensity (FU). The absence of ribosomal RNA molecules is evident, and the peak observed at short RNA represents the typical RNA pattern of EVs (b–d). This distinctive pattern differentiates EVs from control cell lines (e). The qPCR results show C q values of three miRNAs from EV‐derived preparations obtained by UC (red), UC + PS (yellow), and PBP + UC (blue) (f). Data are presented as mean ± SEM (n = 5 per method), ns = not significant.

References

    1. Akbar, A. , Malekian F., Baghban N., Kodam S. P., and Ullah M.. 2022. “Methodologies to Isolate and Purify Clinical Grade Extracellular Vesicles for Medical Applications.” Cells 11, no. 2: 186. 10.3390/cells11020186. - DOI - PMC - PubMed
    1. Aqrawi, L. A. , Galtung H. K., Vestad B., et al. 2017. “Identification of Potential Saliva and Tear Biomarkers in Primary Sjögren's Syndrome, Utilising the Extraction of Extracellular Vesicles and Proteomics Analysis.” Arthritis Research and Therapy 19, no. 1: 1–15. 10.1186/s13075-017-1228-x. - DOI - PMC - PubMed
    1. Boulestreau, J. , Molina L., Ouedraogo A., et al. 2024. “Salivary Extracellular Vesicles Isolation Methods Impact the Robustness of Downstream Biomarkers Detection.” BioRxiv. 10.1101/2924.01.23.57680. - DOI - PMC - PubMed
    1. Burdiel, M. , Jiménez J., Rodríguez‐Antolín C., et al. 2023. “MiR‐151a: A Robust Endogenous Control for Normalizing Small Extracellular Vesicle Cargo in Human Cancer.” Biomarker Research 11, no. 1: 94. - PMC - PubMed
    1. Chaparro Padilla, A. , Weber Aracena L., Realini Fuentes O., et al. 2020. “Molecular Signatures of Extracellular Vesicles in Oral Fluids of Periodontitis Patients.” Oral Diseases 26, no. 6: 1318–1325. 10.1111/ODI.13338. - DOI - PubMed