. 2024 Oct 28;14(1):25705.
doi: 10.1038/s41598-024-76578-5.

Expression of lipid-metabolism genes is correlated with immune microenvironment and predicts prognosis of hepatocellular carcinoma

Affiliations

Expression of lipid-metabolism genes is correlated with immune microenvironment and predicts prognosis of hepatocellular carcinoma

Liyuan Hao et al. Sci Rep. .

Abstract

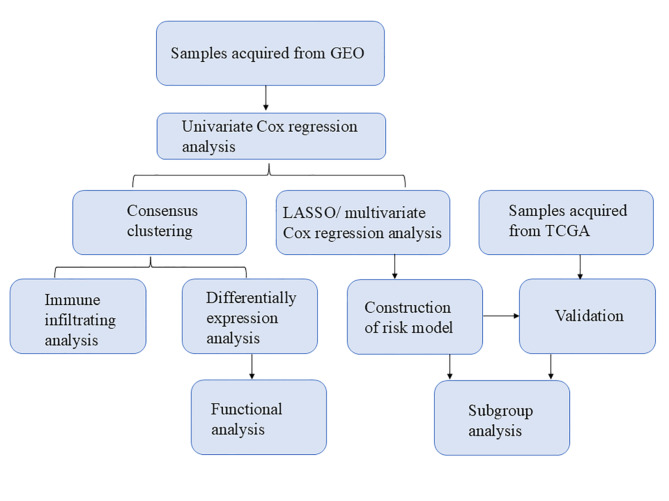
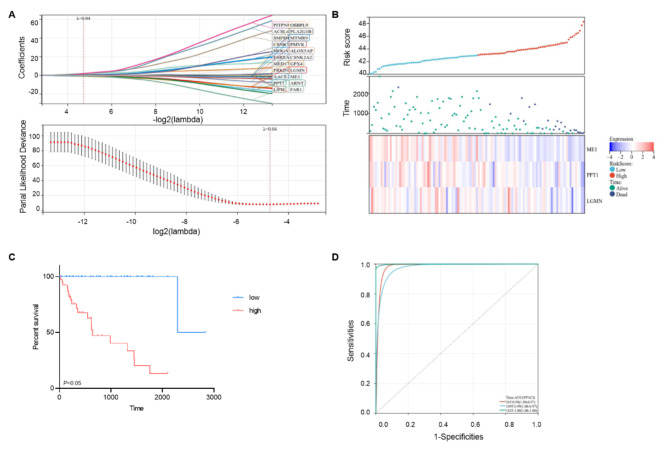
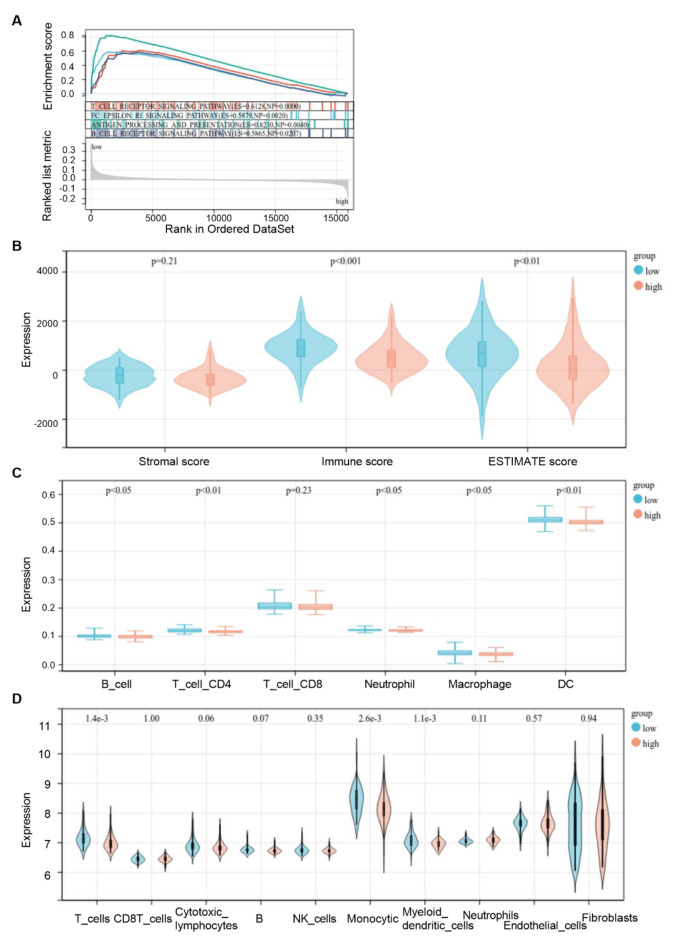
Hepatocellular carcinoma (HCC) is one of the most common malignant tumors. This study was aimed to identify a lipid metabolism-related signature associated with the HCC microenvironment to improve the prognostic prediction of HCC patients. Clinical information and expression profile data were downloaded from The Cancer Genome Atlas (TCGA) and Gene Expression Omnibus (GEO) databases, including the GEO dataset GSE76427. The gene expression profile of lipid metabolism was downloaded from Molecular Signatures Database (MSigDB) database. The infiltrating immune cells were estimated by the Estimation of Stromal and Immune cells in Malignant Tumor tissues using Expression data (ESTIMATE), MCP-counter, and TIMER algorithms. Functional analysis, including Gene ontology (GO) analysis, Kyoto Encyclopedia of Genes and Genomes (KEGG) and Gene set enrichment analysis (GSEA) were performed to elucidate the underlying mechanisms. The prognostic risk model was performed by Least absolute shrinkage and selection operator (LASSO) algorithm and Cox regression analysis. Two distinct subgroups of survival were identified. Better prognosis was associated with high immune score, high abundance of immune infiltrating cells, and high immune status. GO and KEGG analysis showed that differentially expressed genes (DEGs) between the two subgroups were mainly enriched in immune related pathways. GSEA analysis suggested that the expression of lipid metabolism related genes (LMRGs) was related to dysregulation of immune in the high-risk group. Risk models and clinical features based on LMRGs predicted HCC prognosis. This study indicated that the lipid metabolism-related signature was important for the prognosis of HCC. The expression of LMRGs was related to the immune microenvironment of HCC patients and could be used to predict the prognosis of HCC.

Keywords: Hepatocellular carcinoma; LMRGs; Lipid metabolism; Tumor microenvironment.


Conflict of interest statement

The authors declare no competing interests.

Figures

Fig. 1
Fig. 1
The flowchart of this study.
Fig. 2
Fig. 2
Analysis of DEGs. (A) Venn diagrams of DEGs. This panel shows the overlap of DEGs between different comparison groups. Each circle represents a set of DEGs identified from a specific condition or comparison, and the overlapping regions represent DEGs shared between the groups. (B) PPI network construction of DEGs. Nodes represent proteins, and edges represent predicted functional associations between them, providing insights into the interaction patterns among the DEGs. (C) GO function analysis of DEGs. (D) KEGG pathway enrichment analysis of DEGs. This graph is based on information from the KEGG database (www.kegg.jp/kegg/kegg1.html).
Fig. 3
Fig. 3
Construction of risk model in the training cohort. (A) LASSO analysis with minimal lambda. This plot represents the coefficient profiles of the LMRG-based prognostic genes across a range of lambda values. The top panel shows how the gene coefficients shrink as the lambda increases, and the bottom panel shows the partial likelihood deviance. The vertical dashed line indicates the lambda value that minimizes the deviance, representing the optimal model. (B) Distribution of risk score and survival status of HCC patients in the low and high risk groups. The top section displays the distribution of risk scores among the HCC patients, separated into low- (blue) and high-risk (red) groups. The middle section depicts patient survival status (alive = green, dead = black) along the time axis. The bottom heatmap shows the expression levels of three key genes (ME1, PPT1, LGMN) in the low- and high-risk groups. (C) Overall survival curve of the HCC patients in the two groups. Survival curves for the HCC patients in the low-risk (blue) and high-risk (red) groups. (D) Time-dependent ROC curve of the risk model. Time-dependent ROC curves at 1, 3, and 5 years are shown to assess the predictive accuracy of the risk model. The AUC values for each time point indicate high sensitivity and specificity in predicting the prognosis of HCC patients.
Fig. 4
Fig. 4
Immune analyses in the two subgroups. (A) GSEA diagram visualizing GSEA analysis results. The GSEA diagram shows significant enrichment of pathways related to immune signaling, including T cell receptor signaling, B cell receptor signaling, and antigen processing and presentation. These pathways were enriched in the high-risk group compared to the low-risk group. (B) Stromal score, immune score and ESTIMATE score calculated by using ESTIMATE algorithm. (C) The abundance of immune infiltrating cells was evaluated by TIMER algorithm. Box plots show the abundance of various immune cell types, including B cells, CD4+ T cells, CD8+ T cells, neutrophils, macrophages, and dendritic cells. (D) The abundance of immune infiltrating cells was evaluated by MCP Counter algorithm. Violin plots show the expression levels of various immune cells, including CD8+ T cells, cytotoxic lymphocytes, B cells, NK cells, monocytic cells, myeloid dendritic cells, neutrophils, endothelial cells, and fibroblasts.
Fig. 5
Fig. 5
Correlation between risk scores and clinical features in the experimental cohort. (A-C). Risk score distribution in relation to gender, age, and TNM stage: (A) Scatter plot showing that no significant difference (ns) was found between the risk scores of male and female HCC patients. (B) Scatter plot illustrating a significant difference (*) in risk scores between patients younger than 60 years and those aged 60 years or older. (C) Scatter plot demonstrating no significant difference (ns) in risk scores across different TNM stages (I-IV) of HCC. D-I. Survival curves stratified by clinical features: (D, E). Kaplan-Meier survival curves of HCC patients stratified by gender (male and female), comparing low- and high-risk groups. (F, G) Kaplan-Meier survival curves for patients younger than 60 years and those aged 60 years or older, showing the survival probability over time for the low- and high-risk groups. (H, I). Kaplan-Meier survival curves for patients with early-stage (I, II) and late-stage (III, IV) TNM classification, comparing the survival outcomes of low- and high-risk patients.
Fig. 6
Fig. 6
Correlation between risk scores and clinical features in the verification cohort. (A-C) Risk score distribution in relation to gender, age, and TNM stage: (A) Scatter plot showing that no significant difference (ns) was found between the risk scores of male and female HCC patients. (B) Scatter plot illustrating a significant difference (*) in risk scores between patients younger than 60 years and those aged 60 years or older. (C) Scatter plot demonstrating no significant difference (ns) in risk scores across different TNM stages (I-IV) of HCC.No significant difference was identified in patients with different gender (A), age (B), and TNM staging (C). (D-I). Survival curves stratified by clinical features: (D, E) Kaplan-Meier survival curves of HCC patients stratified by gender (male and female), comparing low- and high-risk groups. (F, G). Kaplan-Meier survival curves for patients younger than 60 years and those aged 60 years or older, showing the survival probability over time for the low- and high-risk groups. (H, I). Kaplan-Meier survival curves for patients with early-stage (I, II) and late-stage (III, IV) TNM classification, comparing the survival outcomes of low- and high-risk patients.

References

    1. Bray, F. et al. Global cancer statistics 2018: GLOBOCAN estimates of incidence and mortality worldwide for 36 cancers in 185 countries. CA Cancer J. Clin.68, 394–424 (2018). - PubMed
    1. Belli, C. et al. Targeting the microenvironment in solid tumors. Cancer Treat. Rev.65, 22–32 (2018). - PubMed
    1. Laplane, L., Duluc, D., Bikfalvi, A., Larmonier, N. & Pradeu, T. Beyond the tumour microenvironment. Int. J. Cancer. 145, 2611–2618 (2019). - PMC - PubMed
    1. Cheng, C., Geng, F., Cheng, X. & Guo, D. Lipid metabolism reprogramming and its potential targets in cancer. Cancer Commun.38, 018–0301 (2018). - PMC - PubMed
    1. Cao, Y. Adipocyte and lipid metabolism in cancer drug resistance. J. Clin. Invest.129, 3006–3017 (2019). - PMC - PubMed

MeSH terms

Substances