. 2024 Oct 25;14(46):33987-34004.
doi: 10.1039/d4ra06529h. eCollection 2024 Oct 23.

Four newly synthesized enones induce mitochondrial-mediated apoptosis and G2/M cell cycle arrest in colorectal and cervical cancer cells

Affiliations

Four newly synthesized enones induce mitochondrial-mediated apoptosis and G2/M cell cycle arrest in colorectal and cervical cancer cells

Marija Bulić et al. RSC Adv. .

Abstract

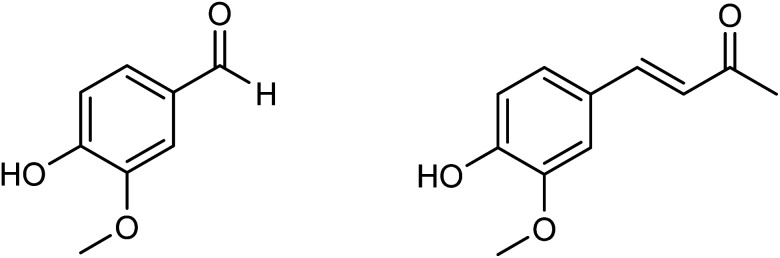
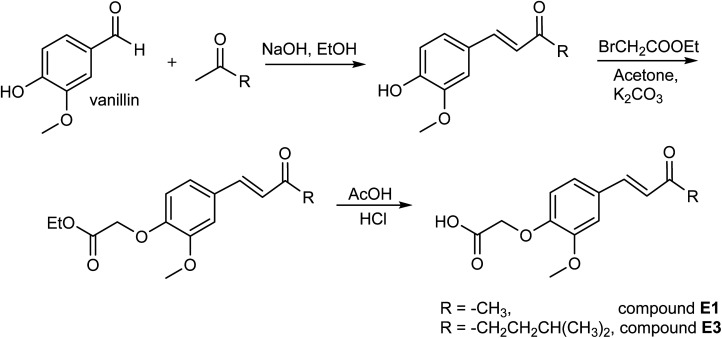
Over the last few decades, we have gained insight into how researchers attempted to modify some natural molecules to be utilized as prospective agents for cancer treatment. Many scientists synthesized new natural compounds by incorporating specific functional groups and metals that improved their antitumor activity while reducing undesirable side effects. In this investigation, we synthesized four novel structurally modified enones that differ in the functional groups attached to the carbonyl group of the enone system (methyl - E1; isopropyl - E2; isobutyl - E3; and cyclopropyl - E4) and explored their anticancer potential against human carcinoma of the colon HCT-116, the cervical HeLa, and normal lung cells MRC-5. From the findings, all the newly synthesized enones exhibited potent cytotoxic activity against the cancer cells while normal cells remained unharmed, with varying potencies among the various enones. We employed the MTT assay to assess enones's (E1-E4) cytotoxic effects, IC50 values and selectivity index in tumor cells. Furthermore, the newly synthesized enones induced cell death in cancer cells through apoptosis by promoting changes in cellular morphology, activating apoptotic regulators Bax and caspase 3, and inhibiting Bcl-2. The enones induced changes in the mitochondrial membrane potential, a release of cytochrome c, and a cell cycle arrest at the G2/M phase, thus inhibiting the growth of cancer cells. In conclusion, we demonstrated the anticancer potential of newly synthesized enones as promising candidates for future cancer treatments, especially for colon cancer, due to their selective cytotoxicity against these cancer cells. Further, in vivo studies are warranted to explore their full therapeutic potential.


Conflict of interest statement

There are no conflicts to declare.

Figures

Fig. 1
Fig. 1. Structures of vanillin and dehydrozingerone.
Fig. 2
Fig. 2. Molecular structural drawings of newly synthesized and further studied enones (E1–E4) with various substituents indicated by red squares.
Scheme 1
Scheme 1. Synthesis of enones E1 and E3.
Scheme 2
Scheme 2. Synthesis of enones E2 and E4.
Fig. 3
Fig. 3. Graphical presentation of cytotoxic effects of enones (E1–E4) applied at different concentrations during the 48 hour towards HeLa, HCT-116, and MRC-5 cells (A–D) and compared to the cytotoxic effect of cisplatin (E). Probability values of (p < 0.05* and p < 0.01**) were considered statistically significant. Points, mean % of cell cytotoxicity based on quintuplicate assays, bars, ± SE of triplicate experiments.
Fig. 4
Fig. 4. Graphical presentation of cytotoxic effects of enones (E1–E4) applied at different concentrations during the 72 hour towards HeLa, HCT-116, and MRC-5 cells (A–D) and compared to the cytotoxic effect of cisplatin (E). Probability values of (p < 0.05* and p < 0.01**) were considered statistically significant. Points, mean % of cell cytotoxicity based on quintuplicate assays, bars, ± SE of triplicate experiments.
Fig. 5
Fig. 5. Morphology of HeLa and HCT-116 cells after 48 and 72 hours of incubation with various doses of enones (E1–E4). Morphology of tumor cells was investigated using phase-contrast microscopy. Enone treatment altered the morphology of cancer cells compared to the control (scale bar 100 μm).
Fig. 6
Fig. 6. The apoptotic effect of enones on HCT-116 and HeLa cells after 48 hours. (A) The percentage of apoptotic HCT-116 and HeLa cells following enones treatment is presented by dot plots. (B) Bar graphs show the percentage of HCT-116 and HeLa cells treated with enones relative to untreated, control cells (La-late apoptotic, Ea-early apoptotic, N-necrotic and Lc-live cells). Bar graphs present percentage of cells (live or dead) vs. IC50 (μM) values of E1–E4 and cisplatin used of readings from triplicate experiments; bars, ± SEM; p < 0.05*, and p < 0.01** vs. the control group (Ctrl).
Fig. 7
Fig. 7. E1–E4 induce upregulation of Bax and downregulation of Bcl-2 in HCT-116 and HeLa cells. Bax/Bcl-2 ratio was measured in HCT-116 and HeLa cells after 48 hours of treatment with different enones (IC50 values) compared to control cells. (A) Flow cytometry histogram analysis of the expression of key apoptotic regulatory proteins (Bcl-2 and active Bax) followed with bar graph for protein expression MFI (fold change) and Bax/Bcl-2 ratio in HCT-116 cells. (B) Flow cytometry histogram analysis of the expression of key apoptotic regulatory proteins (Bcl-2 and active Bax) followed with bar graph for protein expression MFI (fold change) and Bax/Bcl-2 ratio in HeLa cells. Bars represent the mean percentage of cell distributions from three independent experiments: bars, ± standard error (p < 0.05* and p < 0.01** vs. the control group (Ctrl)).
Fig. 8
Fig. 8. E1–E4 induce the activation of caspase 3 in HCT-116 and HeLa cells. (A) Flow cytometry histogram analysis and bar graph of the expression active caspase-3 in HeLa and HCT-116 after enones treatment (E1–E4). (B) Bar graph presentation of MFI of active caspase-3 (fold change) in HCT-116 and HeLa cells. Bars represent the mean percentage of cell distributions from three independent experiments: bars, ± standard error (p < 0.05* and p < 0.01** vs. the control group).
Fig. 9
Fig. 9. Effects of different enones on mitochondrial membrane potential (ΔΨm) in tumor cells shown by mitochondrial fluorescence probe JC-10. Immunofluorescence observations of JC-10 in control compared to enones-treated tumor cells ((A) HCT-116 and (B) HeLa) and their quantitative results (presented as bar graphs) of monomer/aggregate ratio were assumed to be proportional to ΔΨm intensity. Bars represent the mean percentage of cell distributions from three independent experiments: bars, ± standard error (p < 0.05* and p < 0.01** vs. the control group) (scale bar 20 μm).
Fig. 10
Fig. 10. Induction of cytochrome c release from the mitochondria in HCT-116 and HeLa cells following 48 h treatment with examined enones (E1–E4). Immunofluorescence analysis of cytochrome c in the mitochondria is shown in control and enones (E1–E4) treated HCT-116 (A) and HeLa (B) cells. Images were analyzed using ImageJ software and results were presented by bar graphs (scale bar 50 μm). Bar graphs show the mean % of cells with mitochondrial (green diffuse) and cytosol (green punctate) localization of cytochrome c (p < 0.01** compared to the control).
Fig. 11
Fig. 11. Enones induce G2/M cell cycle arrest in HCT-116 and HeLa cells. Enones (E1–E4) caused cell cycle arrest in the G2/M phase in the tumor cells. Tumor cells were treated with IC50 values of each enone for 48 hours, after which the cells were collected, fixed, and stained with PI for FACS analysis. (A) The cell cycle profiles of the enones-treated tumor cells were analyzed by flow cytometry and the percentages of cells distributed across different phases of the cell cycle were calculated using the FlowJo software. (B) These results are presented as histogram bars representing the mean percentage of cell distributions from three independent experiments (bars, ± standard error, p < 0.05* compared to the control group).

References

    1. Liew S. K. Malagobadan S. Arshad N. M. Nagoor N. H. Biomolecules. 2020;10:138. - PMC - PubMed
    1. Younis M. R., Wang C., Younis M. A. and Xia X. H., Nanobiosensors: from Design to Applications, 2020, pp. 171–201
    1. Bondar O. V. Karwt R. Mohammad T. Pavelyev R. S. Pugachev M. V. Ygaiev B. B. Kayumov A. R. Aimaletdinov A. M. Shtyrlin Y. G. Russ. J. Bioorg. Chem. 2023;49:797–814.
    1. Mapoung S. Mapoung S. Suzuki S. Fuji S. Naiki-Ito A. Kato H. Yodkeeree S. Yodkeeree S. Sakorn N. Sakorn N. Ovatlarnporn C. Ovatlarnporn C. Takahashi S. Limtrakul P. Molecules. 2020;25:2737–2751. - PMC - PubMed
    1. Pavelyev R. S. Bondar O. V. Nguyen T. N. T. Ziganshina A. A. Al Farroukh M. Karwt R. Alekbaeva G. D. Pugachev M. V. Yamaleeva Z. R. Kataeva O. N. Balakin K. V. Shtyrlin Y. G. Bioorg. Med. Chem. 2018;26:5824–5837. - PubMed

LinkOut - more resources