. 2024 Oct 2;10(10):1933-1944.
doi: 10.1021/acscentsci.4c00616. eCollection 2024 Oct 23.

Gentle Rhodamines for Live-Cell Fluorescence Microscopy

Affiliations

Gentle Rhodamines for Live-Cell Fluorescence Microscopy

Tianyan Liu et al. ACS Cent Sci. .

Abstract

Rhodamines have been continuously optimized in brightness, biocompatibility, and color to fulfill the demands of modern bioimaging. However, the problem of phototoxicity caused by the excited fluorophore under long-term illumination has been largely neglected, hampering their use in time-lapse imaging. Here we introduce cyclooctatetraene (COT) conjugated rhodamines that span the visible spectrum and exhibit significantly reduced phototoxicity. We identified a general strategy for the generation of Gentle Rhodamines, which preserved their outstanding spectroscopic properties and cell permeability while showing an efficient reduction of singlet-oxygen formation and diminished cellular photodamage. Paradoxically, their photobleaching kinetics do not go hand in hand with reduced phototoxicity. By combining COT-conjugated spirocyclization motifs with targeting moieties, these Gentle Rhodamines compose a toolkit for time-lapse imaging of mitochondria, DNA, and actin, and synergize with covalent and exchangeable HaloTag labeling of cellular proteins with less photodamage than their commonly used precursors. Taken together, the Gentle Rhodamines generally offer alleviated phototoxicity and allow advanced video recording applications, including voltage imaging.


Conflict of interest statement

The authors declare the following competing financial interest(s): K.J. and L.W. are inventors of the patent Cell-permeable fluorogenic fluorophores which was filed by the Max Planck Society, for which Spirochrome AG owns a license. Z.C., T.L., Z.Y., Y.Z, P.C., and H.Z. are inventors of a patent application protecting the compounds presented in this study which was submitted by Peking University. L.R., S.P., and K.J. own shares of Spirochrome AG. Z.C. owns shares of Genvivo tech. The remaining authors declare no competing interests.

Figures

Figure 1
Figure 1
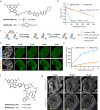
Derivatizing TMR with TSQ alleviates phototoxicity. (a) Jablonski diagram depicting different ways of relaxation from the exited state S1 including photobleaching, phototoxicity, and triplet-state quenching. ISC: Intersystem crossing; TET: Triplet-energy transfer; ROXS: reducing and oxidizing system; ET: Energy transfer. (b) Chemical structures of tetramethyl rhodamine-TSQs (TMR-TSQs) probes. (c) Absolute singlet oxygen quantum yields (ΦΔ) of compounds 15 under 520–530 nm LED light irradiation. The decay slope of DPBF shown in Supplementary S3d is positively correlated with the singlet oxygen quantum yield. Standard deviations of three independent repeats. (d) Live-cell phototoxicity measurements of compounds 15 (250 nM, 15 min) in HeLa cells. Cell apoptosis of >500 cells after 561 nm LED light illumination (1.4 W/cm2) was examined at each time point of the three independent experiments. Error bars indicate the standard deviation. (e) Schematic representation of a low-phototoxic probe, GR555-PM, for plasma membrane labeling. (f) Live-cell images of HeLa cells labeled with WGA-TMRM (30 μg/mL, 5 min) or GR555-PM (50 μg/mL, 5 min) (gray) and stained with Calcein AM (1 μM, 5 min, green) after illumination of 532 nm LED (∼2.6 W/cm2) at different illumination time. Scale bars = 100 μm. MFI: the mean fluorescence of intensity.
Figure 2
Figure 2
Multicolor gentle rhodamines for live-cell fluorescence microscopy of mitochondria. (a) The chemical structures of compounds 7, 9, 11, and 13, their wavelengths of the maximum absorption and emission peaks and (reduction in) absolute singlet oxygen quantum yields (compared to reference dyes) (see Figures S7 and S8). (b) Normalized fluorescence intensities of time-lapse recordings of COS-7 cells labeled with Rho123 or GR510-mito (300 nM, 60 min) after the addition of carbonyl cyanide 3-chlorophenylhydrazone (CCCP). Control samples were treated with Rho123 or GR510-mito without the addition of CCCP. Data points represent averaged fluorescence intensity curves of six cells from two independent biological replicates. Error bars, showing light-shaded areas, indicate the standard deviation. (c) Phototoxicity of GR510-mito or Rho123 (200 nM, 30 min) in HeLa cells, as measured by the analysis of fluorescence retention in mitochondria after 488 nm LED illumination at different times. Data points indicate the mean of at least 1,500 individual cells from three independent biological replicates after bleaching correction. Error bars indicate the standard deviation. (d) Phototoxicity of GR650-mito and SiRM (both 250 nM, 15 min) in HeLa cells, measured by cell apoptosis assay after a 640 nm LED illumination (650 nm, 1.2 W/cm2) at different time points. Data points indicate the mean of at least 1,500 individual cells from three independent biological replicates. Error bars indicate the standard deviation. (e) Confocal microscopy (left) and STED nanoscopy (right, zoom in) of live COS-7 cells labeled with GR650-mito (250 nM) for 15 min at 37 °C. Scale bar = 2 μm. (λex = 640 nm, λSTED = 775 nm). (f) Fluorescence intensity line profiles measured as indicated in the magnified view of the purple boxed area in (e).
Figure 3
Figure 3
Targetable gentle rhodamines for live-cell imaging of DNA and cytoskeleton. (a) Chemical structures of MaP555-DNA (14, blue) and GR555-DNA (15, orange). (b) In vitro singlet oxygen generation experiments of MaP555-DNA and GR555-DNA. The maximum absorption of DPBF at 415 nm was measured under continuous irradiation with a 520–530 nm LED lamp in the presence of each dye (absorbance at 525 nm = 0.15; concentrations: 14, 1 μM; 15, 1.1 μM) in air-saturated acetonitrile containing 0.1% TFA. The absolute singlet oxygen quantum yields (ΦΔ) are given on the graph. Data points represent averaged and normalized DPBF decay curves of three independent repeats. Error bars indicate the standard deviation. (c) Schematic representation of the DNA damage assay based on hXRCC1-GFP. Upon (light-induced) DNA damage, hXRCC1-GFP gets recruited to the damaged site. (d) Live cell confocal images of HeLa cells expressing hXRCC1-GFP at a frame rate of 2 min/frame. HeLa cells were labeled with MaP555-DNA (gray, 200 nM) or GR555-DNA (gray, 2 μM) for 60 min at 37 °C. Puncta formation in the time-lapse images of DNA repair protein hXRCC1 fused with GFP indicates the DNA damage level (green). Scale bars = 2 μm. (e) Semiquantitative analysis of cellular phototoxicity of MaP555-DNA and GR555-DNA of HeLa hXRCC1-GFP cells, as measured by the total number of hXRCC1-GFP puncta from the experiments shown in d. Data points represent the averaged hXRCC1-GFP number of 11 cells from five independent experiments. Error bars indicate the standard error of the mean. (f) Chemical structures of the actin dyes MaP555-Actin (16, blue) and GR555-Actin (17, orange). (g) Long-term time-lapse confocal recordings of HeLa cells at a frame rate of 7.27 s/frame. HeLa cells were labeled with MaP555-Actin or GR555-Actin (both 100 nM with 10 μM verapamil) for 3 h at 37 °C. Cells labeled with GR555-Actin showed no shrinkage and fracture of actin filaments during the time of recording. Scale bars = 10 μm.
Figure 4
Figure 4
Gentle rhodamines for live-cell imaging of cellular proteins using self-labeling protein tags. (a) Chemical structures of MaP555/618, GR555/618 (1821) derivatives coupled to the HaloTag Ligand (chloroalkane substrate). (b) Schematic diagram of the protein damage assay. Firefly luciferase-HaloTag7 (FLuc-HaloTag7) is labeled with MaP555-HTL and GR555-HTL and the photodamage under long-term illumination assessed by the luminescence generated by FLuc afterward. (c) Light-induced photodamage of FLuc-HaloTag7 labeled with MaP555-HTL and GR555-HTLin vitro. The fully labeled protein was illuminated and after different time points the protein damage was assessed by D-Luciferin addition and luminescence measurements. Data points represent the averaged luminescence of three independent experiments. Error bars indicate the standard error of the mean. (d) Live-cell confocal recordings (gray) of U-2 OS cells expressing H2B-HaloTag7 (stable) and DNA repair protein hXRCC1-GFP (transient) at a frame rate of 2 min/frame. U-2 OS cells were labeled with MaP555-HTL or GR555-HTL (both 500 nM) for 30 min at 37 °C. Scale bars: 5 μm. (e) Semiquantitative analysis of cellular phototoxicity analysis of GR555-HTL and MaP555-HTL of U-2 OS H2B-HaloTag7 cells, as measured by counting the total number of hXRCC1-GFP puncta. Data points represent the averaged hXRCC1-GFP number of five cells from five independent experiments. Error bars indicate the standard error of the mean. (f) Long-term time-lapse confocal recordings of HeLa cells expressing HaloTag7-PDGFRtmb at a frame rate of 6.41 s/frame. HeLa cells were labeled with MaP555-HTL or GR555-HTL (both 500 nM) for 30 min at 37 °C. Cells labeled with GR555-HTL showed no appearance of blebs and intact plasma membrane for the time of recording. Scale bars = 10 μm. (g) Photobleaching curves of HeLa cells expressing HaloTag7-PDGFRtmb labeled with MaP555-HTL or GR555-HTL under continuous time-lapse confocal recordings using a 561 nm pulsed laser. The gray arrows indicate the onset of blebbing and membrane disruption. Each curve represents the bleaching curve of an individual HeLa cell.
Figure 5
Figure 5
Gentle rhodamines are privileged dyes for long-term multicolor STED nanoscopy recordings. (a) Dual-color confocal laser-scanning microscopy (CLSM) and STED imaging of the ER and mitochondria using gentle rhodamine probes in live cultured rat hippocampal neurons. Neurons (10 DIV) expressing CalR-HaloTag7 (rAAV transduction) were stained with GR618-HTL (endoplasmic reticulum, cyan, 500 nM) and GR650-mito (mitochondria, red, 50 nM) for 30 min at 37 °C. GR618-HTL was excited with a 561 nm laser and GR650-mito with a 640 nm laser. Both dyes were depleted with a 775 nm depletion laser (STED). White rectangle in the CLSM overview (right) shows magnified FOV for STED imaging. Scale bars = 10 μm (overview), 2 μm (magnification). (b) Time-lapse STED imaging showcasing different photobleaching behavior of MaP/GR618 covalently conjugated to HaloTag (HTL) or its exchangeable counterpart (S5). Multiframe STED imaging of U-2 OS mitochondria outer membrane (TOM20-HaloTag7) labeled with GR618-(x) HTLs over 50 consecutive frames in a 10 × 10 μm ROI using MaP618/GR618-HTL, -S5. Frame numbers are indicated in the top left corner. Scale bars: 1 μm. (c) Bleaching curves (thick lines: mean value, thin lines: individual experiments) plotted for at least 4 image series (n ≥ 4) as shown in (b).
Figure 6
Figure 6
Gentle rhodamines are privileged dyes for voltage imaging of primary cells. (a) Schematic representation of phototoxicity during long-term voltage imaging based on chemigenetic voltage-indicator Voltron. (b) Wide-field microscopy of the neonatal rat cardiomyocytes (NRCMs) expressing Voltron (Ace2-HaloTag7) and labeled with MaP555-HTL or GR555-HTL (both 100 nM) for 25 min at 37 °C. Scale bar = 10 μm. (c) Firing duration of NRCMs expressing Voltron (Ace2-HaloTag7) labeled with MaP555-HTL or GR555-HTL. The illumination intensities of 561 nm lasers were 2.16 W·cm–2. Bars indicate the mean of seven cells. Error bars indicate the standard error of the mean. Significance was determined using a two-tailed unpaired t test followed by Sidak’s multiple comparisons test. P = **** < 1.0 × 10⁻⁴. (d,e) A representative fluorescence trace of NRCMs expressing Voltron and labeled with MaP555-HTL or GR555-HTL. Each peak on the traces showed spontaneous spikes of each NRCM and signals were corrected for photobleaching. The illumination intensity of the 561 nm laser was 2.16 W/cm2. (d) 6 min (36,000 frames) recordings at 100 frames/sec were performed. Two zoomed-in signals (i–ii) from two shaded regions (I–II) were presented at the right. Each black dot represents one spontaneous spike. (e) 15 min (90,000 frames) recordings at 100 frames/sec were performed. Four zoomed-in signals (i–iv) from four shaded regions (I–IV) were presented at the bottom. Each black dot represents one spontaneous spike.

References

    1. Huang X.; Fan J.; Li L.; Liu H.; Wu R.; Wu Y.; Wei L.; Mao H.; Lal A.; Xi P.; Tang L.; Zhang Y.; Liu Y.; Tan S.; Chen L. Fast, long-term, super-resolution imaging with Hessian structured illumination microscopy. Nat. Biotechnol. 2018, 36 (5), 451–459. 10.1038/nbt.4115. - DOI - PubMed
    1. Gwosch K. C.; Pape J. K.; Balzarotti F.; Hoess P.; Ellenberg J.; Ries J.; Hell S. W. MINFLUX nanoscopy delivers 3D multicolor nanometer resolution in cells. Nat. Methods 2020, 17 (2), 217–224. 10.1038/s41592-019-0688-0. - DOI - PubMed
    1. Westphal V.; Rizzoli S. O.; Lauterbach M. A.; Kamin D.; Jahn R.; Hell S. W. Video-Rate Far-Field Optical Nanoscopy Dissects Synaptic Vesicle Movement. Science 2008, 320 (5873), 246–249. 10.1126/science.1154228. - DOI - PubMed
    1. Tosheva K. L.; Yuan Y.; Matos Pereira P.; Culley S.; Henriques R. Between life and death: strategies to reduce phototoxicity in super-resolution microscopy. J. Phys. D. Appl. Phys. 2020, 53 (16), 163001.10.1088/1361-6463/ab6b95. - DOI - PMC - PubMed
    1. Kilian N.; Goryaynov A.; Lessard M. D.; Hooker G.; Toomre D.; Rothman J. E.; Bewersdorf J. Assessing photodamage in live-cell STED microscopy. Nat. Methods 2018, 15 (10), 755–756. 10.1038/s41592-018-0145-5. - DOI - PMC - PubMed

LinkOut - more resources