[Preprint]. 2024 Oct 18:2024.10.15.618522.
doi: 10.1101/2024.10.15.618522.

Restriction of innate Tγδ17 cell plasticity by an AP-1 regulatory axis

Affiliations

Restriction of innate Tγδ17 cell plasticity by an AP-1 regulatory axis

Morgan E Parker et al. bioRxiv. .

Update in

Abstract

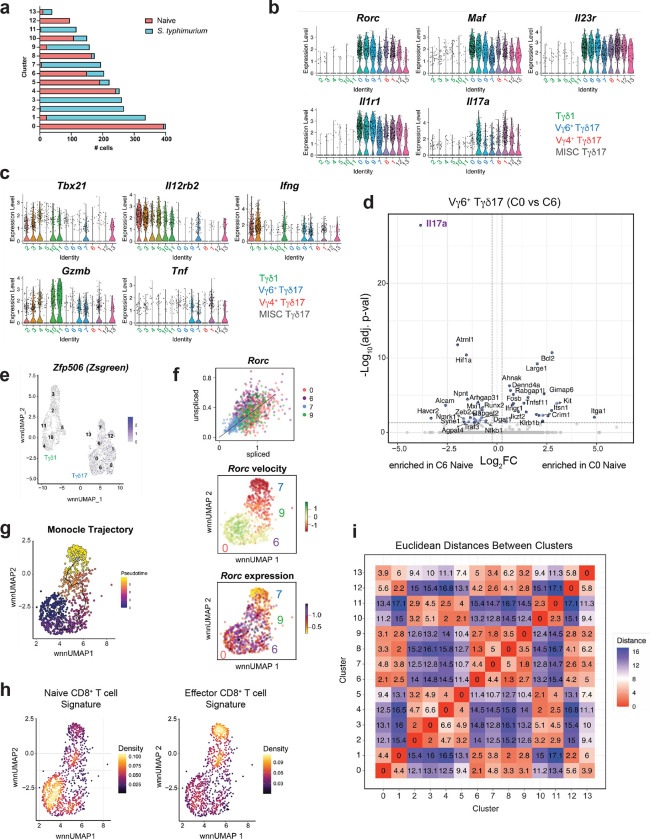
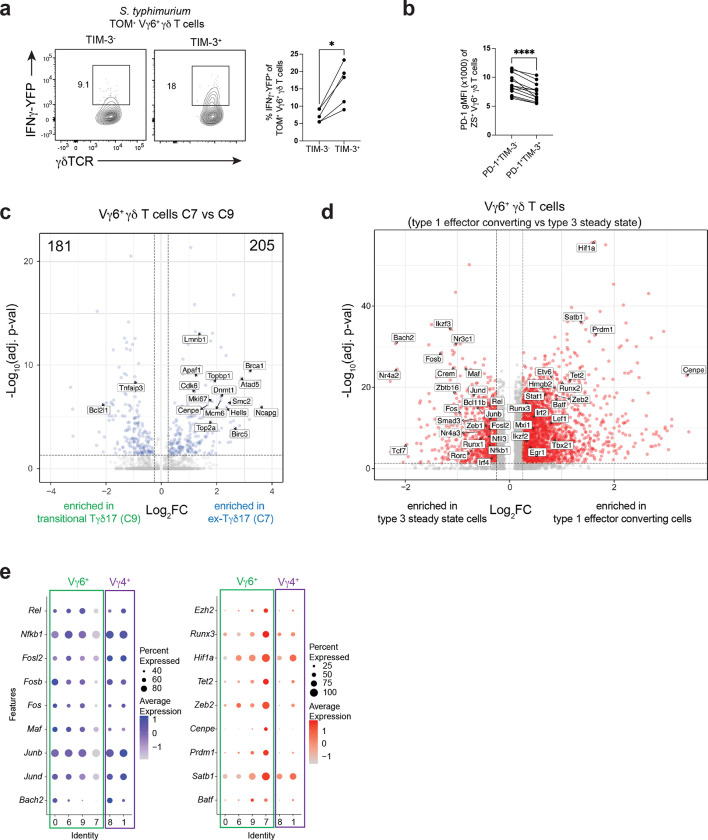
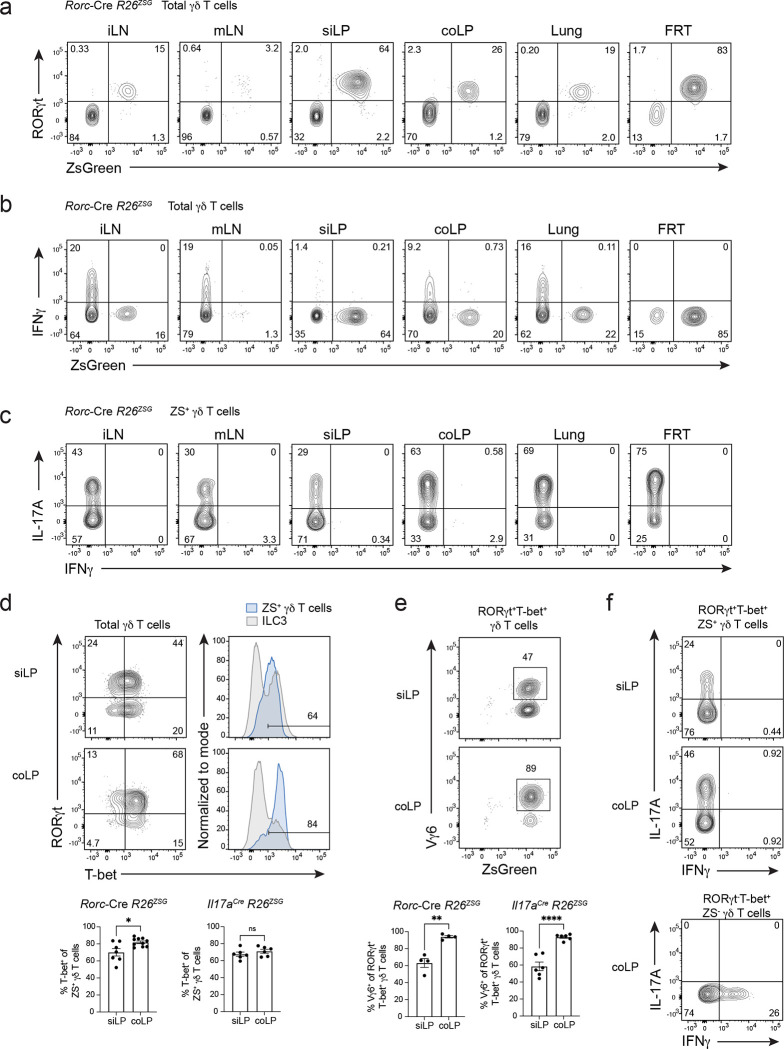
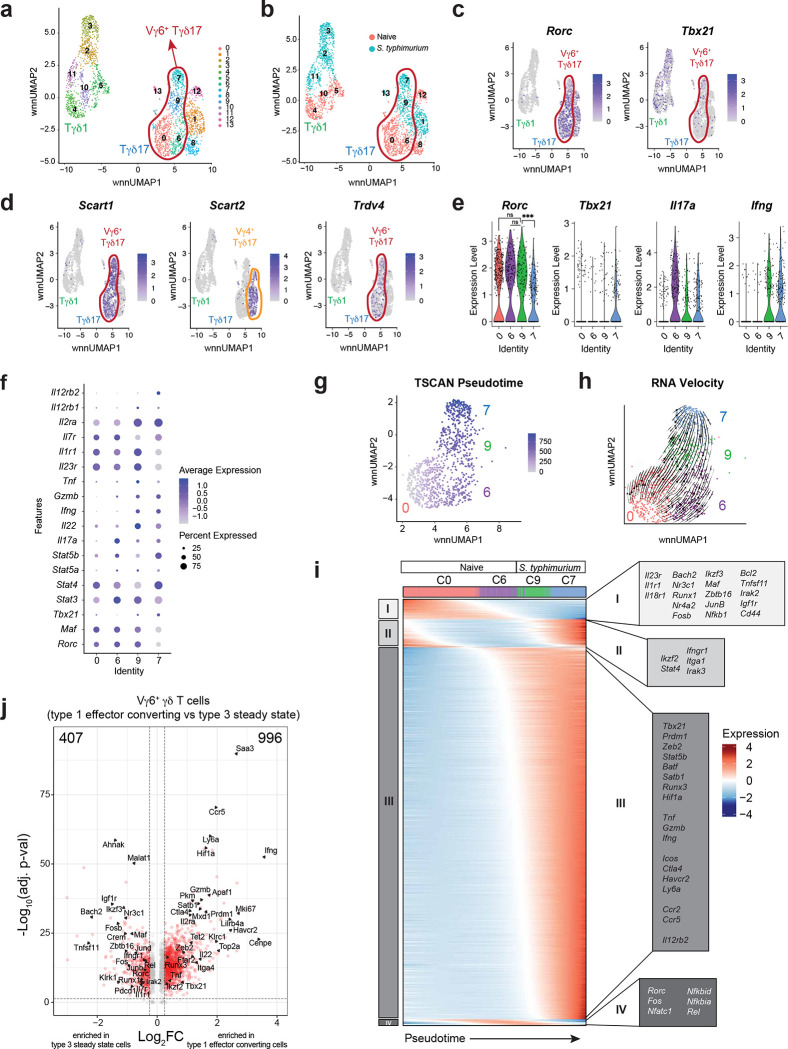
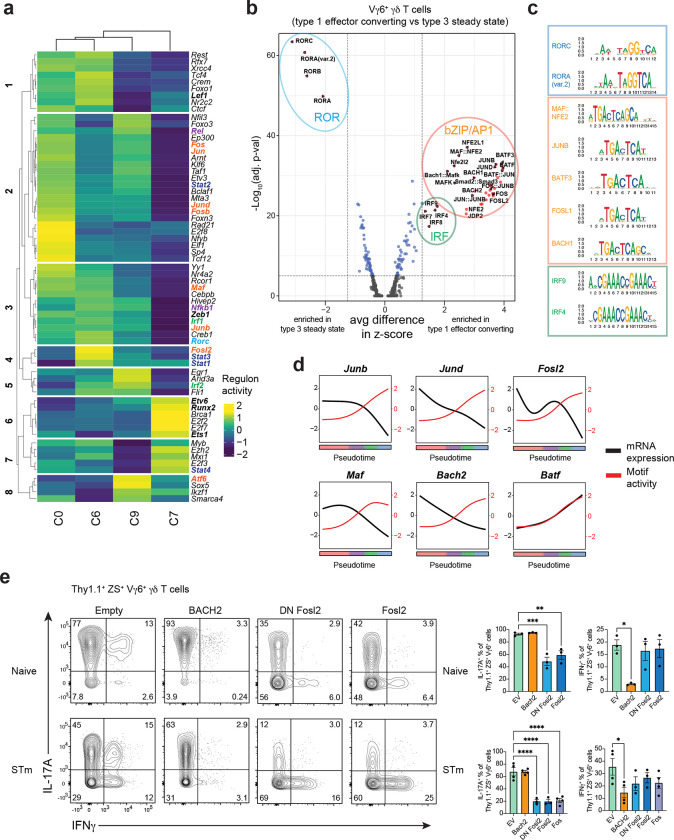
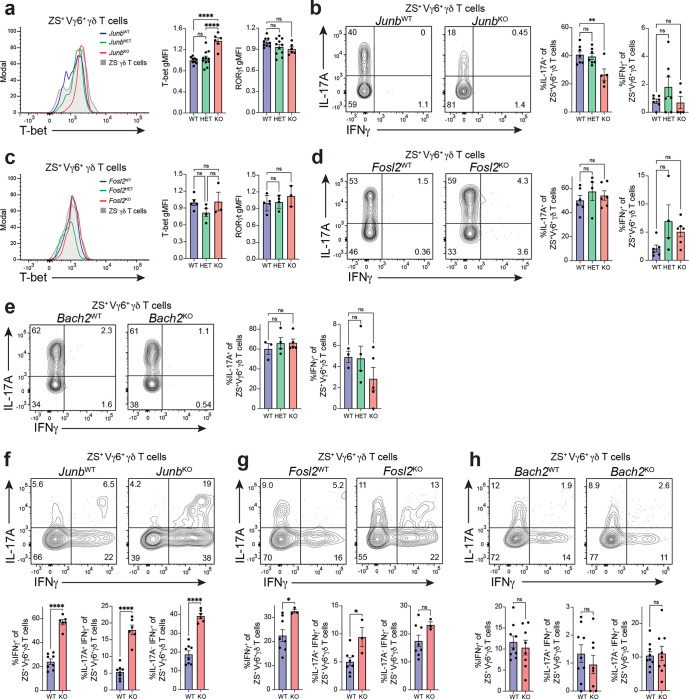
IL-17-producing γδ T (Tγδ17) cells are innate-like mediators of intestinal barrier immunity. While Th17 cell and ILC3 plasticity have been extensively studied, the mechanisms governing Tγδ17 cell effector flexibility remain undefined. Here, we combined type 3 fate-mapping with single cell ATAC/RNA-seq multiome profiling to define the cellular features and regulatory networks underlying Tγδ17 cell plasticity. During homeostasis, Tγδ17 cell effector identity was stable across tissues, including for intestinal T-bet+ Tγδ17 cells that restrained IFNγ production. However, S. typhimurium infection induced intestinal Vγ6+ Tγδ17 cell conversion into type 1 effectors, with loss of IL-17A production and partial RORγt downregulation. Multiome analysis revealed a trajectory along Vγ6+ Tγδ17 effector conversion, with TIM-3 marking ex-Tγδ17 cells with enhanced type 1 functionality. Lastly, we characterized and validated a critical AP-1 regulatory axis centered around JunB and Fosl2 that controls Vγ6+ Tγδ17 cell plasticity by stabilizing type 3 identity and restricting type 1 effector conversion.


Figures

Extended Data Fig. 1.
Extended Data Fig. 1.. Tγδ17 cells are stable at steady state and Vγ6+ Tγδ17 cells are plastic after S. typhimurium in mLN and coLP.
(a) Flow cytometric analysis of coLP of Rorc-Cre R26ZSG and Il17aCre R26ZSG fate-mapping mice. RORγt, IL-17A, and ZS-green expression gated on total γδ T cells. Flow plots representative of more than three independent experiments, n >10. (b) Flow cytometric analysis of coLP of Rorc-Cre R26ZSG measuring Vγ6, Vg4, and ZS-green expression gated on total total γδ T cells (left and top right). Bottom right is gated on ZS+ γδ T cells. Flow plots representative of more than three independent experiments, n > 9. (c) Flow cytometric analysis of total γδ T cells from coLP of Il17aCre R26ZSG fate-mapping mice for RORγt and T-bet expression. Flow plots representative of more than three independent experiments (n =8) except lung is n=5 from one experiment. (d) Summary data of percentage of IL-17A and IFNγ in naïve and S. typhimurium (STm) coLP for Rorc-Cre R26ZSG and Il17aCre R26ZSG fate-mapping mice. Gated on ZS+ γδ T cells. Each summary graph pooled from three independent experiments n=11 or more. (e) Summary data of percentage of IL-17AIFNγ+ in naïve and S. typhimurium (STm) coLP for Il17aCre R26ZSG fate-mapping mice gated on ZS γδ T cells. Each summary graph pooled from two independent experiments, n=9 or more. (f) Summary data of IL-17A gMFI on IL-17A+ Vγ6+ ZS+ γδ T cells. (g) Summary data of percentage of IL-17A+IFNγ, IL-17A+IFNγ+, IL-17AIFNγ+ in naïve and S. typhimurium (STm) coLP for Il17aCre R26ZSG fate-mapping mice gated on Vg4+ ZS+ γδ T cells. Each summary graph pooled from two independent experiments, n=9 or more. (h) Flow cytometric analysis of mLN of Rorc-Cre R26ZSG mice gated on total γδ T cells (left) for RORγt and T-bet expression and Vγ6 expression in RORγt+T-bet+ γδ T cells (right). Representative flow plot from three independent experiments, n > 10 mice. (i) Flow cytometric analysis of IFNγ production by ZS+ γδ T cells in mLN in naïve and S. typhimurium infected Rorc-Cre R26ZSG mice. Representative flow plot from three independent experiments, n > 10 mice. (j) Flow cytometric analysis of Vγ6 versus IFNγ production by ZS+ γδ T cells in mLN in naïve and S. typhimurium infected Rorc-Cre R26ZSG mice. Representative flow plot from three independent experiments, n > 10 mice. (k) Summary data pooled from three independent experiments for RORγt expression among Vγ6+ ZS+ γδ T cells for ZS and ZS+ populations from naïve and (STm) S. typhimurium infected Rorc-Cre R26ZSG mice, n > 10 mice. All results represent mean ± s.e.m. *P < 0.05; **P < 0.01; ****P < 0.0001; ns, not significant (two-tailed unpaired Student’s t-test). Numbers in flow plots represent percentages of cells in the gate.
Extended Data Fig. 2.
Extended Data Fig. 2.. Single cell multiome characterization of γδ T cells and Vγ6+ Tγδ17 cell trajectories.
(a) Barplot of number of cells in each cluster and from which condition for total γδ T cells. (b,c) Violin Plots of type 3 and 1 genes for γδ T cells clusters. (d) Volcano plot for cells from naïve condition for C0 vs C6 Vγ6+ Tγδ17 cells with blue dots indicating significance based on p-val adj < 0.05 and log2FC > 0.25; FC, fold change. (e) zFP506 (ZsGreen) FeaturePlot for γδ T cell clusters. (f) Plot of per cell unspliced versus spliced Rorc transcript, RNA velocity for Rorc, and Rorc expression FeaturePlot all for Vγ6+ Tγδ17 clusters C0, C6, C9 and C7. (g) Monocle 3 trajectory of Vγ6+ Tγδ17 clusters C0, C6, C9 and C7. (h) CD8+ T cell gene signatures (GSE9650) projected onto UMAP space with Seurat’s AddModuleScore function. Nebulosa Plot Density plot displaying enrichment of gene signature. (Left) Genes upregulated in naive vs effector CD8+ T cells. (Right) Genes downregulated in naive vs effector CD8+ T cells. (i) Euclidian distances between γδ T cell clusters based on WNN UMAP.
Extended Data Fig. 3.
Extended Data Fig. 3.. Effector converted Vγ6+ Tγδ17 cells have distinct transcriptional profiles compared to steady state.
(a) IFNγ-YFP expression in fate-mapped TIM-3 or TIM-3+ Vγ6+ TOM+ γδ T cells from naïve and S. typhimurium infected Il17aCre R26TOM IFNγ-YFP mice. Summary plot from one experiment n=5 mice. (b) Summary data for PD-1 gMFI in PD-1+TIM-3 or PD-1+TIM-3+ Vγ6+ ZS+ γδ T cells compiled from three experiments, n=13 mice. (c) Volcano plot for differentially expressed genes between C7 vs C9 Vγ6+ Tγδ17 cells with blue dots having p-val adj < 0.05 and log2FC > 0.25. (d) Volcano plot of differentially expressed transcription factors in type 1 converting Vγ6+ γδ T cell clusters (C7+C9) compared to type 3 steady state clusters (C0+C6) with red dots having p-val adj < 0.05 and log2FC > 0.25; FC, fold change. (e) DotPlot for Tγδ17 cell clusters for select transcriptional regulators downregulated (left) or upregulated (right) in Vγ6+ Tγδ17 cells with Vg4+ Tγδ17 cells for comparison. All results represent mean ± s.e.m. Paired t-test for (a-b). *P < 0.05; ****P < 0.0001; ns, not significant (two-tailed paired Student’s t-test). Numbers in flow plots represent percentages of cells in the gate.
Extended Data Fig. 4.
Extended Data Fig. 4.. BACH2 and AP-1 TFs regulate Vγ6+ Tγδ17 plasticity in vitro.
(a) Schematic of Vγ6+ Tγδ17 cluster 0, 6, 9, and 7 for number of regions differentially accessible (DA) (p < 0.05) with regions increasing (UP, red) and decreasing (DOWN, blue) in accessibility. (b) Pseudobulk scATAC-seq CoveragePlots for Rorc and IFNγ loci for Vγ6+ Tγδ17 cluster 0, 6, 9, and 7. Rectangle highlights regions with significant differential accessibility (p < 0.05) shown for decreasing (orange) or increasing (blue) in accessibility. (c) Motif activity dot plot of Vγ6+ Tγδ17 clusters using chromVAR with colored boxes highlighting specific TF families. (d) TFs in Vγ6+ Tγδ17 cell overexpression screen. X’s in RNA DEG column means the TF of interest is DEG at some point along trajectory. X in Regulon column means the TF shows up in regulon analysis. X in Motif Activity column means TF has differential motif activity (chromVAR) during conversion. X in Literature column means TF is implicated in type 3 lymphocyte regulation. Blue TFs predicted to stabilize type 3 program and green TFs predicted to promote type 1 conversion. (e) Flow cytometric analysis of cytokine production from 9 day Tγδ17 mLN culture. Gated on transduced Vγ6+ (Vg4) Thy1.1+ ZS+ γδ T cells from steady state Il17aCreR26ZSG mice after 4 hours PMA/Ionomycin stimulation. Summary graph pooled from two independent experiments. (f) Same as in e but from S. typhimurium infected Il17aCreR26ZSG mice. Summary graph from one independent experiment. Statistical analyses included Ordinary one-way ANOVA tests for (e,f). Results represent mean ± s.e.m. *P < 0.05; **P < 0.01; ***P < 0.001; ****P < 0.0001; DEG, differentially expressed gene; ns, not significant.
Extended Data Fig. 5.
Extended Data Fig. 5.. JunB plays a more prominent role than Fosl2 in Vγ6+ Tγδ17 cell plasticity.
(a-b) Flow cytometric analysis was performed on colonic ZsGreen+ Vγ6+ Tγδ17 cells from mice with compound Junb and Fosl2 conditional deletions on the Il17aCreR26ZSG deleter background at steady state (TF+/+, TFWT; TFfl/+, TFHET; TFfl/fl, TFKO): (a) Representative flow cytometric analysis of the frequency of IL-17A and IFNγ producing cells following 4 h PMA/ionomycin stimulation. (n = 3–4 mice/genotype; two independent experiments). (b) Representative flow cytometric analysis and summary plots of the frequency of IL-17A and IFNγ producing colonic ZS+ Vγ6+ Tγδ17 cells at steady state following 20-h stimulation with IL-23 and IL-1β. (n = 2–11 mice/genotype; two independent experiments). (c) Flow cytometric analysis was performed on ZS+ Vγ6+ from mLN of naïve Bach2+/+Il17aCreR26ZSG (Bach2WT) and Bach2fl/flIl17aCreR26ZSG (Bach2KO) mice on day 9 of Tγδ17 mLN culture. Summary plots of the frequency of IL-17A and IFNγ producing cells following 4 h PMA/ionomycin stimulation (n = 5 mice/genotype; three independent experiments). (a-c) Gating was performed on fate-mapped Vg4 Tγδ17 cells (CD3e+γδTCR+TCRbZS+Vg4). Statistical analyses include Two-tailed unpaired Student’s t-tests for (a,c) and an Ordinary one-way ANOVA test for (b). Results represent mean ± s.e.m. *P < 0.05; **P < 0.01; ns, not significant. Numbers in flow plots represent percentages of cells in the gate.
Fig. 1.
Fig. 1.. Tγδ17 cell identity is stable at steady state and IFNγ production is restrained in intestinal T-bet+ Tγδ17 cells.
(a) Flow cytometric analysis of RORγt versus ZS-green expression in total γδ T cells (CD3+γδTCR+TCRβ) from Rorc-Cre R26ZSG mice. Flow cytometric analysis of cytokine production by (b) total γδ T cells (CD3+γδTCR+TCRb) and (c) ZS+ CD3+γδTCR+TCRb cells from lymphoid (iLN and mLN) and nonlymphoid tissues (siLP, coLP, Lung, FRT) of Rorc-Cre R26ZSG mice after 4 hours of PMA/Ionomycin stimulation. Representative of three or more independent experiments with n=8 or more, except lung n=5. (d) Flow cytometric analysis of RORγt and T-bet expression in siLP and coLP γδ T cells (CD3+γδTCR+TCRb) from Rorc-Cre R26ZSG mice. ILC3 provided as T-bet+ and T-bet reference. (e) As in (a), except analysis of Vγ6 and ZS-green expression among RORγt+T-bet+ γδ T cells. (f) Cytokine production after PMA/Ionomycin stimulation for 4 hours of siLP and coLP RORγt+T-bet+ ZS+ γδ T cells (top) and coLP RORγtT-bet+ ZS γδ T cells (bottom). Three or more independent experiments performed. d, e, and f summary plots are from two independent experiments; (d) left n=7–10, (d) right n=6, (e) left n=4, (e) right n=6 mice. All results represent mean ± s.e.m. *P < 0.05; **P < 0.01; ****P < 0.0001; ns, not significant (two-tailed unpaired Student’s t-test). Numbers in flow plots represent percentages of cells in the gate.
Fig. 2.
Fig. 2.. Vγ6+ Tγδ17 cells are functionally plastic after intestinal S. typhimurium infection.
(a) Flow cytometric analysis of coLP of naïve and S. typhimurium infected Rorc-Cre R26ZSG mice for IFNγ production versus ZS-green expression gated on total γδ T cells. (b) Cytokine production from subsets of γδ T cells; ZS γδ T cells, and ZS+ γδ T cells further gated on Vg4 or Vγ6 from the coLP of Il17aCre R26ZSG naïve or (STm) S. typhimurium infected mice. Summary data pooled from two independent experiments. n=9 or more mice per condition. (c) IFNγ-YFP expression in total γδ T cells and (d) Vg4 or Vγ6 versus IFNγ-YFP expression in fate-mapped TOM+ γδ T cells from naïve and S. typhimurium infected Il17aCre R26TOM IFNγ-YFP mice. Flow plots representative of more than three independent experiments, n >8 for c and d. (e) RORγt expression among ILCs (CD3CD127+CCR6) and γδ T cells for ZS and ZS+ populations from naïve and (STm) S. typhimurium infected Rorc-Cre R26ZSG mice. Summary data from one experiment representative of three or more experiments, n >10. (f) IFNγ and RORγt expression among CD4+ T cells (CD3+CD4+) for ZS and ZS+ populations from naïve and day 13 C. rodentium infected Il17aCre R26ZSG mice. (g) Flow cytometric analysis of coLP of naïve and S. typhimurium infected RORγt-E2-Crimson reporter mice for RORγt-E2-Crimson expression gated on CD127+ or CD127 cells pregated on Vg4 T-bet-ZsGreen+ γδ T cells. Summary data n= 4–5 mice per condition from one independent experiment for RORγt-E2-Crimson gMFI and frequency. (h) Flow cytometric analysis of coLP of naïve and S. typhimurium infected Rorc-Cre R26ZSG mice for IFNγ and RORγt expression gated on Vγ6+ ZS+ γδ T cells and ZS γδ T cells for comparison. Summary graph from one experiment (n=5) but representative of two or more experiments. Statistical analyses included Two-tailed unpaired Student’s t-tests for b, e and ordinary one-way ANOVA test for g, h. Numbers in flow plots represent percentages of cells in the gate. All results represent mean ± s.e.m. *P < 0.05; **P < 0.01; ****P < 0.0001; ns, not significant.
Fig. 3.
Fig. 3.. Single cell multiome characterization of Vγ6+ Tγδ17 plasticity.
(a) DimPlot of γδ T cells reclustered with WNN reduction. (b) DimPlot of γδ T cells from each condition. (c) FeaturePlot showing Rorc and Tbx21 expression in γδ T cells clusters. (d) FeaturePlot showing Cd163l1 (Scart1), 5830411N06Rik (Scart2), and Trdv4 expression in γδ T cells clusters. (e) Violin Plots of Rorc, Tbx21, Il17a, and IFNγ expression for Vγ6+ Tγδ17 cell clusters. (f) DotPlot for select genes in Vγ6+ Tγδ17 cell clusters. (g) TSCAN pseudotime trajectory on a FeaturePlot of Vγ6+ Tγδ17 clusters C0, C6, C9 and C7. (h) RNA Velocity (bottom) of Vγ6+ Tγδ17 clusters C0, C6, C9 and C7. (i) Groups of genes changing along TSCAN pseudotime as in (g). (j) Volcano plot of post-infection Vγ6+ Tγδ17 cell clusters (C7+C9) compared to steady state clusters (C0+C6) with red dots having p-val adj < 0.05 and log2FC > 0.25. One-way ANOVA Tukey test for e Rorc plot. *P < 0.05; **P < 0.01; ***P < 0.001; ****P < 0.0001; ns, not significant.
Fig. 4.
Fig. 4.. TIM-3 marks ex-Tγδ17 cells with type 1 functionality.
(a) Volcano plot for differentially expressed genes between C7 versus C9 Vγ6+ Tγδ17 cells. Red dots denote significant differences with p-val adj < 0.05 and log2FC > 0.25; FC, fold change. (b) Violin plots showing expression of select genes in Vγ6+ Tγδ17 cell clusters. (c) Flow cytometric analysis of PD-1 and TIM-3 expression on ZS+ Tγδ17 cells from naive and S. Typhimurium (STm) infected Il17aCre R26ZSG mice. (Top) Vγ6+ Tγδ17 cells and (bottom) are Vg4+ Tγδ17 cells gated as Vγ6 Tγδ17 cells. Summary data from one experiment, representative of more than three experiments. (d) Flow cytometry plots showing cytokine production after ex vivo stimulation gated on TIM-3 versus TIM-3+ Vγ6+ Tγδ17 cells from S. Typhimurium (STm) Il17aCre R26ZSG infected mice. Summary plots from two independent experiments n=10 mice. (e) Nebulosa density plot for Havcr2 and Mki67 for Vγ6+ Tγδ17 cell clusters. (f) Ki-67 frequency in ZS+ Tγδ17 cells from naive and S. Typhimurium (STm) infected Il17aCre R26ZSG or Rorc-Cre R26ZSG mice. Representative histograms gated on Vγ6+ or Vg4+ Tγδ17 cells. Summary data compiled from two independent experiments and n=6 naive mice and n=9 STm mice. (g) Histogram gated on TIM-3 versus TIM-3+ Vγ6+ Tγδ17 cells or Vγ6+ Tγδ17 cells from a naive mouse as a control. Summary data of percent Ki-67+ among TIM-3 versus TIM-3+ Vγ6+ Tγδ17 cells from S. Typhimurium (STm) infected Il17aCre R26ZSG or Rorc-Cre R26ZSG mice, compiled from two independent experiments and n=9 mice. Statistical analyses included a Two-tailed unpaired Student’s t-test for c, f and Two-tailed paired Student’s t-test for d, g. Results represent mean ± s.e.m. *P < 0.05; **P < 0.01; ***P < 0.001; ****P < 0.0001; ns, not significant. Numbers in flow plots represent percentages of cells in the gate.
Fig. 5.
Fig. 5.. bZIP TFs are dynamically regulated during Vγ6+ Tγδ17 cell effector plasticity.
(a) Regulon activity using SCENIC analysis on Vγ6+ Tγδ17 cell clusters C0, C6, C9, and C7. Colored genes draw attention to specific gene families. Red = AP-1 family. (b) Motif activity analysis on differentially accessible regions between Vγ6+ Tγδ17 cell clusters C7+C9 (post-infection) compared to C0+C6 (steady state). Vertical dotted line represents fold change cut off at 1.25 for average difference in z-score in terms of fold-change between groups. Horizontal line represents p-val adjusted cut off at 5×10⁻⁵. Colored circles represent TF families. (c) Representative top motifs displayed as MotifPlots per TF family circled in (b). (d) Motif activity (red) and mRNA expression (black) for select TFs across Vγ6+ Tγδ17 pseudotime. (e) Flow cytometric analysis of cytokine production in 9 day Tγδ17 mLN culture. Gated on transduced Vγ6+ (Vg4) Thy1.1+ ZS+ γδ T cells after 4h PMA/Ionomycin stimulation. Top row is from naive mLN cultures from Il17aCreR26ZSG mice and bottom row is from mLN cultures from S. typhimurium (STm) infected Il17aCreR26ZSG mice. Summary graph pooled from two independent experiments for both top and bottom. Statistical analysis includes an Ordinary one-way ANOVA test for e. Results represent mean ± s.e.m. *P < 0.05; **P < 0.01; ***P < 0.001; ****P < 0.0001; ns, not significant. Numbers in flow plots represent percentages of cells in the gate.
Fig. 6.
Fig. 6.. JunB and Fosl2 stabilize Vγ6+ Tγδ17 cell identity.
(a-h) Flow cytometric analysis was performed on colonic ZsGreen+ Vγ6+ Tγδ17 cells from mice with Junb, Fosl2, or Bach2 conditional deletions on the Il17aCreR26ZSG deleter background at steady state (TF+/+, TFWT; TFfl/+, TFHET; TFfl/fl, TFKO). (a,c) Histograms of T-bet expression, and summary plots of normalized T-bet and RORγt expression. (b,d,e) Representative flow cytometric analysis and summary plots of the frequency of IL-17A and IFNγ producing cells following 4 h PMA/ionomycin stimulation. (a-b) Junb: (a) n = 6–11 mice/genotype; three independent experiments. (b) n = 5–7 mice/genotype; three independent experiments. (c-d) Fosl2: (c) n = 3–5 mice/genotype; two independent experiments. (d) n = 4–6 mice/genotype; two independent experiments. (e) Bach2: n = 4–5 mice/genotype; two independent experiments. (f-h) Representative flow cytometric analysis and summary plots of the frequency of IL-17A and IFNγ producing cells at steady state following 20h stimulation with IL-23 and IL-1β for the following genotypes: (f) Junb (n = 6–8 mice/genotype; two independent experiments), (g) Fosl2 (n = 3–8 mice/genotype; two independent experiments), and (h) Bach2 (n = 9 mice/genotype; two independent experiments). (a-e) Gating was performed on fate-mapped Vγ6+ Tγδ17 cells (CD3e+γδTCR+TCRbZS+Vγ6+), and for (f-h), gating was performed on fate-mapped Vg4 Tγδ17 cells (CD3e+γδTCR+TCRbZS+Vg4). Statistical analyses include Ordinary one-way ANOVA tests for (a-e) and Two-tailed unpaired Student’s t-tests for (f-h). Results represent mean ± s.e.m. *P < 0.05; **P < 0.01; ***P < 0.001; ****P < 0.0001; ns, not significant. Numbers in flow plots represent percentages of cells in the gate.
Fig. 7.
Fig. 7.. JunB and Fosl2 limit type 1 plasticity in Vγ6+ Tγδ17 cells during S. typhimurium infection.
(a-f) Flow cytometric analysis was performed on colonic ZsGreen+ Vγ6+ Tγδ17 cells from mice with Junb, Fosl2, or Bach2 conditional deletions on the Il17aCreR26ZSG deleter background during S. typhimurium infection: (TF+/+, TFWT; TFfl/+, TFHET; TFfl/fl, TFKO). (a,b,e) Histograms of RORγt expression, and summary plots of normalized RORγt and T-bet expression. (c,d,f) Representative flow cytometric analysis and summary plots of the frequency of IL-17A and IFNγ producing cells following 4 h PMA/ionomycin stimulation. (a,c) Junb: n = 4–6 mice/genotype; two independent experiments. (b,d) Fosl2: (b) n = 4–7 mice/genotype; two independent experiments. (d) n = 6–10 mice/genotype; two independent experiments. (e-f) Bach2: (e) n = 6–10 mice/genotype; two independent experiments. (f) n = 6–8 mice/genotype; two independent experiments. (g-h) Flow cytometric analysis of colonic ZsGreen+ Vγ6+ Tγδ17 cells from Rorct+/+Il17aCreR26ZSG (Rorct WT) and Rorctfl/+Il17aCreR26ZSG (Rorct HET) mice at steady state: (g) Histograms of T-bet expression, and summary plots of normalized T-bet and RORγt expression (n = 7–10 mice/genotype; three independent experiments). (h) Representative flow cytometric analysis and summary plots of the frequency of IL-17A and IFNγ producing cells following 4 h PMA/ionomycin stimulation (n = 7–10 mice/genotype; three independent experiments). (a-f) Gating was performed on fate-mapped Vγ6+ Tγδ17 cells (CD3e+γδTCR+TCRbZS+Vγ6+), and for (g-h), gating was performed on fate-mapped Vg4 Tγδ17 cells (CD3e+γδTCR+TCRbZS+Vg4). For S. typhimurium infection experiments (a-f), cells harvested from mice 96h post-infection. Statistical analyses include Ordinary one-way ANOVA tests for (a-f), and a Two-tailed unpaired Student’s t-test for (g-h). Results represent mean ± s.e.m. *P < 0.05; **P < 0.01; ***P < 0.001; ****P < 0.0001; ns, not significant. Numbers in flow plots represent percentages of cells in the gate.

References

    1. Vantourout P. & Hayday A. Six-of-the-best: unique contributions of γδ T cells to immunology. Nat. Rev. Immunol. 13, 88–100 (2013). - PMC - PubMed
    1. Hayday A. C. gammadelta T Cell Update: Adaptate Orchestrators of Immune Surveillance. J Immunol 203, 311–320 (2019). - PubMed
    1. Fan X. & Rudensky A. Y. Hallmarks of tissue-resident lymphocytes. Cell 164, 1198–1211 (2016). - PMC - PubMed
    1. Mayassi T., Barreiro L. B., Rossjohn J. & Jabri B. A multilayered immune system through the lens of unconventional T cells. Nature 595, 501–510 (2021). - PMC - PubMed
    1. Parker M. E. & Ciofani M. Regulation of γδ t cell effector diversification in the thymus. Front. Immunol. 11, 42 (2020). - PMC - PubMed

Publication types