[Preprint]. 2024 Oct 17:2024.10.16.618764.
doi: 10.1101/2024.10.16.618764.

Identification of SLC35A1 as an essential host factor for the transduction of multi-serotype recombinant adeno-associated virus (AAV) vectors

Affiliations

Identification of SLC35A1 as an essential host factor for the transduction of multi-serotype recombinant adeno-associated virus (AAV) vectors

Xiujuan Zhang et al. bioRxiv. .

Update in

Abstract

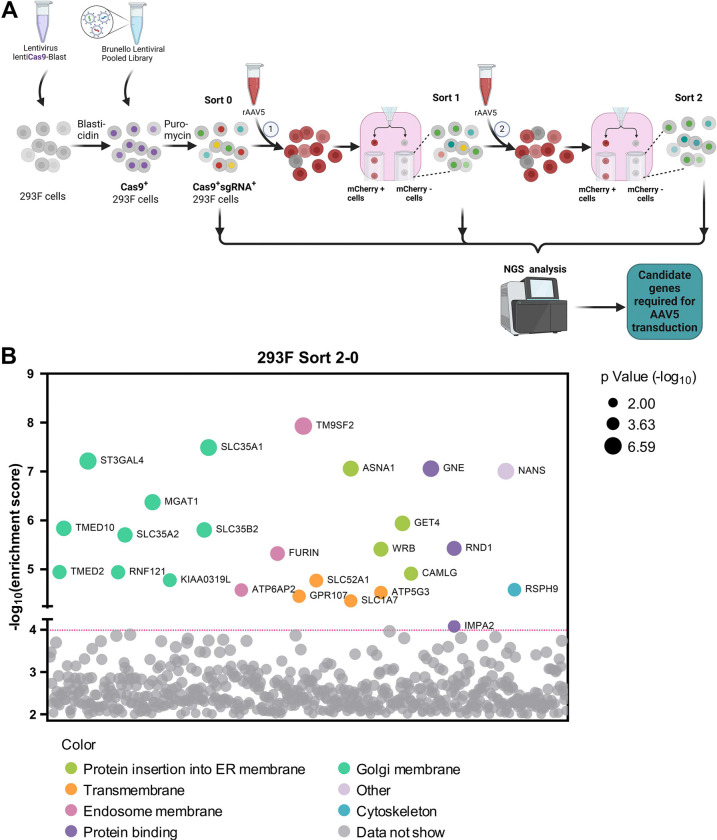
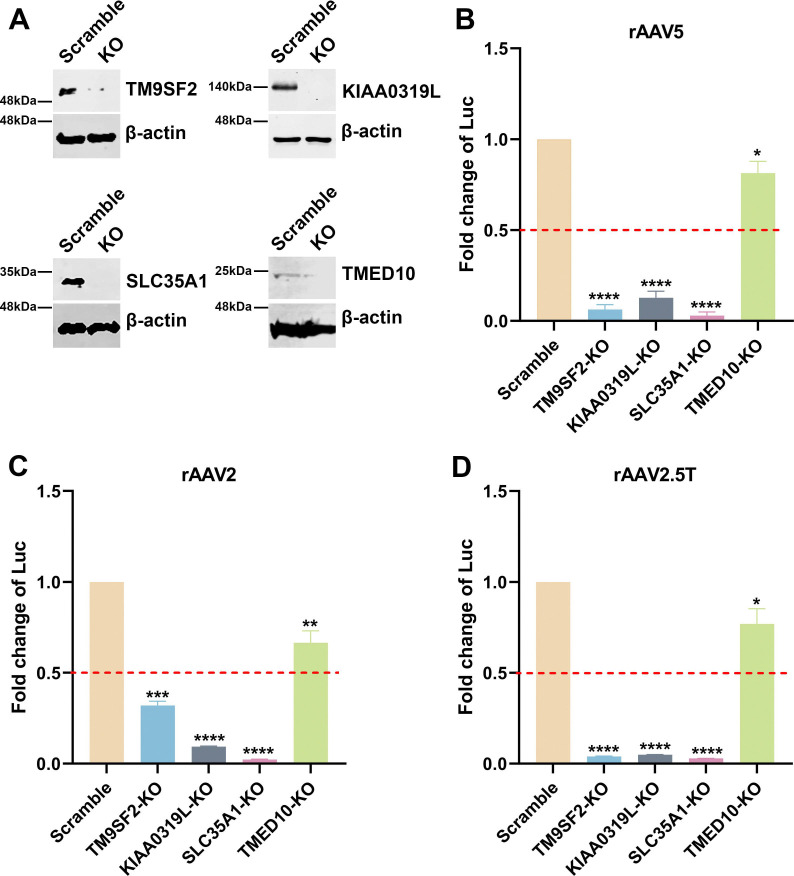
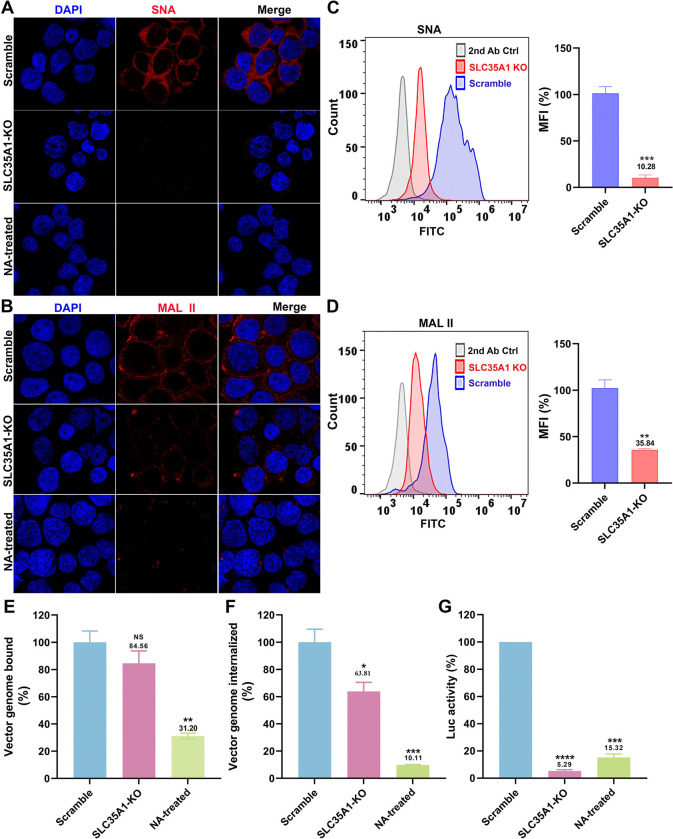
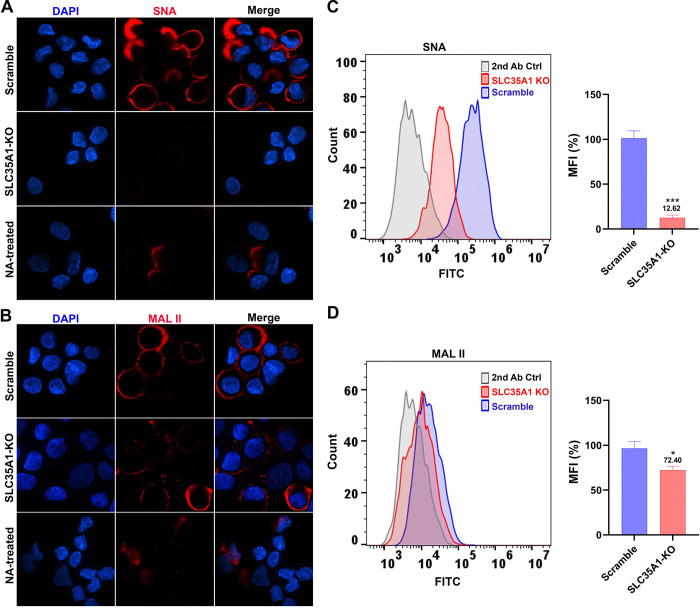
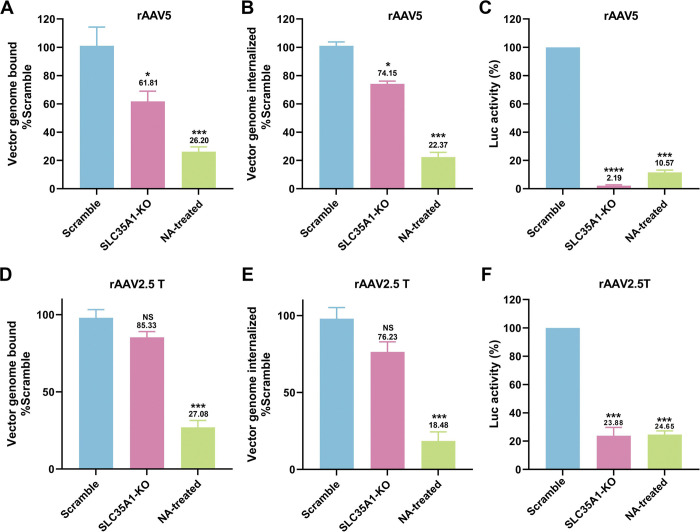
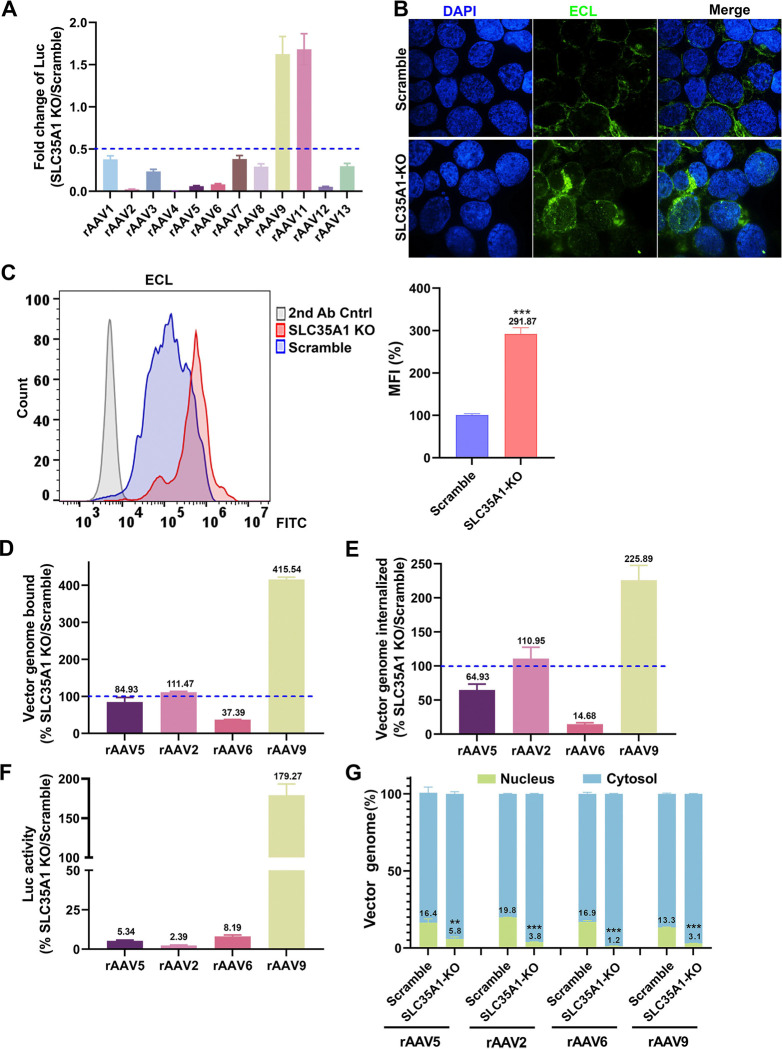
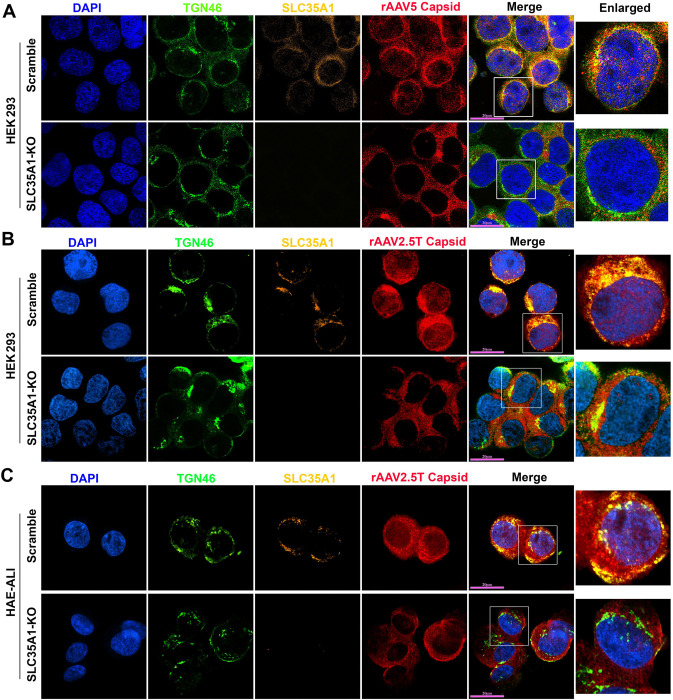
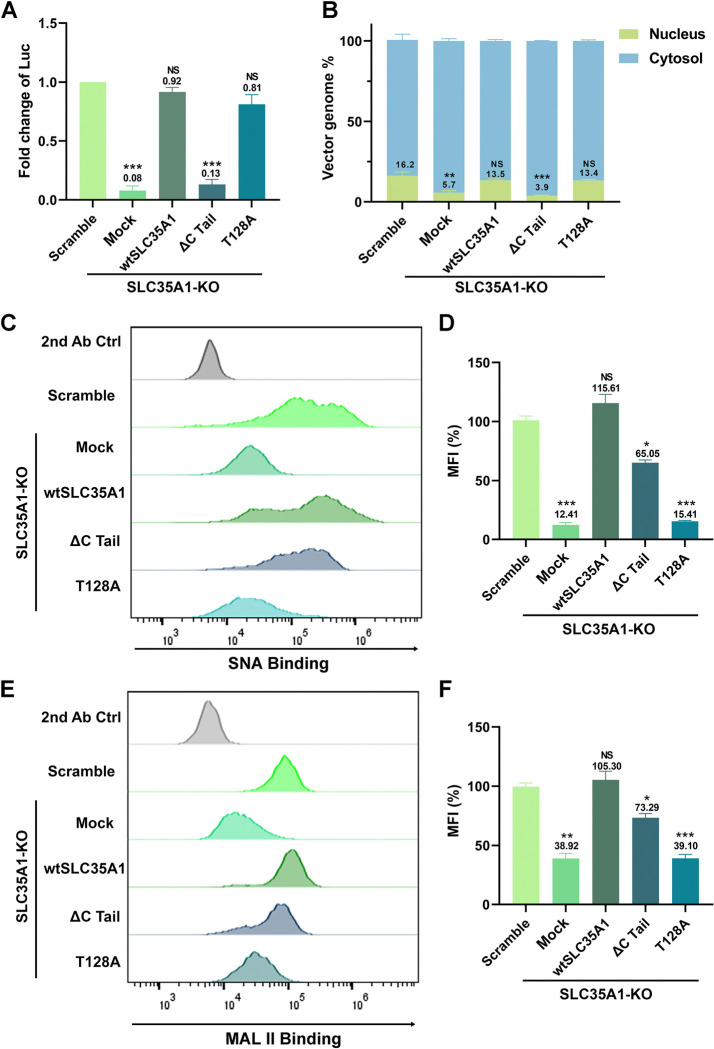
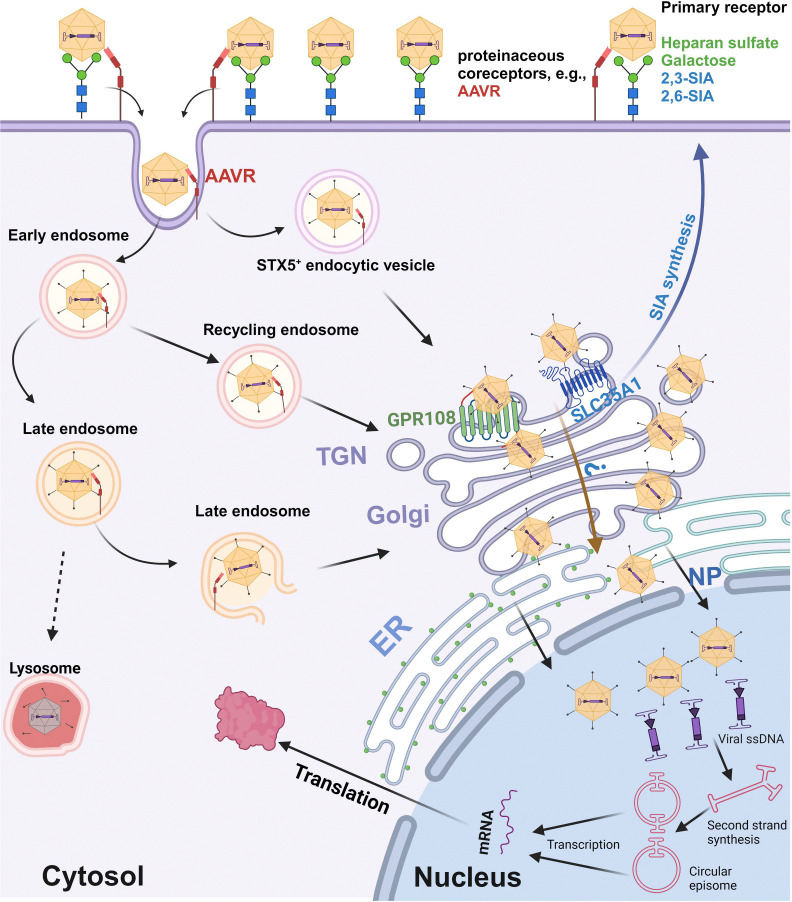
We conducted a genome-wide CRISPR/Cas9 screen in suspension 293-F cells transduced with rAAV5. The highly selected genes revealed after two rounds of screens included the previously reported KIAA039L, TM9SF2, and RNF121, along with a cluster of genes involved in glycan biogenesis, Golgi apparatus localization and endoplasmic reticulum penetration. In this report, we focused on solute carrier family 35 member A1 (SLC35A1), a Golgi apparatus-localized cytidine 5'-monophosphate-sialic acid (CMP-SIA) transporter. We confirmed that SLC35A1 knockout (KO) significantly decreased rAAV5 transduction to a level lower than that observed in KIAA0319L or TM9SF2 KO cells. Although SLC35A1 KO drastically reduced the expression of α2,6-linked SIA on the cell surface, the expression of α2,3-linked SIA, as well as the cell binding and internalization of rAAV5, were only moderately affected. Moreover, SLC35A1 KO significantly diminished the transduction of AAV multi-serotypes, including rAAV2 and rAAV3 which do not utilize SIAs for primary attachment. Notably, the SLC35A1 KO markedly increased transduction of rAAV9 and rAAV11, which primarily attach to cells via binding to galactose. Further analyses revealed that SLC35A1 KO significantly decreased vector nuclear import. More importantly, although the C-terminal cytoplasmic tail deletion (ΔC Tail) mutant of SLC35A1 did not drastically decrease SIA expression, it significantly decreased rAAV transduction, as well as vector nuclear import, suggesting the C-tail is critical in these processes. Furthermore, the T128A mutant significantly decreased SIA expression, but still supported rAAV transduction and nuclear import. These findings highlight the involvement of the CMP-SIA transporter in the intracellular trafficking of rAAV vectors post-internalization.

Keywords: SLC35A1; intracellular trafficking; nuclear import; rAAV; transduction.


Conflict of interest statement

CONFLICTS OF INTEREST RM is an employee of GeneGoCell Inc. The remaining authors have no competing financial interests.

Figures

Figure 1.
Figure 1.. The Genome-wide CRISPR/Cas9 screen identifies host factors required for rAAV5 transduction.
(A) Diagram of genome-wide CRISPR/Cas9 gRNA library screen. Suspension 293-F cells were transduced with a lentiviral vector carrying spCas9 and a blasticidin resistance gene followed by blasticidin selection. Blasticidin-resistant spCas9-expressing cells (1×10⁸) were then transduced with the Brunello lentiCRISPR gRNA lentiviral library and selected with puromycin to obtain Cas9/sgRNA-expressing 293-F cells. The selected cells were cultured and expanded to 2×10⁸. Among them, 1×10⁸ cells were harvested for genomic DNA (gDNA) extraction as the control (gDNASort0), while the other 1×10⁸ cells were transduced with mCherry-expressing rAAV5. Flow cytometry was performed at 3 days post-transduction (dpt), and the top 1% mCherry-negative (mCherry−) cells were collected and expanded to 2×10⁸ as the Sort 1 cells. We used 1×10⁸ cells from this population for gDNA extraction (gDNASort1), and another 1×10⁸ cells for the 2nd round screening of rAAV5 transduction. The mCherry− cells from this round collected from cell sorting were expanded to 1×10⁸ for gDNA extraction (gDNASort2). The gDNA samples were subjected to NGS and bioinformatics analysis. (B) Enrichment of genes from the 2nd round screen of mCherry− cells. NGS analyses were aimed at the sgRNA recognition sequences present in the mCherry− cell population, which identified the disrupted target genes at these sites. The x-axis represents genes targeted by the Brunello library, grouped by gene ontology analysis. The y-axis shows the enrichment score [−log10] of each gene based on MAGeCK analysis of the sgRNA reads in gDNASort2 vs. gDNASort0. Each circle represents a gene, with its size indicating the statistical significance [−log10] of enrichment when comparing gDNASort2 to gDNASort0. The color of each circle represents the function of the genes. Only genes with an enrichment score greater than 104 are shown.
Figure 2.
Figure 2.. rAAV5, rAAV2, and rAAV2.5T transduction in SLC35A1, TM9SF2, KIAA0319L, and TMED10 KO HEK293 cells.
sgRNA-expressing lentiviral vectors were applied in HEK293 cells to generate SLC35A1, TM9SF2, and KIAA0319L KO cell lines. (A) Western blotting. Western blotting analysis shows the KO efficiency of scramble control and gene KO cells. β-actin was used as a loading control. (B-D) Luciferase activities in gene KO HEK293 cells. Scramble and gene KO cells were transduced with rAAV5 at an MOI of 20,000 DRP/cell (B), rAAV2 at an MOI of 2,000 DRP/cell (C) or rAAV2.5T at an MOI of 2,000 DRP/cell (D). At 3 dpt, the luciferase activities were measured. Data shown are the averaged luciferase activities relative to the Scramble cells from three replicates [mean plus standard deviation (SD)]. The red dashed line indicates 50% of the luciferase activity in Scramble HEK293 cells. P values were determined by using one-way ANOVA for the comparison of the fold changes in the KO cell groups and the Scramble cell control.
Figure 3.
Figure 3.. SLC35A1 KO significantly decreases SIA expression in HEK293SLC35A1-KO cells.
(A-F) Lectin staining. Biotinylated Sambucus Nigra lectin (SNA) and Maackia Amurensis lectin II (MAL II) lectins were used to stain glycan expression in HEK293SLC35A1-KO cells. NA-treated cells served as a positive control to show the removal of sialic acids. (A&B) Confocal microscopy. SNA (A) and MAL II (B) stained cells were incubated with DyLight 649-conjugated streptavidin for visualization at 100 × under a confocal microscope (Leica SP8 STED). (C&D) Flow cytometry. (C) SNA and (D) MAL II stained cells were incubated with FITC-conjugated streptavidin for flow cytometry. The histograms show the intensity of the FITC staining on the x-axis and the number of cells at each intensity level on the y-axis. The mean fluorescence intensity (MFI) values were calculated, normalized to the wild-type (WT) HEK293 cells as percentages (%), and are shown with a mean and SD from three replicates. P values were determined by using the Student’s t-test. (E-G) rAAV5 vector transduction, binding, and internalization in HEK293 cells. Relative percentages of vector binding (E), internalization (F), and transduction (G) to the Scramble cell group are calculated in rAAV-transduced SLC35A1-KO or NA-treated scramble HEK293 cells. The data shown were a mean and SD from three replicates. P values were determined by using one-way ANOVA for the comparison of the vector value in the KO or NA-treated cell group and the scramble cell group.
Figure 4.
Figure 4.. SIA expression in HAE-ALI cultures differentiated from SLC35A1 KO cells.
(A&B) Confocal microscopy. SNA (A) and MALII (B) lectins were used to stain glycan expression in HAE-ALISLC35A1-KO cultures. NA-treated cultures served as a positive control to show the removal of sialic acids. DyLight 649-conjugated streptavidin was used to visualize the staining under a confocal microscope at × 60 (CSU-W1 SoRa). (C&D) Flow cytometry of lection-stained cells dissociated from ALI cultures. (C) biotinylated SNA and (D) MAL II lectins were used to stain the cell surface, followed by FITC-conjugated streptavidin for detection. The histograms show the intensity of the FITC staining on the x-axis and the number of cells at each intensity level on the y-axis. The mean fluorescence intensity (MFI) values were calculated, normalized to the WT HEK293 cells. And the percentages (%) are shown with a mean and SD from three replicates. P values as indicated were determined by using the Student’s t-test.
Figure 5.
Figure 5.. SLC35A1 KO leads to a larger decrease in transduction efficiency than that of vector binding and entry of rAAV5 or rAAV2.5T in polarized HAE-ALI cultures.
(A-C) rAAV5 vector binding, internalization, transduction in HAE-ALISLC35A1-KO cultures. HAE-ALI Scramble, SLC35A1 KO or NA-treated scramble cultures were apically transduced with rAAV5 at an MOI of 20,000 DRP/cell. At 2 hpt, vector binding and internalization assays were carried out, and at 5 dpt, the luciferase activities were measured. Relative percentage of binding (A), internalization (B) or transduction efficiency (C) of the transduced KO and NA-treated cultures to the Scramble cell group are shown. (D-F) rAAV2.5T vector transduction, binding, and internalization in HAE-ALISLC35A1-KO cultures. The ALI cultures as indicated were transduced with rAAV2.5T at an MOI of 20,000 DRP/cell. Relative percentages of vector binding (D), internalization (E), and transduction efficiency (F) of the transduced KO and NA-treated cell cultures to the Scramble cell group are shown. All repeated data are shown with a mean and SD of at least three replicates. P values as indicated were determined by using one-way ANOVA for the comparison of the vector value in the KO or NA-treated cell group with the Scramble cell group.
Figure 6.
Figure 6.. SLC35A1 KO significantly decreases the transduction efficiency of rAAV1–8, 12 and 13, but increases the transduction efficiency of rAAV9 and rAAV11, and causes a significant decrease in the nuclear import of rAAV.
(A) Luciferase activities. HEK293Scramble and HEK293SLC35A1-KO cells were respectively transduced with various serotypes of rAAV vectors as indicated at an MOI of 20,000 DRP/cell. At 3 dpt, the luciferase activities were measured and normalized to Scramble cells (set as 1). The fold changes of luciferase activities in SLC35A1-KO vs Scramble are shown with means and an SD from at least three replicates. (B&C) Lectin staining. HEK293Scramble and HEK293SLC35A1-KO cells were respectively stained with Erythrina cristagalli lectin (ECL) for analyses by confocal microscopy (B) and by flow cytometry (C). The mean fluorescence intensity (MFI) values were calculated and normalized to the Scramble cells as percentages (%), which are shown with a mean and SD from three replicates, and were analyzed by the Student’s t-test. (D-F) rAAV binding, internalization, transduction. HEK293Scramble and HEK293SLC35A1-KO cells were respectively transduced with four selected representative vectors, rAAV5, rAAV2, rAAV6, and rAAV9, in parallel. Vector binding (D), Internalization (E), and transduction (F) are assessed and relative fold changes in SLC35A1-KO vs Scramble as percentages (%) are shown with a mean and SD from at least three replicates. (G) Nuclear import assays. HEK293Scramble and HEK293SLC35A1-KO cells were respectively transduced with four selected representative vectors, rAAV5, rAAV2, rAAV6, and rAAV9, in parallel. At 12 hpt, the cytoplasm and nucleus were fractionated, and the percentage of vector genome copies in the cytoplasm and nucleus fractions were quantified. The data shown are means with an SD from at least three replicates. P value was determined by using the Student t-test for the comparison of the vector genome copies in the nucleus between the KO cell group and the Scramble cell group.
Figure 7.
Figure 7.. SLC35A1 and AAV capsid are colocalized with TGN46.
(A&B) HEK293 cells. SLC35A1-KO or Scramble HEK293 cells were transduced with (A) rAAV5 at MOI of 20,000 or (B) rAAV2.5T at MOI of 2,000. At 8 hpt, the cells were fixed and permeabilized, followed by immunostaining with the first antibody against indicated protein and fluorescence-conjugated secondary antibodies. (C) HAE-ALI cultures. The HAE-ALI cultures differentiated from SLC35A1-KO or Scramble CuFi-8 cells were transduced with rAAV2.5T at MOI of 20,000. At 3 dpt, the cells were fixed and permeabilized, followed by immunostaining with the first antibody against indicated protein and fluorescence-conjugated secondary antibodies. The stained cells were imaged under a confocal microscope (CSU-W1 SoRa, Nikon) at 60× with 4×SoRa magnitude (scale bar = 20 μm).
Figure 8.
Figure 8.. Expression of SLC35A1 wild-type (WT) and T128A mutant restores rAAV5 transduction and nuclear import, but not the ΔC Tail mutant in HEK293SLC35A1 cells.
HEK293SLC35A1-KO cells were transduced with lentiviral vector that expressed SLC35A1 WT, T128A and ΔC Tail, as indicated, or untransduced (Mock), followed by selection of blasticidin (at 10 μg/ml) for a week. The blasticidin-resistant cells were transduced with rAAV5 at an MOI of 20,000. HEK293Scramble cells were used as a control. (A) rAAV transduction efficiency. At 3 dpt, luciferase activities were measured and normalized to the Scramble (set as 1.0). Data shown are means with an SD from three replicates. P values were determined by using one-way ANOVA for the comparison of the fold changes in the SLC35A1 KO cell groups and the Scramble cell control. (B) rAAV genome distribution. After 12 hpt, nuclear and the cytoplasmic fractions of the rAAV5-transduced were fractionationed, and the vector genomes in each fraction were quantified by qPCR. The percentage of viral genome in each fraction shown are means with an SD of three replicates. P values were determined by using one-way ANOVA for the comparison of the vector genome copies in the nucleus between the SLC35A1 KO cell groups and the Scramble cell control. (C-F) Flow cytometry of lectin staining. The cells were stained with biotinylated SNA (C&D) or MALII (E&F) lectin and FITC-conjugated streptavidin, followed by flow cytometry. The mean fluorescence intensity (MFI) values were calculated, normalized to the WT HEK293 cells as percentages (%), and shown as means with an SD from at least three replicates. P values were determined by using one-way ANOVA for the comparison of the fold changes in the SLC35A1 KO cell groups and the Scramble cell control.
Figure 9.
Figure 9.. A model of SLC35A1 function in rAAV transduction.
AAV cell entry is initiated by interacting with specific glycan on the cell surface (primary attachment receptor) (15,16,18,19,21,23) and a proteinaceous receptor, e.g., AAVR (KIAA0319L) (26,28). Several intracellular trafficking pathways have been proposed based on AAV2 studies. Post endocytosis or internalization, AAV traffics through Rab7+ late endosomes, Rab11+ recycling endosomes (64), and the STX5+ endocytic vesicle (65), to the TGN (–68), where GPR108 localized (35), as well as SLC35A1. We hypothesize that SLC35A1, which transports CMP-SIA from the cytosol into the Golgi apparatus lumen (41), mediates AAV transport from the cytosol into lumen of the Golgi apparatus in a GPR108-dependent (AAV2-type) or independent (AAV5-type) manner AAVs, which likely facilitates vector nuclear import. Then, AAV traffics through the Golgi apparatus to the nuclear membrane and enters the nucleus through the nuclear pore (NP), or routes to a nonproductive pathway, e.g., proteasome, for degradation (not shown). In the nucleus, AAV releases the ssDNA genome, which is converted to dsDNA intermediates (1). The dsDNA further undergoes intra/intermolecular recombination of the inverted terminal repeats (ITRs) to form either linear or circular episomes that are transcribed to produce mRNA. Created in BioRender.

Similar articles

References

    1. Wang D., Tai P. W. L., and Gao G.. 2019. Adeno-associated virus vector as a platform for gene therapy delivery. Nat.Rev.Drug Discov. 18:358–378. - PMC - PubMed
    1. Wang J. H., Gessler D. J., Zhan W., Gallagher T. L., and Gao G.. 2024. Adeno-associated virus as a delivery vector for gene therapy of human diseases. Signal.Transduct.Target Ther. 9:78–01780. - PMC - PubMed
    1. Weng C. Y. 2019. Bilateral Subretinal Voretigene Neparvovec-rzyl (Luxturna) Gene Therapy. Ophthalmol.Retina. 3:450. - PubMed
    1. Byrne B. J., Elder M., Leon-Astudillo C., and Corti M.. 2022. Secondary hemophagocytic lymphohistiocytosis following Zolgensma therapy: An evolving story on the innate response to systemic gene therapy. Mol.Ther. 30:3503–3504. - PMC - PubMed
    1. Jordan B. 2023. [A long-awaited - but prohibitively expensive - therapy]. Med.Sci.(Paris). 39:187–190. - PubMed

Publication types