[Preprint]. 2024 Oct 17:2024.10.14.617411.
doi: 10.1101/2024.10.14.617411.

Expanding and improving analyses of nucleotide recoding RNA-seq experiments with the EZbakR suite

Affiliations

Expanding and improving analyses of nucleotide recoding RNA-seq experiments with the EZbakR suite

Isaac W Vock et al. bioRxiv. .

Update in

Abstract

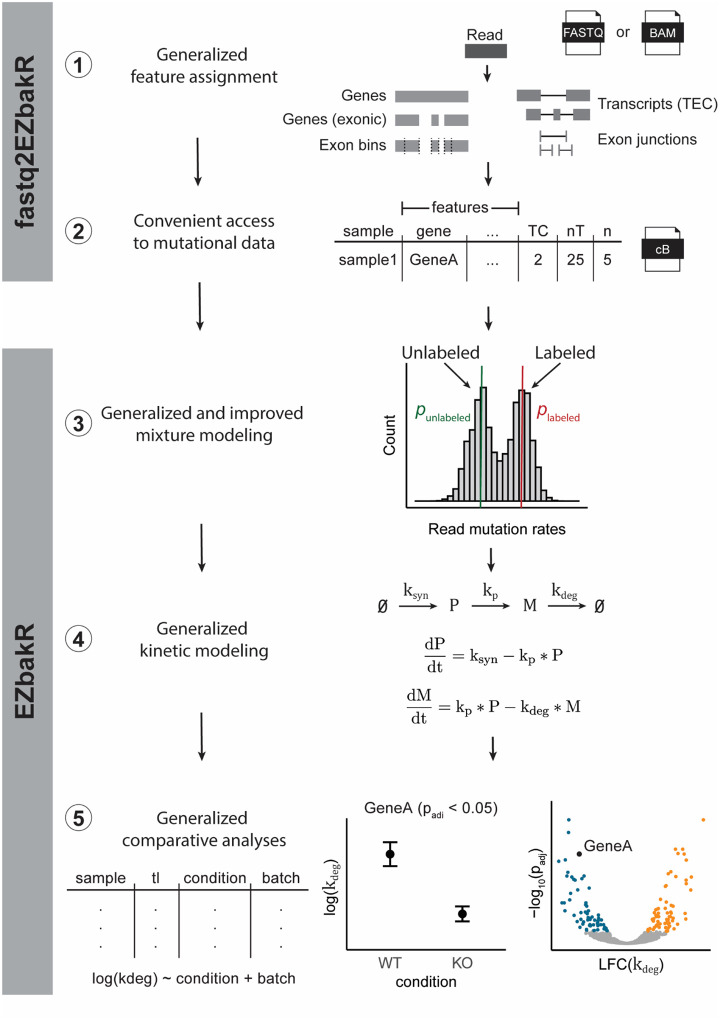
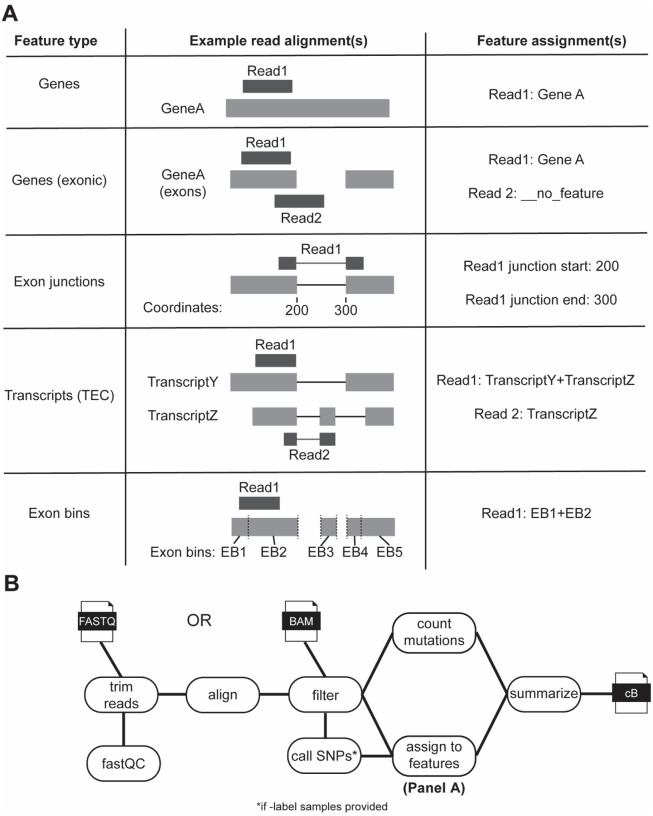
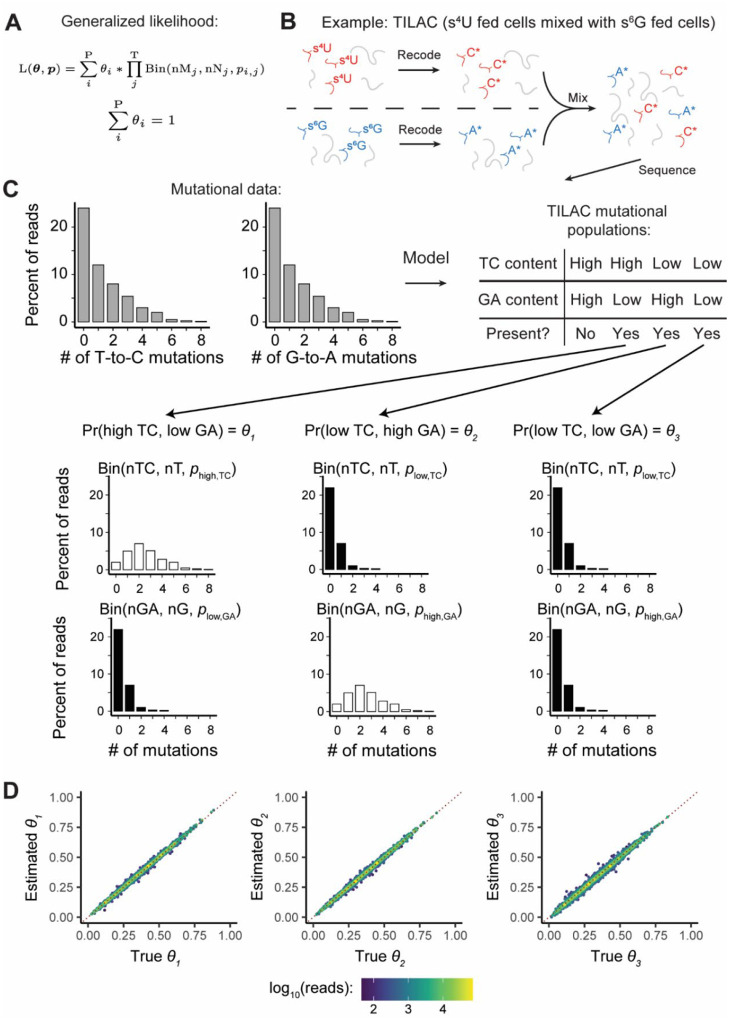
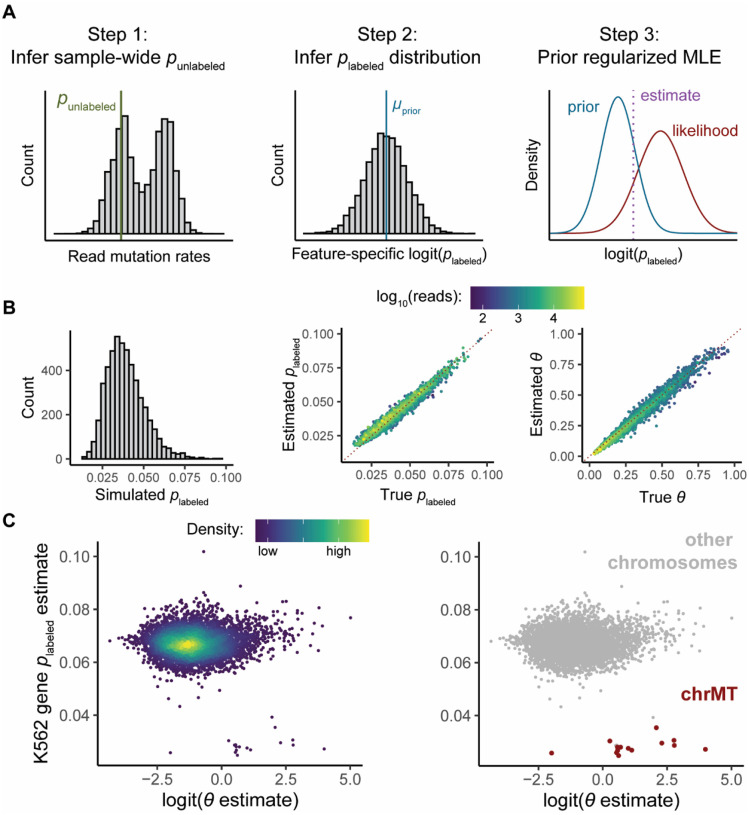
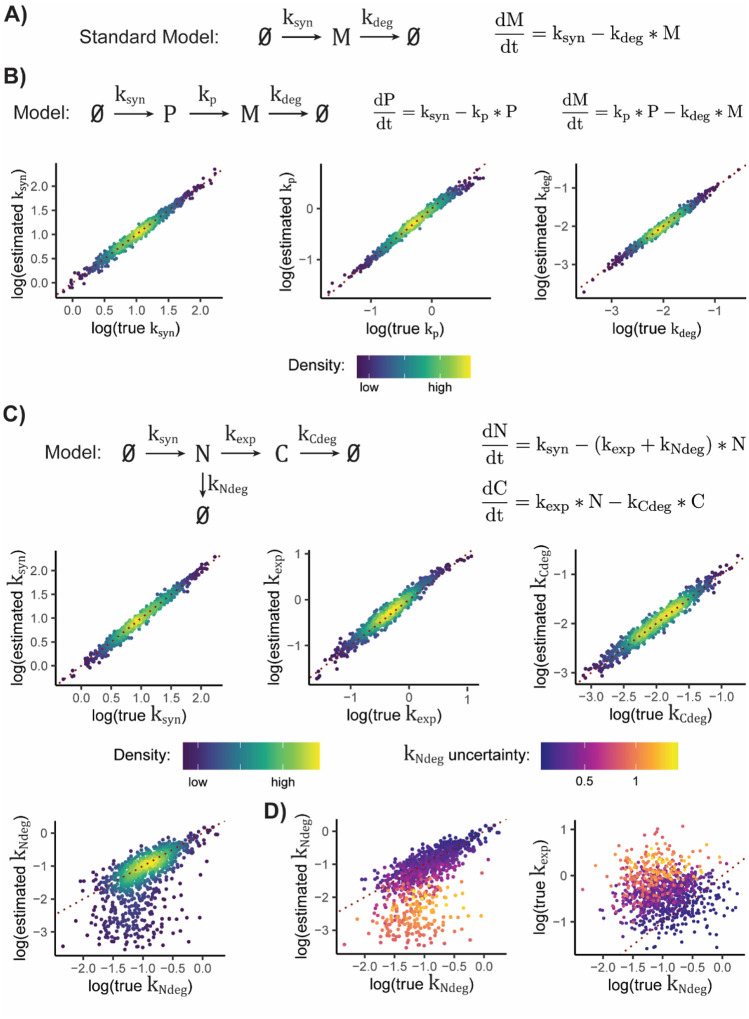
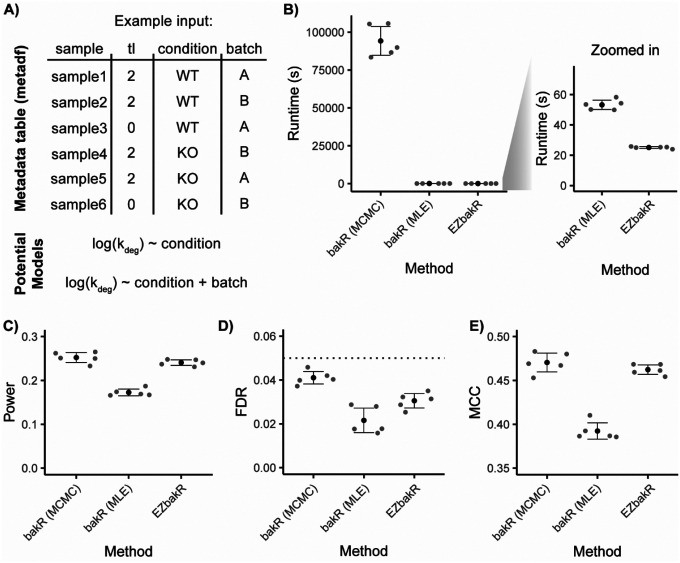
Nucleotide recoding RNA sequencing methods (NR-seq; TimeLapse-seq, SLAM-seq, TUC-seq, etc.) are powerful approaches for assaying transcript population dynamics. In addition, these methods have been extended to probe a host of regulated steps in the RNA life cycle. Current bioinformatic tools significantly constrain analyses of NR-seq data. To address this limitation, we developed EZbakR, an R package to facilitate a more comprehensive set of NR-seq analyses, and fastq2EZbakR, a Snakemake pipeline for flexible preprocessing of NR-seq datasets, collectively referred to as the EZbakR suite. Together, these tools generalize many aspects of the NR-seq analysis workflow. The fastq2EZbakR pipeline can assign reads to a diverse set of genomic features (e.g., genes, exons, splice junctions, etc.), and EZbakR can perform analyses on any combination of these features. EZbakR extends standard NR-seq mutational modeling to support multi-label analyses (e.g., s4U and s6G dual labeling), and implements an improved hierarchical model to better account for transcript-to-transcript variance in metabolic label incorporation. EZbakR also generalizes dynamical systems modeling of NR-seq data to support analyses of premature mRNA processing and flow between subcellular compartments. Finally, EZbakR implements flexible and well-powered comparative analyses of all estimated parameters via design matrix-specified generalized linear modeling. The EZbakR suite will thus allow researchers to make full, effective use of NR-seq data.


Figures

Figure 1:
Figure 1:
The EZbakR suite generalizes and improves upon all steps of the NR-seq analysis pipeline. The EZbakR suite: 1) Implements a flexible feature assignment strategy, 2) provides processed mutational data in a convenient, compressed format, 3) analyzes mutational data in a way that supports multi-label design and allows for feature-to-feature mutation rate variance, 4) fits any identifiable, linear dynamical systems model to NR-seq data, and 5) performs well-powered, design matrix-specified comparative analyses of all estimated kinetic parameters.
Figure 2:
Figure 2:
fastq2EZbakR generalizes feature assignment to support finer dissection of NR-seq data. A) Schematic of the 5 different feature assignment strategies implemented in fastq2EZbakR. If a read does not overlap with a given feature, it will be assigned a value of __no_feature for that assignment. If a read overlaps multiple features, all features will be reported, with names separated by +-signs. TEC = transcript equivalence class (set of transcript isoforms with which a read is compatible). Exon bins were introduced in DEXSeq (Anders et al., 2014). B) Schematic of the full fastq2EZbakR pipeline.
Figure 3:
Figure 3:
EZbakR generalizes NR-seq mixture modeling to support multi-label analyses. A) Generalized mixture model likelihood. P = number of distinct mutational populations (e.g., high T-to-C and low G-to-A mutation rate). T = number of mutation types being analyzed (e.g., T-to-C and G-to-A). nM = number of mutations of a particular type in a given read. nN = number of mutable nucleotides of a given type in a given read. B) Example of a dual-label NR-seq experimental method: TILAC. In this experiment, s4U fed cells are mixed with s6G fed cells. C) Schematic for how generalized mixture modeling works in the setting of TILAC. In TILAC, there are no dually labeled reads, so the high T-to-C and high G-to-A population does not exist (see mutational populations table). D) Analyses of simulated TILAC data. θ1 = fraction s4U labeled; θ2 = fraction s6G labeled; θ3 = fraction unlabeled. X-axis is simulated ground truth. Y-axis is estimated value. Red dotted line is perfectly accurate estimation.
Figure 4:
Figure 4:
EZbakR’s hierarchical NR-seq mixture modeling accounts for plabeled variation. A) Schematic of hierarchical modeling strategy to infer a plabeled for each feature (i.e., feature-specific plabeled). Strategy is designed to strongly regularize feature-specific plabeled estimates to reduce estimate variance. See Methods for details. B) Analyses of simulated data. Left: distribution of simulated feature-specific plabeled. Middle: assessment of feature-specific plabeled estimate accuracy. Right: Assessment of fraction labeled (θ) estimate accuracy. In Middle and Right plots, red, dotted line represents perfect estimation. Points are colored by simulated read count. C) Estimated feature-specific plabeled (Y-axis) as a function of the estimated fraction labeled (on a logit-scale; X-axis) from analysis of TimeLapse-seq data from K562 cells (Ietswaart et al., 2024). Left: points colored by density. Right: points colored by whether RNA originated from the mitochondrial chromosome (chrMT).
Figure 5:
Figure 5:
EZbakR generalizes kinetic modeling of NR-seq data. A) Model assumed when performing standard analysis of mature mRNA synthesis and degradation. B) Analysis of simulated data for model of pre-mRNA maturation. P = premature mRNA; M = mature mRNA. Scatter plots show comparison of true simulated parameter values to those estimated by EZbakR, for all three kinetic parameters in said model. Red dotted line represents perfect estimation. C) Analysis of simulated data for model of nuclear-to-cytoplasmic trafficking of RNA. N = nuclear RNA. C = cytoplasmic RNA. Red dotted line represents perfect estimation. D) Left: Nuclear degradation rate constant accuracy scatterplot from C, colored by model’s uncertainty in rate constant estimate. Right: comparison of the true nuclear degradation and export rate constants, colored by model’s uncertainty in nuclear degradation rate constant. Red dotted line represents equal nuclear degradation and export kinetics. Estimating kNdeg is expected to get harder the further points are from this line, for reasons discussed in Supplemental Methods.
Figure 6:
Figure 6:
EZbakR improves and generalizes performing comparative analyses with NR-seq. A) Input to linear model of kinetic parameters in EZbakR. Includes metadata for each sample analyzed and a model relating a given kinetic parameter to factors included in metadata. Any identifiable model can be specified and fit. This approach allows for simple multi-condition comparisons (top potential model) or more complicated analysis designs (e.g., batch effect modeling; bottom potential model) B) Comparison of runtimes between two bakR implementations (Markov Chain Monte Carlo (MCMC) and Maximum Likelihood Estimation (MLE)) and EZbakR. C-E) Analysis of simulated data originally presented in Vock and Simon 2022. C) Comparison of statistical power (number of true positives / number simulated positives) between bakR implementations and EZbakR. D) Comparison of false discovery rates (FDRs; number of false positives / number of positives) between bakR implementations and EZbakR. E) Comparison of Matthew’s correlation coefficients (MCC) between bakR implementations and EZbakR.

Similar articles

References

    1. Anders S., Reyes A. and Huber W. Detecting differential usage of exons from RNA-seq data. Nature Precedings 2012:1–1. - PMC - PubMed
    1. Berg K., et al. Correcting 4sU induced quantification bias in nucleotide conversion RNA-seq data. Nucleic Acids Research 2024;52(7):e35–e35. - PMC - PubMed
    1. Bonfield J.K., et al. HTSlib: C library for reading/writing high-throughput sequencing data. Gigascience 2021;10(2):giab007. - PMC - PubMed
    1. Cao J., et al. Sci-fate characterizes the dynamics of gene expression in single cells. Nature Biotechnology 2020;38(8):980–988. - PMC - PubMed
    1. Chen S., et al. fastp: an ultra-fast all-in-one FASTQ preprocessor. Bioinformatics 2018;34(17):i884–i890. - PMC - PubMed

Publication types

LinkOut - more resources