[Preprint]. 2024 Oct 19:2024.10.18.619132.
doi: 10.1101/2024.10.18.619132.

Non-lytic spread of poliovirus requires the nonstructural protein 3CD

Affiliations

Non-lytic spread of poliovirus requires the nonstructural protein 3CD

David Aponte-Diaz et al. bioRxiv. .

Update in

Abstract

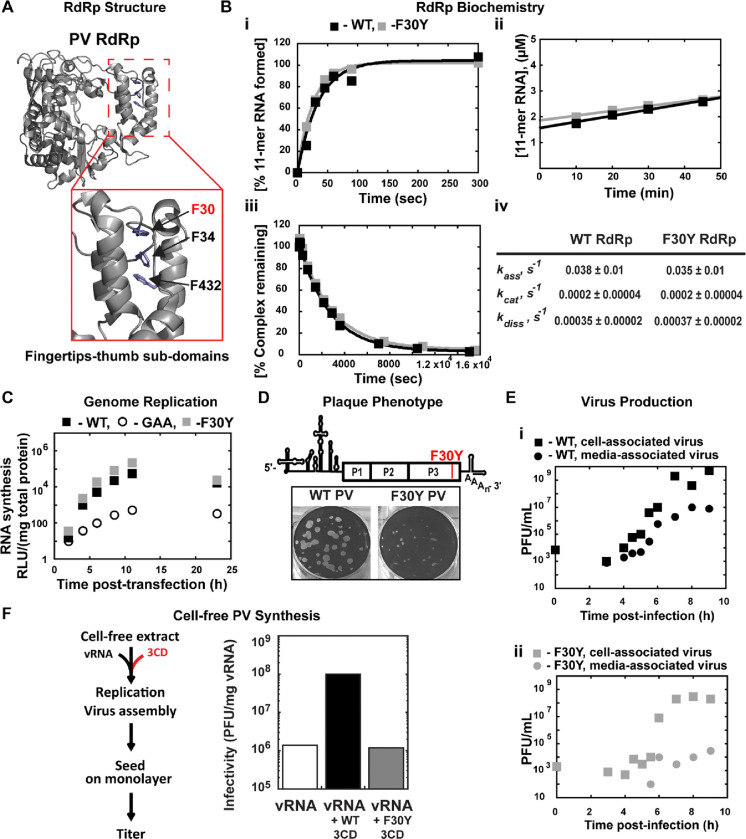
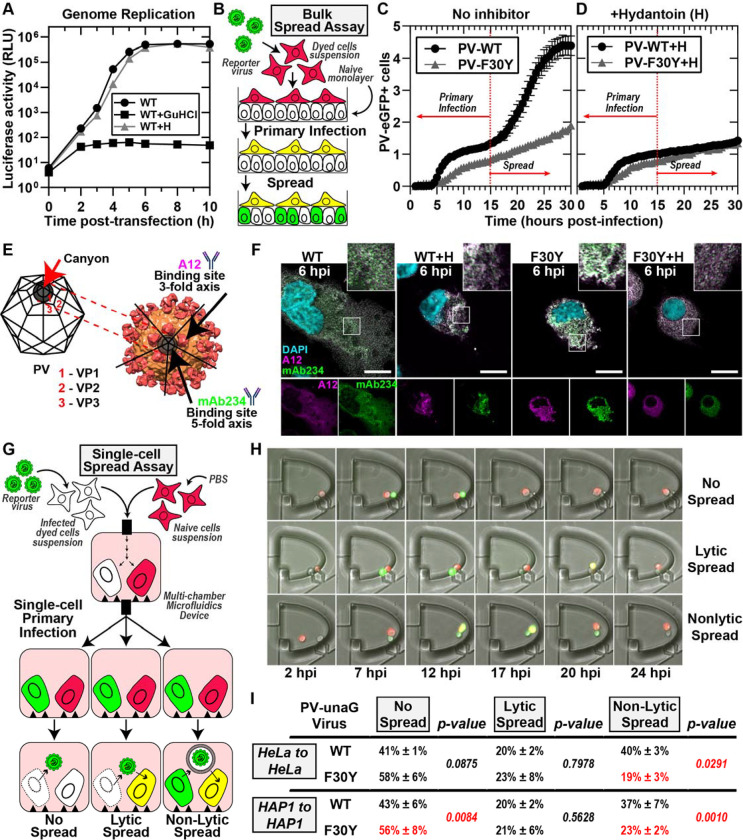
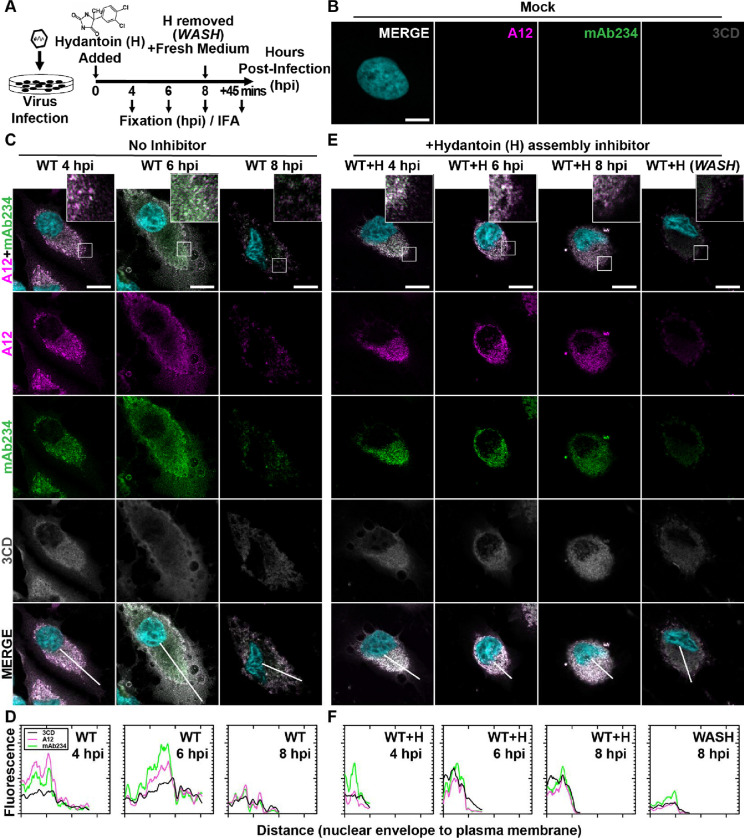
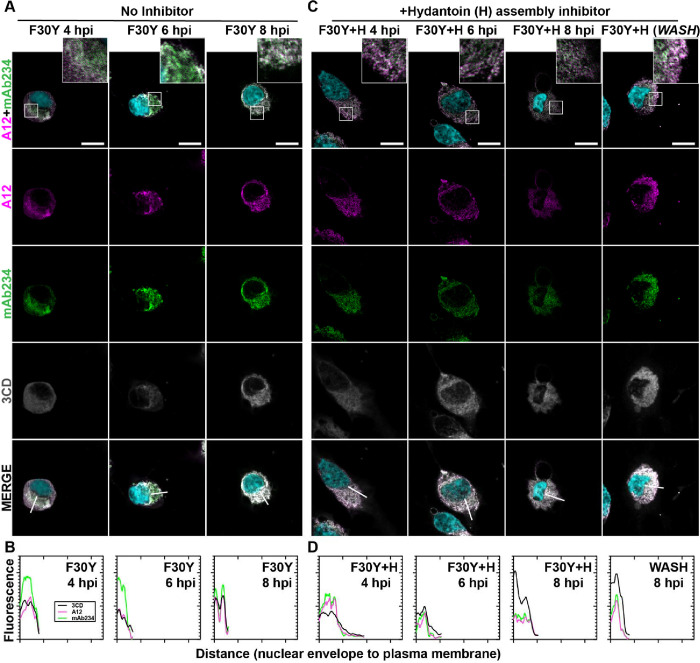
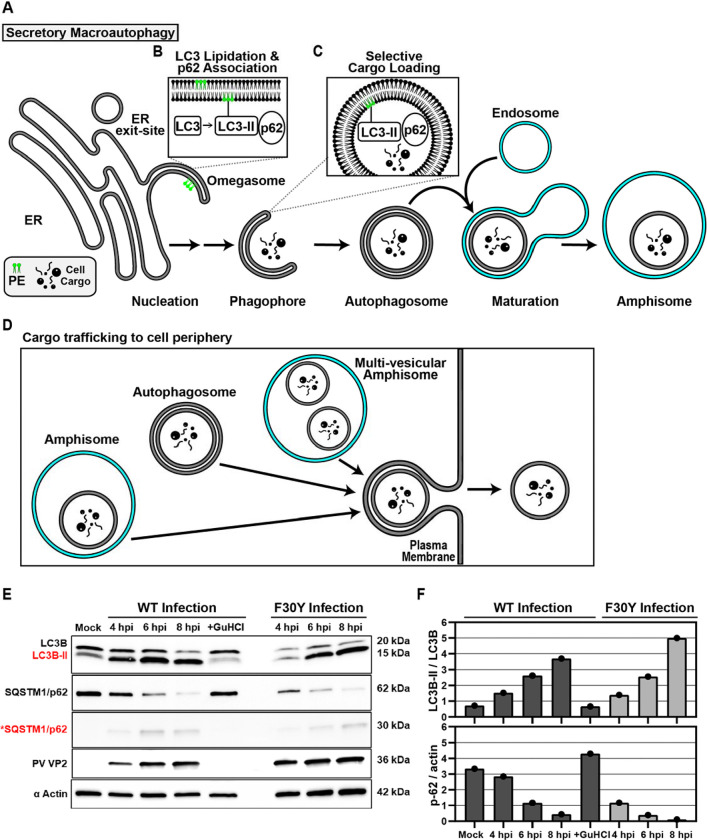
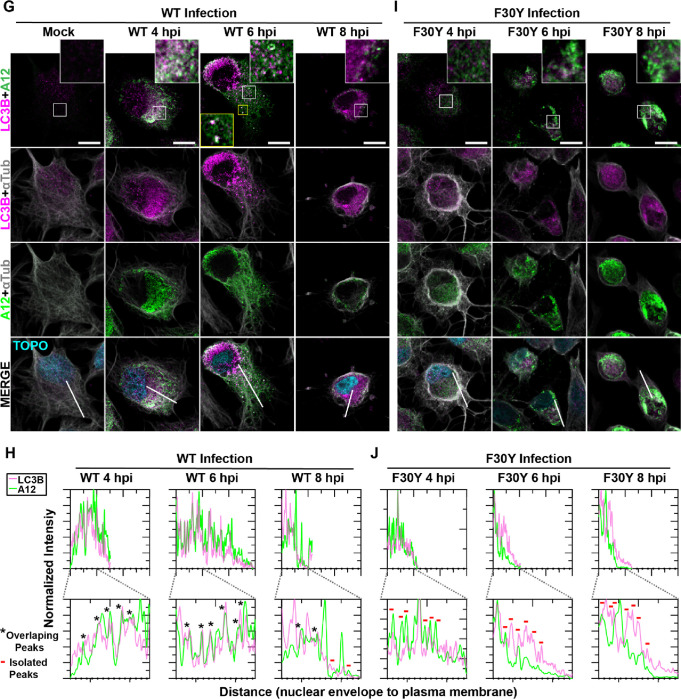
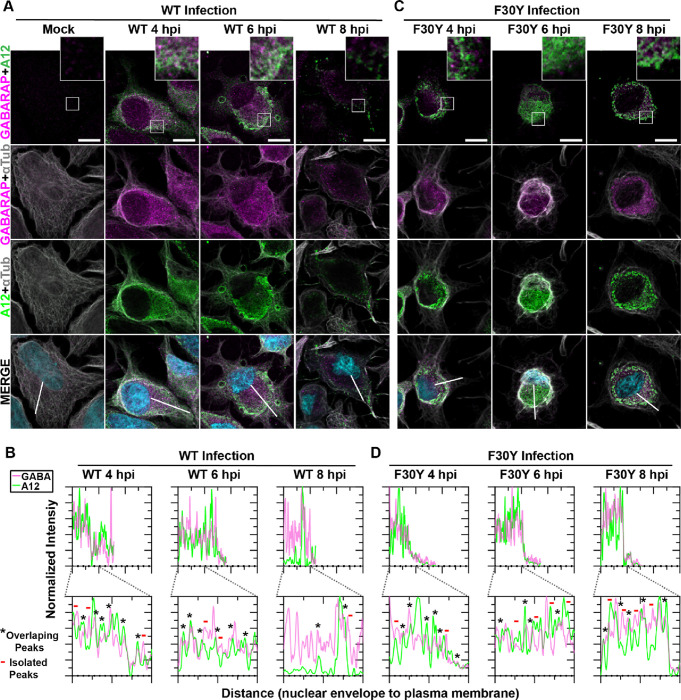
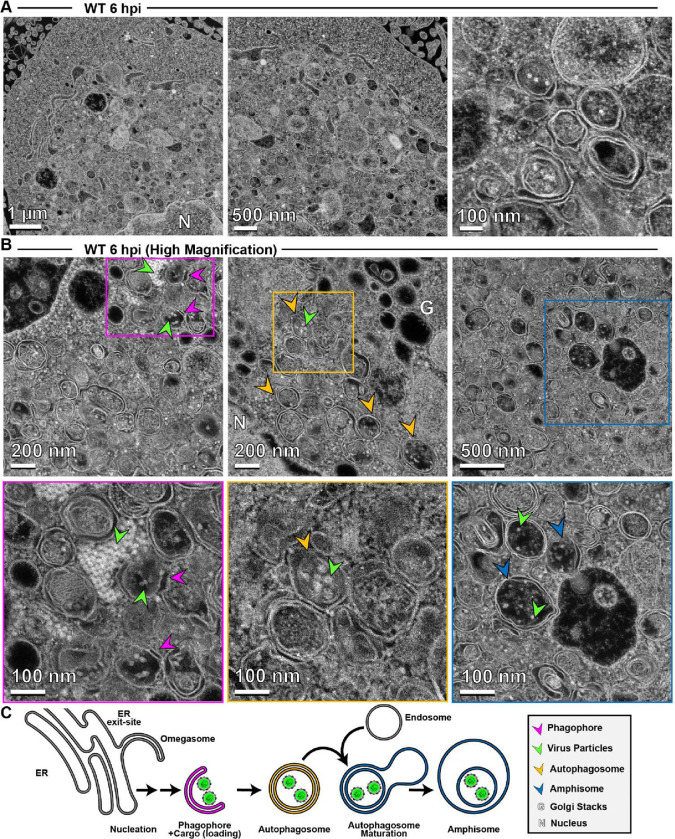
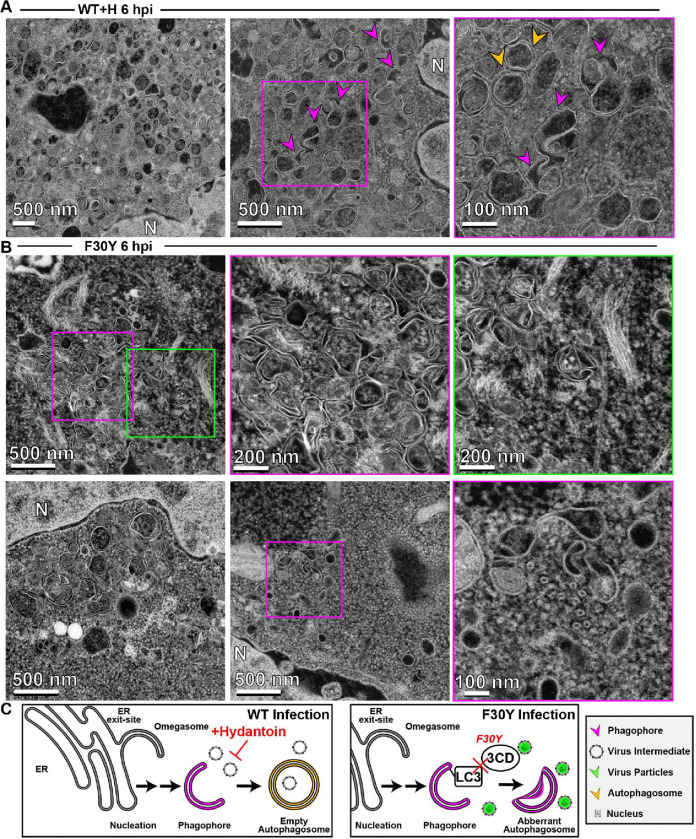
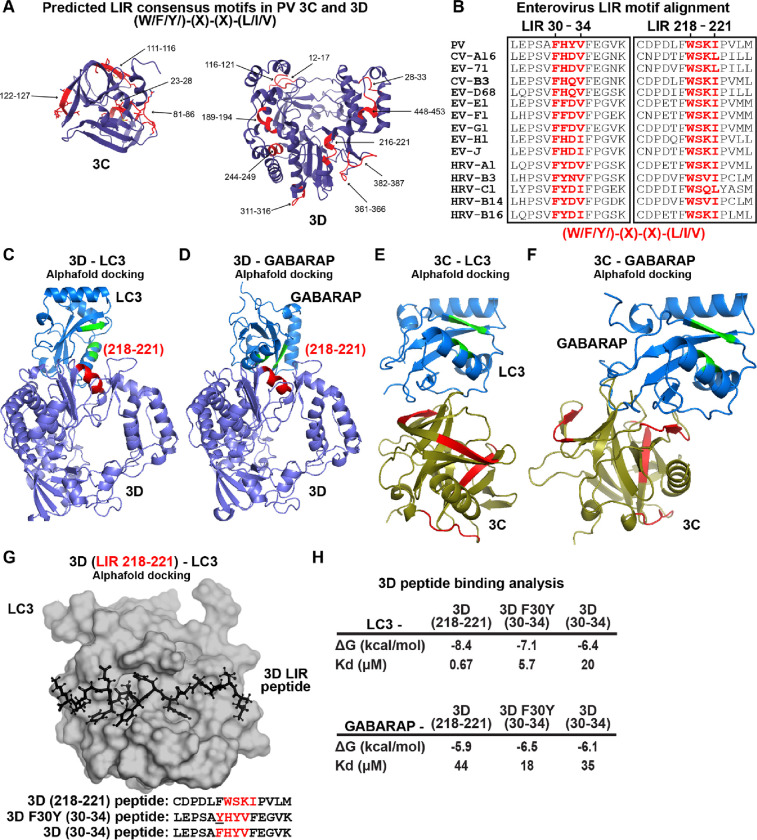
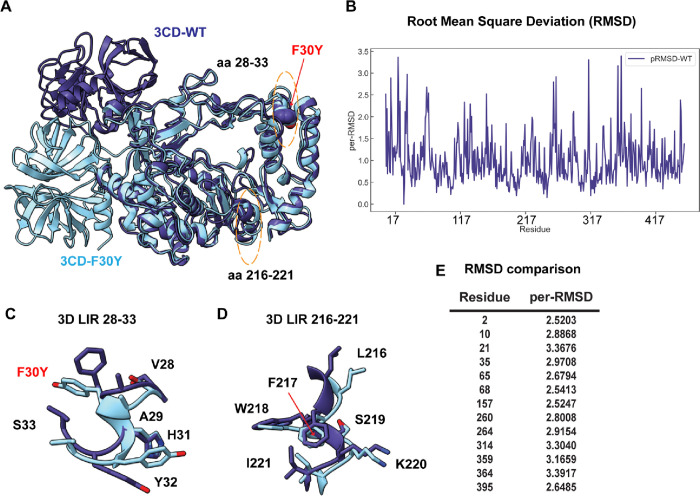
Non-enveloped viruses like poliovirus (PV) have evolved the capacity to spread by non-lytic mechanisms. For PV, this mechanism exploits the host secretory autophagy pathway. Virions are selectively incorporated into autophagosomes, double-membrane vesicles that travel to the plasma membrane, fuse, and release single-membrane vesicles containing virions. Loading of cellular cargo into autophagosomes relies on direct or indirect interactions with microtubule-associated protein 1B-light chain 3 (LC3) that are mediated by motifs referred to as LC3-interaction regions (LIRs). We have identified a PV mutant with a severe defect in non-lytic spread. An F-to-Y substitution in a putative LIR of the nonstructural protein 3CD prevented virion incorporation into LC3-positive autophagosomes and virion trafficking to the plasma membrane for release. Using high-angle annular dark-field scanning transmission electron microscopy to monitor PV-induced autophagosome biogenesis, for the first time, we show that virus-induced autophagic signals yield normal autophagosomes, even in the absence of virions. The F-to-Y derivative of PV 3CD was unable to support normal autophagosome biogenesis. Together, these studies make a compelling case for a direct role of a viral nonstructural protein in the formation and loading of the vesicular carriers used for non-lytic spread that may depend on the proper structure, accessibility, and/or dynamics of its LIR. The studies of PV 3CD protein reported here will hopefully provoke a more deliberate look at the presence and function of LIR motifs in viral proteins of viruses known to use autophagy as the basis for non-lytic spread.


Figures

Figure 1.
Figure 1.. A post-genome-replication function for PV 3CD protein
(A) PV 3D RdRp structure. The PV 3D RdRp structure is depicted as a gray ribbon; the structure adopts a canonical right-hand shape with fingers, palm, and thumb subdomains. The red box inset shows a close-up view of the fingertips-thumb subdomain interaction. Residues F30, F34 (fingertips), and F432 (thumb) are highlighted in blue to show the phenylalanine “stacking” interaction that occurs between the fingertips and thumb subdomains. The image was created using the WebLab Viewer (Molecular Simulations Ins., San Diego, CA) program (PDB access code 1RA6). (B) PV 3D F30Y biochemical properties. (i) Complex assembly kinetics. Shown are the kinetics of RNA product formation over time. Solid lines represent the best fit of the data to a single exponential with assembly rates (kass) of 0.038 ± 0.01 s-1 (WT) and 0.035 ± 0.01 s-1 (F30Y). (ii) Active site titration. Shown are the kinetics of RNA product formation over time. The data fit best to a straight line with y-intercepts representing concentrations of the active enzyme with 1.6 μM for WT and 1.8 μM for F30Y, corresponding to 80 and 90% of the total enzyme being “active,” respectively. The steady-state rate of AMP incorporation (kcat) was 0.0002 ± 0.00004 s-1 for both WT and F30Y. (iii) Complex dissociation kinetics. Shown are the kinetics of RdRp-primed-template complex dissociation over time. The solid lines represent the best fit of the data to a single exponential with dissociation rates (kdiss) of 0.00035 ± 0.00002 s-1 (WT) and 0.00037 ± 0.00002 s-1 (F30Y). (iv) WT and F30Y PV RdRp kinetic parameters. Table summarizing the kinetic parameters for WT and F30Y PV RdRp. (C) Genome replication. Sub-genomic replicon luciferase assay comparing WT and F30Y. Luciferase is measured as a surrogate for genome replication using a relative light unit (RLU) normalized to protein content (μg) from an absorbance measure of the collected lysates at the shown time points. In this assay, an inactive polymerase variant GAA PV controlled for translation and RNA stability during inhibited RNA synthesis. (D) Plaque Phenotype. A schematic PV genome schematic is shown, highlighting the F30Y mutation placement. Comparison of 50 PFU of WT and F30Y PV. The number of PFUs observed for WT and F30Y PV was essentially the same. However, the F30Y virus produced plaques of smaller size. (E) Virus Production. One-step growth curve comparing media-associated (supernatant) and cell-associated (cells) virus collected from WT and F30Y PV infections. Titers were quantified by plaque assay. (i) WT PV virus titers shown. (ii) F30Y PV virus titers shown. (F) Cell-free PV Synthesis. Schematic depicting the cell-free extract assay used to detect assembly stimulation in the context of exogenous viral protein supplementation. The graph shows the cell-free synthesis of PV in the presence of WT and F30Y purified 3CD. Titers were quantified by plaque assay and normalized to the amount of vRNA.
Figure 2.
Figure 2.. PV 3CD contributes to virion morphogenesis and non-lytic spread
(A) PV genome replication in the presence of GuHCl and hydantoin. PV sub-genomic replicon luciferase assay. HeLa cells were transfected with a WT PV replicon. in the presence and absence of 3mM GuHCl or 50 μg/mL hydantoin. Luciferase activity was measured as a surrogate for genome replication by relative light unit (RLU) from the collected lysates at the stated times/conditions. (B) Bulk spread assay schematic. HeLa cells in suspension were stained using a membrane dye and infected with a green fluorescence PVeGFPpv reporter variant. MOI of 5-infected dyed cells (red) were washed and seeded on top of a naïve HeLa cell monolayer. Fluorescence is monitored over time to detect both primary and secondary infections. Primary infected cells were observed and depicted in yellow when green (eGFP expression) and red signal (cell dye) colocalized. Spread was detected when a secondary wave of PV green fluorescence signal (green only) originating from the newly infected monolayer of unstained cells was observed. (C) PV eGFPpv and F30Y PV eGFPpv bulk spread. The graph depicts the number of eGFP-positive cells in a bulk spread assay performed as described in panel (B). Using WT virus, the initial infection led to a spread event that increased the number of eGFP-positive cells (originating from secondary infections) observed after 15 hpi when the naive monolayer expressed eGFP signal (spread). F30Y PV eGFPpv inhibited spread, as observed from a lack of a secondary wave eGFP signal. The data was normalized for the respective WT and F30Y eGFP infectivities. (D) Bulk spread assay assessing the impact of hydantoin on PV spread. The graph depicts the number of eGFP-positive cells in a bulk spread assay performed in the presence of 50 μg/mL hydantoin. (E) PV structure and A12/mAb234 antibody illustrations. WT PV icosahedron (left) and structure (right) illustrations indicate A12 and mAb234 antibodies-specific binding. A12 binds at the denoted 3-fold axis at the intersection of VP1, VP2, and VP3. MAb234 binds at the 5-fold axis where the canonical “canyon” is located. (F) Confocal immunofluorescence imaging of A12 and MAb234 in PV-infected HeLa cells. Images illustrate representative immunofluorescence image fields of WT- and F30Y-infected HeLa cells (MOI of 10) in the presence and absence of hydantoin. Cells were fixed and immunostained under the labeled conditions 6 hours post-infection (hpi). Fixed cells were immunostained using specific A12 (magenta) and mAb234 (green) antibodies. DAPI-stained nuclei are shown (cyan). The top panels show A12, mAb234, and DAPI fluorescence overlays. The bottom single panels show A12 and mAb234 fluorescence separately. (G) Single-cell spread assay schematic. Cells in suspension infected with a reporter PV-unaGpv virus variant (green). Infected cells were paired with stained uninfected cells (red) in isolated chambers of a multi-chamber microfluidics polyvinylidene fluoride (PVDF) device. In this study, this device was modified to harbor cell pairs. Fluorescence is monitored over time to detect an initial wave of infected cells expressing green fluorescence., yielding a yellow fluorescence overlay (see yellow cells). Spread was detected when a secondary wave of green fluorescence signal was observed in red-dyed cells, producing a colocalized yellow signal. Spread events were further extrapolated into no-spread, lytic spread, and non-lytic spread. In no spread, no secondary infection signal was detected after a primary cell green fluorescence signal. In lytic spread, the secondary infection signal arose after losing the primary cell green fluorescence (lysis). In non-lytic spread, the secondary infection signal was detected while green fluorescence was still present in the primary infected cell. (H) Epifluorescence imaging of single-cell pairs. Representative fluorescence images of chambers harboring cell pairs in a single-cell spread assay. The panels describe each spread scenario described in (G). (I) WT and F30Y unaGpv single cell spread assay. In this single-cell spread assay, HeLa or HAP1 cells were infected with either WT or F30YunaGpv at an MOI of 5 and paired with uninfected stained cells (red). No spread, lytic, and non-lytic events are quantified as percentages of the total number of events. The values are represented as mean ± standard error (SEM) from an n=3. Significant differences between conditions were noted based on a student’s t-test with p-values below 0.05.
Figure 3.
Figure 3.. PV 3CD comigrates with virions from the perinuclear region of the cell to the periphery
(A) PV time-course immunofluorescence assay (IFA) schematic. HeLa cell monolayer infections were carried out in the presence or absence of hydantoin. Infected cells were fixed at the stated time points (4-, 6-, or 8-) hours post-infection. An additional timepoint labeled “WASH” was collected for cells undergoing 8 hours of infection in the presence of hydantoin; the monolayer was then rinsed with PBS to remove the drug. After rinsing, fresh, warm, complete medium was added, and cells were incubated for 45 minutes before fixing. An immunostaining fluorescence assay (IFA) was then conducted on fixed cells. (B) Mock cell IFA. Representative confocal immunofluorescence images of mock HeLa cells showing no virus A12, mAb234, or 3CD protein reactivity in the absence of PV infection. Uninfected cells were fixed and immunostained 6 hours after initiating the experiment. Fixed cells were immunostained using A12 (magenta), mAb234 (green), and 3CD (grey) antibodies. The DAPI-stained nucleus is shown (cyan). Overlays of all four fluorescence signals (MERGE) are shown. (C) WT PV time-course IFA. Images illustrate representative confocal immunofluorescence fields of WT-infected HeLa cells 4-, 6- and 8- hours post-infection (hpi). HeLa cells were infected with WT PV at an MOI of 10, fixed, and immunostained at the labeled time points. Fixed cells were immunostained as described for mock cells in panel (B). The top panels show A12, mAb234, and DAPI fluorescence overlays with a perinuclear inset delineated with a white square. The bottom panels show A12, mAb234, 3CD, and DAPI fluorescence overlays (MERGE) with a white line extending from the nuclear envelope to the plasma membrane. Each column incrementally shows the hours post-infection from left to right 4-, 6-, and 8- hpi. (D) WT PV fluorescence intensity profiles. Intensity profile plots reveal the progression of A12, mAb234, and 3CD fluorescence over a WT PV infection time course. The bottom MERGE panels in (C) show a white line extending from the nuclear envelope to the plasma membrane used for “profile fluorescence” signal quantification. Intensity profile measurements were taken from regularly spaced points along a line segment to depict the spatial and temporal dynamics of fluorescence reactivity, levels, and signal overlap in infected cells over time. Values were plotted as a smooth line graph with relative fluorescence intensity units (RFU) on the Y-axis and distance (nm) on the X-axis. A12 (magenta), mAb234 (green), and 3CD (black) were plotted as independent lines in the graph. (E) WT PV time-course IFA in the presence of hydantoin. Images illustrate representative PV WT-infected HeLa cell confocal immunofluorescence fields in the presence of 50 μg/mL hydantoin (WT+H) 4-, 6-, and 8- hours post-infection (hpi) as described for WT in (C). An additional “WASH” time point indicates an infection where the hydantoin block is released at 8 hpi. (F) WT PV fluorescence intensity profiles in the presence of hydantoin. Intensity profile plots reveal the progression of A12, mAb234, and 3CD fluorescence over a WT PV infection time course in the hydantoin-inhibited state as described for WT in (D). Intensity measurements were acquired from the WT+H panels shown in (E).
Figure 4.
Figure 4.. PV 3CD contributes to virion trafficking
(A) F30Y PV time-course IFA. Images illustrate representative confocal immunofluorescence fields of F30Y PV-infected HeLa cells 4-, 6- and 8- hours post-infection (hpi). HeLa cells were infected with F30Y PV at an MOI of 10, fixed, and immunostained at the labeled time points. Fixed cells were immunostained using A12 (magenta), mAb234 (green), and 3CD (grey) antibodies. DAPI-stained nuclei are shown (cyan). The top panels show A12, mAb234, and DAPI fluorescence overlays with a perinuclear inset delineated with a white square. The bottom panels show A12, mAb234, 3CD, and DAPI fluorescence overlays (MERGE) with a white line extending from the nuclear envelope to the plasma membrane. Each column shows hours post-infection incrementally from left to right 4-, 6-, and 8- hpi. (B) F30Y PV fluorescence intensity. Intensity profile plots reveal the progression of A12, mAb234, and 3CD fluorescence over an F30Y PV infection time course. The bottom panels in (A) show A12, mAb234, 3CD, and DAPI fluorescence overlays (MERGE), with a white line extending from the nuclear envelope to the plasma membrane used for “profile fluorescence signal” quantification. Intensity profile measurements were taken from regularly spaced points along a line segment to depict the spatial and temporal dynamics of fluorescence reactivity, levels, and signal overlap in infected cells over time. Values were plotted as a smooth line graph with relative fluorescence intensity units (RFU) on the Y-axis and distance (nm) on the X-axis. A12 (magenta), mAb234 (green), and 3CD (black) were displayed as independent values in the graph. (C) F30Y PV time-course IFA in the presence of hydantoin. Images illustrate representative confocal immunofluorescence fields of F30Y PV-infected HeLa cells in the presence of 50 μg/mL hydantoin (F30Y+H) as described in (A) for F30Y PV. An additional “WASH” time point indicates an infection where the hydantoin block is released at 8 hpi. (D) F30Y PV fluorescence intensity in the presence of hydantoin. Intensity profile plots reveal the progression of A12, mAb234, and 3CD fluorescence over an F30Y PV infection time course in the hydantoin-inhibited state. as described in (B) for F30Y PV. Intensity measurements were acquired from the F30Y+H panels shown in (C).
Figure 5.
Figure 5.. PV 3CD is required for colocalization of PV virions with lipidated LC3B
(A) Autophagy pathway schematic. An ER-derived omegasome buds out and is engaged by multiple autophagy-associated proteins, adaptors, kinases, and protein complexes to yield an autophagophore in preparation for cargo loading and maturation of a double-membranous vesicle termed autophagosome. (B) Autophagosome maturation is triggered by the lipidated form of the essential microtubule-associated protein 1A/1B-light chain 3 (LC3) protein. (C) Cargo is recruited to the phagophore by combining factors, including LC3 and adaptor proteins like sequestosome (SQSTM1/p62), which promote selective cargo loading. For intact/functional cargo secretion in vesicles, the autophagosome may fuse with endosomes to form a cargo-containing amphisome. (D) Cargo-containing amphisomes, multi-vesicular amphisomes, and/or autophagosomes can then be trafficked to the plasma membrane and secreted onto the extracellular space. (E) WT and F30Y PV infection immunoblots. Images show representative immunoblots of WT and F30Y PV-infected cell lysates. Cells were infected with the indicated conditions, and lysates were collected at the displayed time points 4-, 6-, and 8- hours post-infection (hpi). Both mock and GuHCl control for infection and genome replication phenotypes, respectively. Lysates were then subject to western blot analysis and probed with LC3B, SQSTM1/p62, PV VP2, and α actin antibodies. (F) LC3B lipidation and SQSTM1/p62 cleavage quantification. WT and F30Y PV infection immunoblot quantification of LC3B and SQSTM1/p62 chemiluminescence signals. The ratio of lipidated- LC3B protein (LC3B-II) to LC3B protein increases while the full-length SQSTM1/p62 protein levels decrease as the infection progresses in WT and F30Y PV-infected HeLa cells. (G) WT PV time course – LC3B IFA. Images illustrate representative confocal immunofluorescence fields of WT-infected HeLa cells 4-, 6- and 8 hours post-infection (hpi). HeLa cells were infected with WT PV at an MOI of 10, fixed, and immunostained at the labeled time points. Fixed cells were immunostained using LC3B (magenta), A12 (green), and αTubulin (grey) antibodies. TOPO-stained nuclei are shown (cyan). The top panels show LC3B and A12 fluorescence overlay with a perinuclear inset delineated with a white square and a cytoplasmic inset in yellow. The bottom panels show LC3B, A12, αTubulin, and TOPO fluorescence overlays (MERGE) with a white line extending from the nuclear envelope to the plasma membrane of cells. Each column incrementally shows the hours post-infection from left to right mock, 4-, 6-, and 8- hpi. (H) WT PV fluorescence intensity profiles. Intensity profile plots reveal the progression of LC3B and A12 fluorescence in WT PV-infected cells over time. The bottom panels in (G) show LC3B, A12, αTubulin, and TOPO fluorescence overlays (MERGE), with a white line extending from the nuclear envelope to the plasma membrane used for “profile” fluorescence signal quantification. Intensity profile measurements were taken from regularly spaced points along a line segment to depict the spatial and temporal dynamics of fluorescence reactivity, levels, and signal overlap in infected cells over time. Values were plotted as a smooth line graph with relative fluorescence intensity units (RFU) on the Y-axis and distance (nm) on the X-axis. LC3B (magenta) and A12 (green). (I) F30Y PV time course – LC3B IFA. Images illustrate representative confocal immunofluorescence fields of F30Y PV-infected HeLa cells 4-, 6-, and 8 hours post-infection (hpi). Fixed cells were immunostained using LC3B (magenta), A12 (green), and αTubulin (grey) antibodies as described for WT PV in (G). TOPO-stained nuclei are shown (cyan). (J) F30Y PV fluorescence intensity profiles. Intensity profile plots reveal the progression of LC3B and A12 fluorescence of F30Y PV-infected cells over time. Intensity measurements were acquired from the panels shown in (I) as described for WT PV in (H).
Figure 6.
Figure 6.. Virions produced by both WT and F30Y PV colocalize with GABARAP
(A) WT PV time course – GABARAP IFA. Images illustrate representative confocal immunofluorescence fields of WT-infected HeLa cells 4-, 6- and 8 hours post-infection (hpi). HeLa cells were infected with WT PV at an MOI of 10, fixed, and immunostained at the labeled time points. Fixed cells were immunostained using GABARAP (magenta), A12 (green), and αTubulin (grey) antibodies. TOPO-stained nuclei are shown (cyan). The top panels show GABARAP and A12 fluorescence overlay with a perinuclear inset delineated with a white square and a cytoplasmic inset in yellow. The bottom panels show GABARAP, A12, αTubulin, and TOPO fluorescence overlays (MERGE) with a white line extending from the nuclear envelope to the plasma membrane of cells. Each column incrementally shows the hours post-infection from left to right mock, 4-, 6-, and 8- hpi. (B) WT PV fluorescence intensity profiles. Intensity profile plots reveal the progression of GABARAP and A12 fluorescence in WT PV-infected cells over time. The bottom panels in (A) show GABARAP, A12, αTubulin, and TOPO fluorescence overlays (MERGE), with a white line extending from the nuclear envelope to the plasma membrane used for “profile” fluorescence signal quantification. Intensity profile measurements were taken from regularly spaced points along a line segment to depict the spatial and temporal dynamics of fluorescence reactivity, levels, and signal overlap in infected cells over time. Values were plotted as a smooth line graph with relative fluorescence intensity units (RFU) on the Y-axis and distance (nm) on the X-axis. GABARAP (magenta) and A12 (green). (C) F30Y PV time course – GABARAP IFA. Images illustrate representative confocal immunofluorescence fields of F30Y PV-infected HeLa cells 4-, 6-, and 8 hours post-infection (hpi). Fixed cells were immunostained using GABARAP (magenta), A12 (green), and αTubulin (grey) antibodies as described for WT PV in (A). TOPO-stained nuclei are shown (cyan). (D) F30Y PV fluorescence intensity profiles. Intensity profile plots reveal the GABARAP and A12 fluorescence progression of F30Y PV-infected cells over time. Intensity measurements were acquired from the panels shown in (I) as described for WT PV in (C).
Figure 7.
Figure 7.. Application of high-angle annular dark-field (HAADF) scanning transmission electron microscopy (STEM) to the study of PV-induced autophagic signals
(A) HAADF-STEM imaging of WT PV-infected HeLa cells. HeLa cells were infected with WT PV at an MOI of 10 and then fixed in glutaraldehyde at the indicated time points. Fixed samples were dehydrated, stained, embedded, and sectioned in thin micrographs for imaging as described (Fig. S1). Images were collected using a Thermo Scientific Talos F200X G2 (S)TEM operated at 200 kV and a beam current of approximately 0.12 nA. The contrast is also reversed when compared to TEM, with the vacuum appearing dark. WT infection induces virus-containing double membranous vesicles and amphisome-like vesicles with virions in the intra-luminal vesicles. Arrows indicate observed structures. Phagophore (magenta), virus particles (green), autophagosomes (yellow), amphisomes (blue), Golgi (G), nucleus (N). Large outer vesicles with intra-luminal vesicles (100–300 nm diameter) contain ~30 nm particles inside. Double membrane vesicles are located at sites where vesicular-tubular clusters are observed in TEM mode (see Fig. S1). (B) STEM imaging of WT PV-infected HeLa cells (Magnified). In this magnified view of STEM images, 30 nm virus particles were observed inside intra-luminal vesicles. Close-up view of an intra-luminal vesicle that contains 30 nm particles. (C) Autophagic signals during WT PV infection. An ER-derived omegasome buds out and is engaged by multiple autophagy-associated proteins, adaptors, kinases, and protein complexes to yield an autophagophore in preparation for virion loading and maturation of a double-membranous vesicle termed autophagosome. For intact/functional cargo secretion in vesicles, the autophagosome may fuse with endosomes to form a virus-containing amphisome-like vesicle.
Figure 8.
Figure 8.. 3CD-mutant PV exhibits defects to autophagosome biogenesis and virion loading.
(A) HAADF-STEM imaging of WT PV-infected HeLa cells in the presence of hydantoin. HeLa cells were infected with WT PV at an MOI of 10 in the presence of 50 μg/mL hydantoin and then fixed in glutaraldehyde at the indicated time points. Fixed samples were dehydrated, stained, embedded, and sectioned in thin micrographs for imaging as described (Fig. S1). Arrows indicate observed structures. Phagophore (magenta), virus particles (green), autophagosomes (yellow), and nucleus (N). Hydantoin impairs virus assembly, as evidenced by the lack of virus particles observed in the image. Omegasomes, empty double-membrane vesicles (DMVs), and fiber-like structure-containing DMVs are abundant in these samples. Intra-luminal vesicles in amphisome-like vesicles appear empty. These ultrastructural changes are observed both at 6 and 8 hpi. (B) HAADF-STEM imaging of F30Y PV-infected HeLa cells. HeLa cells were infected with F30Y PV at an MOI of 10 and then fixed in glutaraldehyde at the indicated time points. Fixed samples were dehydrated, stained, embedded, and sectioned in thin micrographs for imaging as described (Fig. S1). Arrows indicate observed structures. Phagophore (magenta), virus particles (green), autophagosomes (yellow), and nucleus (N). F30Y interferes with DMV maturations with an exaggerated amount of omegasomes and aberrant DMVs observed by 6 hpi. Few virions are observed, some of which appear “stuck” in an omegasome. (C) Autophagic signals during F30Y PV infection. An ER-derived omegasome buds out and is engaged by multiple autophagy-associated proteins, adaptors, kinases, and protein complexes to yield an autophagophore in preparation for virion loading and maturation of a double-membranous vesicle termed autophagosome. This step is blocked by hydantoin. Autophagosome maturation is triggered by the lipidated form of the essential microtubule-associated protein 1A/1B-light chain 3 (LC3) protein. Virus is recruited to the phagophore by combining factors, including LC3 and 3CD. F30Y 3CD interferes with this step.
Figure 9.
Figure 9.. LC3- and GABARAP-interacting regions in PV 3CD
(A) PV 3C and 3D LIRs. LC3-interacting region (LIR) mediates LC3 binding with autophagy-associated factors and cargo. LIRs are characterized by a consensus motif (W/F/Y) (x) (x) (L/I/V). All PV protein products encode at least 1 LIR for a total of 33 across all PV proteins. The 3CD region encodes for 13 LIRs. Shown in violet are ribbon depictions of 3C (PDB 1L1N) and 3D (PDB 1RA6), with LIRs highlighted in red. (B) Enterovirus 3D LIRmotif alignment. Enteroviruses encode at least two W/F/Y) (x) (x) (L/I/V) LIRs in the 3D region, which are strictly conserved across multiple virus species. The panel represents a partial sequence alignment of the PV 3D “palm” and “thumb” subdomains. Two motif regions that follow the LIR consensus sequence pattern are highlighted in red. (C) PV 3D and LC3A docking. Alphafold docking of 3D (violet ribbon depiction with an LIR in red) with LC3A (blue ribbon depiction with hydrophobic pocket in green) (D) PV 3D and GABARAP docking. The panels represent Alphafold docking of 3D (violet cartoon with LIR in red) with GABARAP (blue cartoon with hydrophobic pocket in green). (E) PV 3C and LC3B docking. The panels represent Alphafold docking of 3C (olive cartoon with LIR in red) with LC3B (blue ribbon with hydrophobic pocket in green). (F) PV 3C and GABARAP docking. The panels represent Alphafold docking of 3C with GABARAP (blue cartoon with hydrophobic pocket in green). (G) PV 3D LIR peptide and LC3B docking. The panel represents Alphafold docking of the LEPSAF(30)HYVFEGVK peptide (in black ball-and-stick) with LC3B (gray surface). (H) PV 3D and LC3B peptide binding analysis. Analysis of docking and binding of two WT and mutant peptides to LC3B.
Figure 10.
Figure 10.. PV RdRp per-residue RMSD analysis suggests distinct conformational changes between WT and F30Y.
(A) MD-simulated WT and F30Y PV 3CD structures. Depicted are the most visited conformations of WT (dark slate blue) and F30Y (cyan) structures from MD simulations that are superimposed and shown as cartoons. The predicted 3D (28–33) LIR locations with the F30Y variant highlighted in red and (217–221) LIR are highlighted in dotted yellow ovals. (B) Root mean square deviation (RMSD). RMSD between the simulated WT and F30Y structures is plotted for the polymerase domain (aa 1–461, numbering corresponds to the 3D domain of 3CD). RMSD values were calculated using non-hydrogen atoms and averaged per-residue (per-RMSD). High per-residue RMSD values (>2.0) indicate regions of the polymerase that exhibited differences in conformations between WT and F30Y during MD simulations. (C) 3D LIR (28–33) F30Y conformational changes. Magnified view of the PV 3D (28–33) showing the distinct sidechain conformations of LIR residues 28–33. WT PV 3D is displayed in violet and F30Y in cyan. (D) 3D LIR (217–221) F30Y conformational changes. Magnified view of the PV 3D (217–221) showing the distinct sidechain conformations of LIR residues 217–221. WT PV 3D is displayed in violet F30Y in cyan. (E) RMSD comparison. Table describing highlighted values from the per-RMSD calculations between WT and F30Y PV 3CD with values higher than 2.0.

Similar articles

References

    1. Andino R, Kirkegaard K, Macadam A, Racaniello VR, Rosenfeld AB. 2023. The Picornaviridae Family: Knowledge Gaps, Animal Models, Countermeasures, and Prototype Pathogens. J Infect Dis 228:S427–S445. - PubMed
    1. Chumakov K, Ehrenfeld E, Agol VI, Wimmer E. 2021. Polio eradication at the crossroads. Lancet Glob Heal 9:e1172–e1175. - PubMed
    1. Tebbens RJD, Kalkowska DA, Thompson KM. 2019. Global certification of wild poliovirus eradication: insights from modelling hard-to-reach subpopulations and confidence about the absence of transmission. BMJ Open 9:e023938. - PMC - PubMed
    1. Bigouette JP, Wilkinson AL, Tallis G, Burns CC, Wassilak SGF, Vertefeuille JF. 2021. Progress Toward Polio Eradication — Worldwide, January 2019–June 2021. Morb Mortal Wkly Rep 70:1129–1135. - PMC - PubMed
    1. Kalkowska DA, Wassilak SGF, Wiesen E, Burns CC, Pallansch MA, Badizadegan K, Thompson KM. 2023. Coordinated global cessation of oral poliovirus vaccine use: Options and potential consequences. Risk Anal 10.1111/risa.14158. - DOI - PMC - PubMed

Publication types

LinkOut - more resources