[Preprint]. 2024 Oct 14:2024.10.14.618295.
doi: 10.1101/2024.10.14.618295.

Cell-Type Resolved Protein Atlas of Brain Lysosomes Identifies SLC45A1-Associated Disease as a Lysosomal Disorder

Affiliations

Cell-Type Resolved Protein Atlas of Brain Lysosomes Identifies SLC45A1-Associated Disease as a Lysosomal Disorder

Ali Ghoochani et al. bioRxiv. .

Abstract

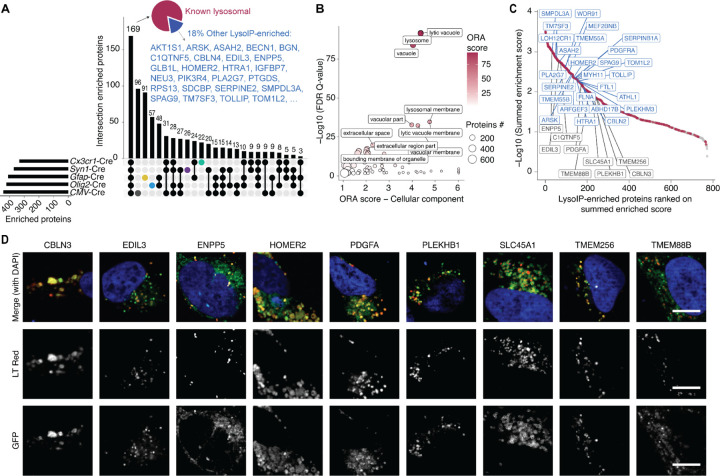
Mutations in lysosomal genes cause neurodegeneration and neurological lysosomal storage disorders (LSDs). Despite their essential role in brain homeostasis, the cell-type-specific composition and function of lysosomes remain poorly understood. Here, we report a quantitative protein atlas of the lysosome from mouse neurons, astrocytes, oligodendrocytes, and microglia. We identify dozens of novel lysosomal proteins and reveal the diversity of the lysosomal composition across brain cell types. Notably, we discovered SLC45A1, mutations in which cause a monogenic neurological disease, as a neuron-specific lysosomal protein. Loss of SLC45A1 causes lysosomal dysfunction in vitro and in vivo. Mechanistically, SLC45A1 plays a dual role in lysosomal sugar transport and stabilization of V1 subunits of the V-ATPase. SLC45A1 deficiency depletes the V1 subunits, elevates lysosomal pH, and disrupts iron homeostasis causing mitochondrial dysfunction. Altogether, our work redefines SLC45A1-associated disease as a LSD and establishes a comprehensive map to study lysosome biology at cell-type resolution in the brain and its implications for neurodegeneration.


Conflict of interest statement

Declaration of interest M.A-R. is a scientific advisory board member of Lycia Therapeutics and advisor for Scenic Biotech. All other authors declare no competing interests.

Figures

Figure 1.
Figure 1.. Cell-type-specific LysoIP from the brain
(A) Schematic representation of the experimental pipeline for isolating cell-type-specific lysosomes from mouse brains and further analysis by immunofluorescence microscopy of mass spectrometry (LC-MS). (B) Immunofluorescence staining to assess the colocalization of LysoTag (TMEM192-3xHA) with LAMP1, a lysosomal marker. NeuN was used as a marker for neurons, GFAP for astrocytes, MBP for oligodendrocytes, and TMEM119 for microglia. Scale bars are 5 µm. (C) Volcano plot representation of the log2 fold change (FC) in the abundance of proteins in IP samples from different Cre lines against mockIP controls (n = 3–6). Dashed lines indicate the threshold used to select differentially abundant proteins (absolute log2 FC > 0.58 and Q-value < 0.05). Colored dots highlight known lysosomal proteins, while black dots show other significantly LysoIP-enriched proteins, Table S1D. Known lysosomal proteins defined in Table S1A.
Figure 2.
Figure 2.. The proteomic landscape of brain lysosomes
(A) Upset plot showing overlap between LysoIP-enriched proteins in the different Cre lines (Tables S2A–E; n = 3–6). 82% of the proteins identified in all the Cre lines are known lysosomal proteins. Proteins highlighted in blue represent LysoIP-enriched proteins not yet reported as lysosomal. Known lysosomal proteins based on Table S1A. (B) Gene ontology (GO) terms over representation analysis (ORA) among LysoIP-enriched proteins. GO Cellular components terms are shown. ORA was performed using GOrilla (Gene Ontology enRIchment anaLysis and visuaLizAtion tool), with a P-value threshold of 0.001 using the list of all proteins detected and quantified in this study as background set. Top enriched terms according to ORA-score (GO enrichment combined with −log10(FDR Q-value)) are highlighted (see Table S3A). (C) LysoIP-enriched proteins were ranked based on their combined enrichment score across all Cre lines (see Table S2F). Red dots represent known lysosome-associated proteins based on Table S1A, gray dots represent other LysoIP-enriched proteins, top ranking selected proteins highlighted in blue. Proteins highlighted in gray boxes have been selected for validation by colocalization microscopy in Figure 2D. (D) Qualitative analysis of selected LysoIP-enriched proteins by fluorescence microscopy. Colocalization of transiently transfected GFP-tagged candidate proteins (GFP, green) and Lysotracker (LT, red) in U2OS cells. Nuclear staining in blue using DAPI. Scale bar is 10 µm.
Figure 3.
Figure 3.. Cell-type-specific lysosomal proteomic landscape in the brain
(A) Principal component analysis (PCA) based on the normalized abundance of LysoIP-enriched proteins across Cre lines (n = 3–6; ellipses represent 95% confidence interval for each group). (B) Volcano plot showing differential protein abundance between LysoIP from different Cre lines. Log2-transformed protein abundances were normalized to the median of core lysosomal proteins and tested using ANOVA (Figure S3A, Table S4). Selected top differentially abundant proteins are highlighted. Proteins were ranked according to a differential abundance score calculated as −log10(ANOVA adjusted P-value) plus the maximum log2 difference from the mean abundance across all the Cre lines. (C) Heatmap of top 25 most differentially abundant proteins for each Cre line (80 proteins in total; n = 3–6; z-score transformed). Known lysosomal proteins (Table S1A) are highlighted on the left. (D) Barplots of top 6 most differentially abundant proteins per Cre line (16 proteins in total; ANOVA adjusted P-value < 0.05; n = 3–6; error bar SEM). (E) Heatmap comparison of protein abundance from LysoIP proteomics and mRNA levels for top differentially abundant proteins across brain cell types. mRNA levels were derived from a single cell RNAseq dataset obtained from DropViz. The similarity between protein and mRNA abundance for each gene was calculated by computing the euclidean distance between ranks of abundances for mRNA and protein across cell types and using this distance to calculate a similarity score (see methods). RNAseq values for different neuron and oligodendrocyte subtypes were averaged (n = 3–6 for proteomic data; z-score transformed; Table S5). (F) Barplot of LSD- and neurodegeneration-associated proteins identified among LysoIP-enriched proteins. Differentially abundant proteins were defined with ANOVA adjusted P-value < 0.05 and absolute log2 abundance difference from the mean of all the Cre lines > 1. ADRD: Alzheimer’s disease and related dementia; PD: Parkinson’s disease; LSD: lysosomal storage disorders. (G) Barplot of differentially abundant LSD- and neurodegeneration-associated proteins (n = 3–6; error bar SEM).
Figure 4.
Figure 4.. SLC45A1 is a lysosomal protein
(A) Schematic representation of the endogenous Flag-tagging of SLC45A1 using CRISPR/Cas9 technology in iPSCs. ssODNs: single-stranded oligodeoxynucleotides. (B) Immunoblot analyses of endogenous Flag-tagged SLC45A1 expression in iPSCs and at pre-differentiation (pref-diff.) stages, as well as on days 7, 14, and 21 post-neuronal differentiation. A Flag antibody was used to detect Flag-SLC45A1 fusion, and MAP2 served as a neuronal differentiation marker. (C) Live imaging to assess the co-localization of eGFP-SLC45A1 (green) with RFP-LAMP1 (red) in SH-SY5Y cells. Representative image is shown. Scale bars are 10 µm (top) and 2 µm (bottom). A representative pixel intensity plot is shown for RFP-LAMP1 (red) and eGFP-SLC45A1 (green). (D) Immunoblot analyses to detect Flag-tagged SLC45A1 in the lysosomal fraction (LysoIP) of SH-SY5Y cells. LAMP2 and Cathepsin B were used as lysosomal markers, while Golgin-97, VDAC1, and Calreticulin were used as markers for the Golgi, mitochondria, and endoplasmic reticulum, respectively. (E) Immunofluorescence analysis to assess the co-localization of endogenous Flag-tagged SLC45A1 in iPSC-derived neurons (day 21) and the lysosomes. LAMP1 was used as a lysosomal marker (green), and a Flag antibody was used to detect endogenous SLC45A1 (red). Representative image is shown. Scale bars are 5 µm (top) and 2 µm (bottom). A pixel intensity plot is shown for LAMP1 (green) and Flag-SLC45A1 (red). (F) Immunoblot analyses to detect endogenously Flag-tagged SLC45A1 in the lysosomal fraction (LysoIP) of iNeurons (day 21). LAMP1 and Cathepsin B were used as lysosomal markers, while Golgin-97, VDAC1, and Calreticulin were used as markers for the Golgi, mitochondria, and endoplasmic reticulum, respectively.
Figure 5.
Figure 5.. Loss of SLC45A1 leads to lysosomal dysfunction and mitochondrial impairment
(A) Immunofluorescence analysis of LAMP1 signal in human SH-SY5Y cells: wildtype (n = 20 fields), SLC45A1-KO (n = 26 fields), and rescued (KO+SLC45A1) (n = 23 fields). Representative images are included. Scale bar is 5 µm. Quantification on the right. P-values were calculated by one-way analysis of variance (ANOVA) with Tukey’s honestly significant difference (HSD) test. (B) Transmission electron microscopy (TEM) analysis of human SH-SY5Y. Representative images are shown. Red and blue arrows indicate lysosomes and mitochondria, respectively. Bottom panels show dot plots for single lysosome size (µm²), the number of lysosomes per field (5.54 µm x 5.54 µm), and the number of dense lysosomes per field (5.54 µm x 5.54 µm) in wildtype (n = 40 fields), SLC45A1-KO (n = 65 fields), and rescued cells (n = 50 fields). Horizontal dotted lines represent the mean. P-values were calculated by ANOVA with Tukey’s HSD test. (C) Immunoblot analysis of LC3I and LC3II in human SH-SY5Y cells: wildtype, SLC45A1-KO, and rescued (KO+SLC45A1) under serum replete (+serum) and deplete (-serum) conditions. Quantitation in the right panel. P-values were calculated by one-way ANOVA with Tukey’s HSD test. (n = 3, independent biological samples). (D) Untargeted lipidomics analysis of SLC45A1-KO and rescued (KO+SLC45A1) SH-SY5Y cells under 72 h serum deprivation conditions. Data is presented as a volcano plot of log2-transformed fold changes in the abundance of lipids between SLC45A1-KO and rescued cells. The horizontal line indicates a P-value of 0.05 and the vertical lines indicate a fold change of 2. n = 3 biological independent samples per genotype. P-values were calculated by one-way analysis of variance (ANOVA) with Tukey’s honestly significant difference (HSD) test. Lipidomics data for wildtype, SLC45A1-KO, and rescued cells are provided in Table S7. BMPs were identified with definitive -H and +NH4 MS2s. BMP/PG was used in cases where +NH4 MS2 data was not acquired for definitive distinction between isomeric BMP and PG. (E) Targeted quantitation of BMPs after normalizing to endogenous lipid PE(16:0/18:1) (POPE) in wildtype, SLC45A1-KO, and rescued cells (n = 3 each). P-values were calculated by one-way ANOVA with Tukey’s HSD test. (F) Immunofluorescence analysis and quantification of LAMP1 signal in primary neurons isolated from Slc45a1+/+ (n = 33 fields) and Slc45a1-/- mice (n = 31 fields). P-values were calculated by two-tailed independent t-tests. Horizontal dotted lines represent the mean. Scale bar is 5 µm. (G) TEM analysis of mouse cortex from Slc45a1+/+ and Slc45a1-/- mice. Blue shadow indicates neuronal cells. Arrows (red) indicate lipofuscin-like pigment in the neurons. (H) Schematic overview of proximity labeling (BioID) experiment. BirA* (n = 4), and TMEM192-BirA* (n = 3) were used as controls. BirA*-SLC45A1 (n = 3). (I) Heatmap representation of selected lysosomal proteins enriched by BirA*-SLC45A1 or TMEM192-BirA* in the BioID experiment. Candidates were selected for being enriched over BirA* (negative control) with a mean log2 ratio > 1 and Q-value < 0.05. Since we found multiple members of the vATPase to be enriched in BirA*-SLC45A1, we included all the detected subunits in the heatmap. Some shared candidates are also included. Candidates selected based on Table S8A. Heatmap data based on Table S8B. n = 3–4 biologically independent samples. (J) Immunoblot analyses of anti-Flag immunoprecipitation of Flag-SLC45A1 in SH-SY5Y cells followed by detection of interacting endogenous V-ATPase subunits including V1A, V1B2, V1C1, V1D and V1E1. (K) Heatmap representation of relative protein abundance of V-ATPase subunits in LysoIP and whole-cell fractions from human SH-SY5Y wildtype, and SLC45A1-KO, and rescued cells under serum fed and starved conditions. Data provided in Table S9A–B. n = 3 biologically independent samples, n = 2 for whole cell KO +SLC45A1 fed condition. Significantly depleted V-ATPase subunits in KO vs WT are indicated. Protein complex selected based on BioID experiment in (I), that was found to interact with SLC45A1. Gray boxes indicate that proteins were not detected. (L) Assessment of lysosomal acidity using the FIRE-pHLy reporter (see S5J) in SH-SY5Y cells. Fluorescence intensity ratios for mTFP1 and mCherry (mTFP1/mCherry) were calculated. Increased ratio indicates increase in lysosomal pH. P-values were calculated by one-way ANOVA with Tukey’s HSD test. Horizontal dotted lines represent the mean. (M) Immunoblot analysis of ferritin heavy chain (FTH1) with β-Actin as loading control in whole-cell lysates prepared from wildtype, SLC45A1-KO and rescued cells upon serum deprivation. (N) Mitochondrial oxygen consumption rates (OCR) in wildtype (n = 4), SLC45A1-KO (n = 6) and rescued SH-SY5Y cells (n = 4). Reads were normalized to total protein. Results represent mean ± SEM. P-values were calculated by two-way ANOVA test and reported against the KO with the color matches that to which it is compared. (O) Mitochondrial OCR upon iron supplementation with 0.2 mg/ml ferric ammonium citrate (FAC) in SLC45A1-KO and rescued SH-SY5Y cells. Reads were normalized to total protein. Results represent mean ± SEM (n = 3). P-values were calculated by two-way ANOVA test and reported against the KO with the color matches that to which it is compared.
Figure 6.
Figure 6.. SLC45A1 deficiency leads to sugar accumulation in the lysosome
(A) Untargeted metabolomic analysis of SLC45A1-KO and rescued (KO+SLC45A1) SH-SY5Y cells under 72 h serum deprivation conditions. Data is presented as a volcano plot of log2-transformed fold changes in the abundance of putatively identified metabolites between SLC45A1-KO and rescued cells. The horizontal line indicates a P-value of 0.05 and the vertical lines indicate a fold change of 2. n = 3 biological independent samples per genotype. P-values were calculated by one-way ANOVA with Tukey’s HSD test. Metabolomics data for wildtype, SLC45A1-KO, and rescued cells are provided in Table S10. (B) Targeted quantitation of hexose (C6H12O6) in wildtype, SLC45A1-KO, and rescued cells from A. P-values were calculated using one-way ANOVA with Tukey’s HSD test. Horizontal line represents the mean (n = 3 biologically independent samples). (C) Schematic overview of the procedure for loading lysosomes with sucrose to monitor glucose efflux. Cells were treated with sucrose (50 mM) for 24 h, followed by treatment with invertase (0.5 mg/ml) for 1 h. Hexose in purified lysosomes was derivatized to benzoyl-hexose for measurement by LC-MS/MS analysis. (D) Representative extracted ion chromatogram of benzoyl-hexose measurement in purified lysosomes following sucrose and invertase treatment compared to untreated condition, indicating hexose enrichment in lysosomes after treatment. (E) Measurement of benzoyl-hexose from purified lysosomes in wildtype, SLC45A1-KO, and rescued SH-SY5Y cells upon treatment with sucrose and invertase. Horizontal line represents the mean (n = 3 biologically independent samples). P-values were calculated using one-way ANOVA with Tukey’s HSD test. (F) Representative extracted ion chromatogram of wildtype, SLC45A1-KO, and rescued cells from the same experiment in E. (G) Schematic overview for analyzing lysosomal hexose specifically from neurons using LysoIP. Syn1 promoter-driven Cre recombinase allows LysoTag expression in neurons of Slc45a1+/+ or Slc45a1-/- mice. Control mockIP was done using Cre-negative mice (LysoTag-). (H) Measurement of derivatized hexose from purified lysosomes of mouse brain neurons. LysoIP was performed in Slc45a1+/+;Syn1-Cre+;LysoTag+ (n = 3), Slc45a1-/-;Syn1-Cre+;LysoTag+ (n = 3) and LysoTag- controls for mockIP (n = 4). Horizontal line represents the mean. P-values were calculated using one-way ANOVA with Tukey’s HSD test. (I) Representative extracted ion chromatogram from each LysoIP in H.

References

    1. Ballabio A., and Bonifacino J.S. (2020). Lysosomes as dynamic regulators of cell and organismal homeostasis. Nat. Rev. Mol. Cell Biol. 21, 101–118. 10.1038/s41580-019-0185-4. - DOI - PubMed
    1. Settembre C., and Perera R.M. (2024). Lysosomes as coordinators of cellular catabolism, metabolic signalling and organ physiology. Nat. Rev. Mol. Cell Biol. 25, 223–245. 10.1038/s41580-023-00676-x. - DOI - PubMed
    1. Rudnik S., and Damme M. (2021). The lysosomal membrane-export of metabolites and beyond. FEBS J. 288, 4168–4182. 10.1111/febs.15602. - DOI - PubMed
    1. Lawrence R.E., and Zoncu R. (2019). The lysosome as a cellular centre for signalling, metabolism and quality control. Nat. Cell Biol. 21, 133–142. 10.1038/s41556-018-0244-7. - DOI - PubMed
    1. Medoh U.N., Chen J.Y., and Abu-Remaileh M. (2022). Lessons from metabolic perturbations in lysosomal storage disorders for neurodegeneration. Curr. Opin. Syst. Biol. 29, 100408. 10.1016/j.coisb.2021.100408. - DOI

Publication types

LinkOut - more resources