[Preprint]. 2024 Sep 29:2024.09.29.615681.
doi: 10.1101/2024.09.29.615681.

Glutamate Transport Proteins and Metabolic Enzymes are Poor Prognostic Factors in Invasive Lobular Carcinoma

Affiliations

Glutamate Transport Proteins and Metabolic Enzymes are Poor Prognostic Factors in Invasive Lobular Carcinoma

Todd A Young et al. bioRxiv. .

Abstract

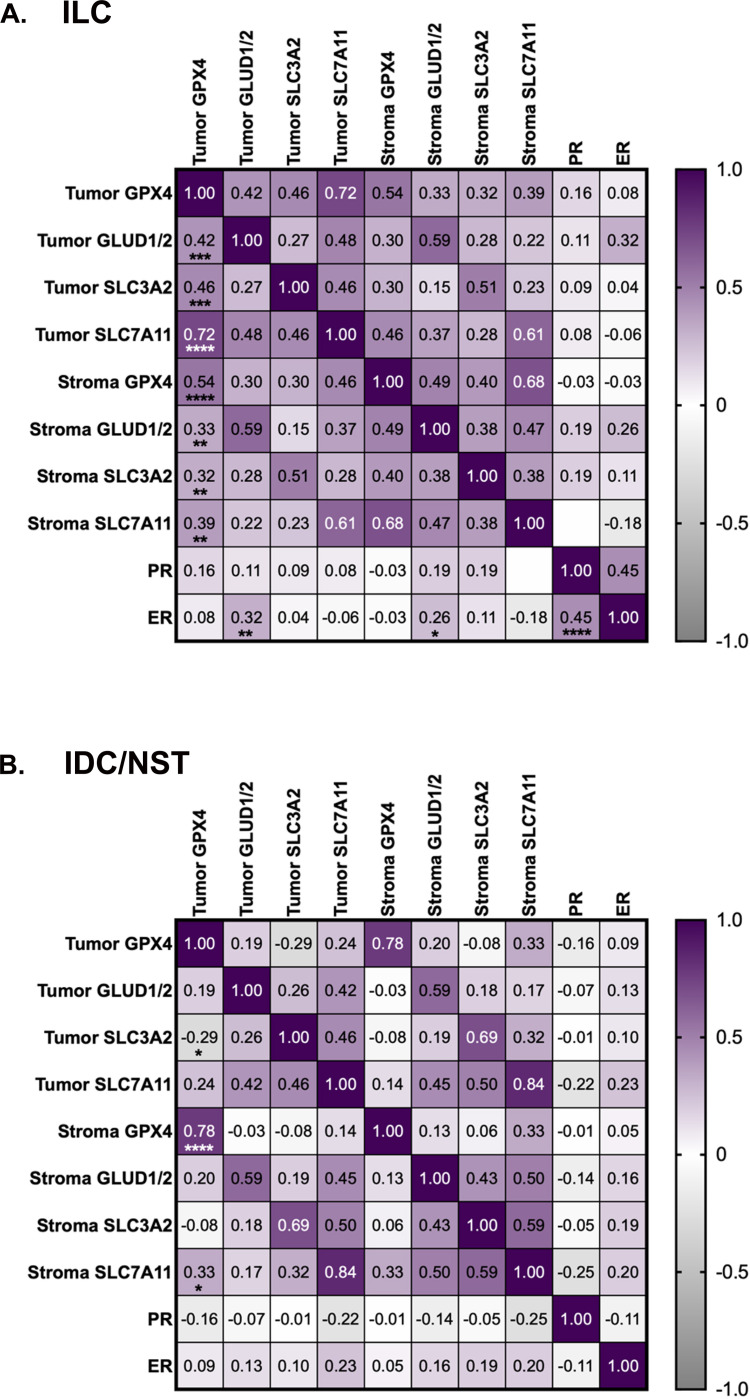
Invasive Lobular Carcinoma (ILC) is a subtype of breast cancer characterized by distinct biological features, and limited glucose uptake coupled with increased reliance on amino acid and lipid metabolism. Our prior studies highlight the importance of glutamate as a key regulator of ILC tumor growth and therapeutic response. Here we examine the expression of four key proteins involved in glutamate transport and metabolism - SLC3A2, SLC7A11, GPX4, and GLUD1/2 - in a racially diverse cohort of 72 estrogen receptor-positive (ER+) ILC and 50 ER+ invasive ductal carcinoma, no special type (IDC/NST) patients with primary disease. All four proteins are associated with increased tumor size in ILC, but not IDC/NST, with SLC3A2 also specifically linked to shorter overall survival and the presence of comorbidities in ILC. Notably, GLUD1/2 expression is associated with ER expression in ILC, and is most strongly associated with increased tumor size and stage in Black women with ILC from our cohort and TCGA. We further explore the effects of GLUD1 inhibition in endocrine therapy-resistant ILC cells using the small-molecule inhibitor R162, which reduces ER protein levels, increases reactive oxygen species, and inhibits oxidative phosphorylation. These findings highlight a potentially important role for glutamate metabolism in ILC, particularly for Black women, and position several of these glutamate-handling proteins as potential targets for therapeutic intervention in ILC.

Keywords: GLUD1; GPX4; Invasive lobular carcinoma; disparities; glutamate metabolism.


Conflict of interest statement

Conflict of interest: Authors declare no conflict of interest.

Figures

Figure 1.
Figure 1.. Expression of glutamate-handling proteins in ILC and IDC/NST.
A, Schematic showing functional relationships between the four glutamate-handling proteins included in our multiplex IHC panel. Gln, glutamine; Glu, glutamate; Cys, cyst(e)ine; Gly, glycine; Pro, proline; Asp, aspartic acid; Leu, leucine; GSH, glutathione. B, Schema of cohort assembly and study workflow. A representative TMA core stained for the four target proteins and DNA is shown, along with its corresponding images processed for tissue segmentation indicating areas of panCK+(yellow, epithelial) and panCK- (aqua, stromal) cells, followed by phenotype mapping for (as an example) GLUD1/2+ (magenta) and GLUD1/2- (blue) cells. C, Comparison of protein expression for GPX4 and GLUD1/2 in the multiplex IHC panel between ILC and IDC/NST in panCK+ tumor cells (left) and panCK- stromal cells (right). Data are presented as a scatter plot, with each dot the mean of percent positive cells for an individual patient tumor and the solid line indicating the median. Data are analyzed by Mann-Whitney U test.
Figure 2.
Figure 2.. Glutamate-handling proteins are associated with increased tumor size in ILC.
A, Graphs illustrating the relationship between tumor size (cm) and percent positive cells for tumor expression of GPX4 and GLUD1/2 in the ILC cohort. B, Spearman correlation coefficient (ρ) and p value for each protein’s relationship to tumor size in panCK+ tumor cells and panCK- stromal cells for the ILC and IDC/NST cohorts. C, Kaplan-Meier survival analysis, log-rank p value, hazard ratio (HR), and 95% confidence interval (CI) for high (above median) versus low (below median) tumor expression (percent positive cells) of SLC3A2 in the ILC and IDC/NST cohorts.
Figure 3.
Figure 3.. Increased co-expression of glutamate transport proteins and metabolic enzymes in ILC.
Heatmaps showing Spearman correlation coefficients (ρ, ranging from +1.0 to −1.0) for each protein’s relationship to another, and hormone receptor expression (percent positive cells), in the ILC (A) and IDC/NST (B) cohorts. Asterisks denote statistical significance as defined in the Methods section.
Figure 4.
Figure 4.. High GLUD1/2 expression is associated with increased tumor size and stage in Black women with ILC.
A, Graphs illustrating the relationship between tumor size (cm) and percent positive cells for GPX4 and GLUD1/2 in Black women in the ILC cohort for panCK+ tumor cells. B, Spearman correlation coefficient (ρ) and p value for each protein’s relationship to tumor size in panCK+ tumor cells and panCK- stromal cells for Black women in both the ILC and IDC/NST cohorts. C, GLUD1 mRNA expression (RSEM, RNA-Seq by Expectation-Maximization) by tumor stage from TCGA for Black women with ILC (left) and Luminal A and Luminal B IDC/NST (right) breast cancer. Data are presented as a scatter plot, with the solid line indicating the median. *, GLUD1 expression in Stage I vs Stage II Ductal breast cancer by unpaired t-test.
Figure 5.
Figure 5.. Enrichment of SLC3A2 and GPX4 in tumors from women with comorbidities in ILC and IDC/NST.
A, Fisher’s Exact Test of the presence or absence of any comorbidity, or specific comorbidities, in ILC compared to IDC/NST. B, Fisher’s Exact Test of the presence or absence of any comorbidity in Black women compared to white women in the ILC and IDC/NST cohorts. C, Fisher’s Exact Test of the proportion of high (above median) and low (below median) target expression in women with versus without comorbidity in the entire ILC (left, SLC3A2) and IDC/NST (right, GPX4) cohorts.
Figure 6.
Figure 6.. GLUD1 inhibition reduces ER protein levels, increases ROS, and reduces oxidative phosphorylation in endocrine therapy-resistant ILC cell lines.
A, Heatmap of GLUD1 peptide count from ER RIME assays published by Sottnik et al. Data are presented as the mean peptide count from two biological replicates of the SUM44, MM134, and BCK4 ILC cell lines. B, Immunoblot analysis of the expression of ER in ILC breast cancer cell lines cultured in the absence (−) and presence (+) of treatment with the GLUD1 inhibitor R162. Actin serves as a loading control. C, Flow cytometry analysis of SUM44 (left) and LCCTam cells (right) cultured in the absence (DMSO) and presence (R162) of the GLUD1 inhibitor, then stained with CellROX Deep Red and SYTOX Blue. Data from CellROX/SYTOX double-positive cells are normalized to the DMSO control, presented as the mean + standard deviation for four independent experiments, and analyzed by Mann-Whitney U test. D, Metabolic imaging of NADH autofluorescence by fluorescence lifetime imaging (FLIM) and phasor analysis in LCCTam cells cultured in the absence (DMSO) and presence (R162) of the GLUD1 inhibitor. Oligomycin serves as a positive control to increase the proportion of free NADH by shifting cellular metabolism towards glycolysis. Upper panel shows a plot of normalized pixel number versus fractional intensity of free NADH (glycolysis) for treated and untreated cells. Lower panel shows representative images from one of eighteen independent fields of view for treated and untreated cells. Scale bar = 10 μm. Phasor – nuclear mask images are pseudo-colored based on the phasor plot (below) where more protein-bound and more free NADH phasor positions are indicated by red and green cursor circles, respectively. Pink/purple color represents increased protein-bound NADH (OXPHOS), and cyan indicates higher levels of free NADH (glycolysis).

References

    1. Christgen M. et al. Lobular Breast Cancer: Histomorphology and Different Concepts of a Special Spectrum of Tumors. Cancers 13, 3695 (2021). - PMC - PubMed
    1. McCart Reed A. E., Kalinowski L., Simpson P. T. & Lakhani S. R. Invasive lobular carcinoma of the breast: the increasing importance of this special subtype. Breast Cancer Res 23, 6 (2021). - PMC - PubMed
    1. Ciriello G. et al. Comprehensive Molecular Portraits of Invasive Lobular Breast Cancer. Cell 163, 506–19 (2015). - PMC - PubMed
    1. Ulaner G. A. & Schuster D. M. Amino Acid Metabolism as a Target for Breast Cancer Imaging. PET Clin 13, 437–444 (2018). - PMC - PubMed
    1. Savir-Baruch B., Zanoni L. & Schuster D. M. Imaging of Prostate Cancer Using Fluciclovine. PET Clin 12, 145–157 (2017). - PubMed

Publication types

LinkOut - more resources