[Preprint]. 2024 Oct 17:2024.10.17.618851.
doi: 10.1101/2024.10.17.618851.

Primary cilia shape postnatal astrocyte development through Sonic Hedgehog signaling

Affiliations

Primary cilia shape postnatal astrocyte development through Sonic Hedgehog signaling

Rachel Bear et al. bioRxiv. .

Update in

Abstract

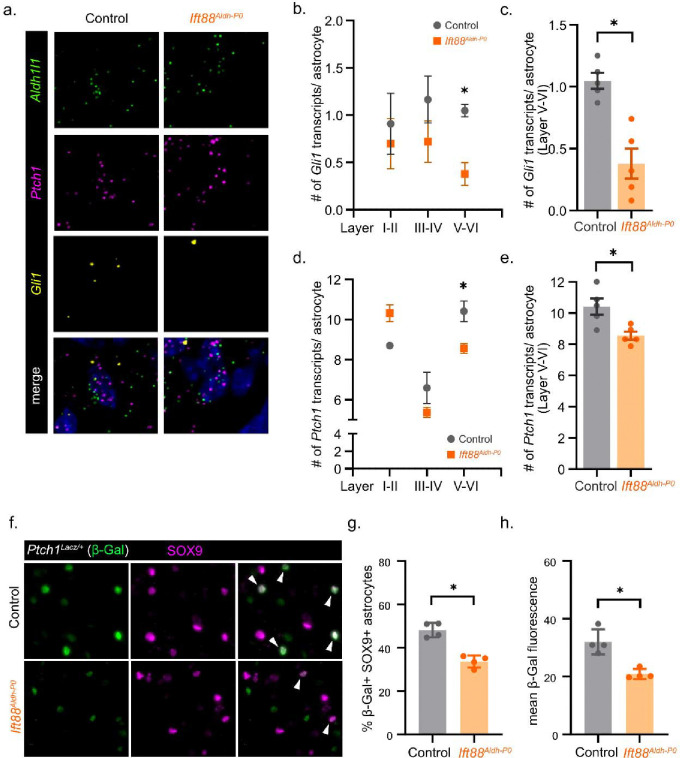
Primary cilia function as specialized signaling centers that regulate many cellular processes including neuron and glia development. Astrocytes possess cilia, but the function of cilia in astrocyte development remains largely unexplored. Critically, dysfunction of either astrocytes or cilia contributes to molecular changes observed in neurodevelopmental disorders. Here, we show that a sub-population of developing astrocytes in the prefrontal cortex are ciliated. This population corresponds to proliferating astrocytes and largely expresses the ciliary protein ARL13B. Genetic ablation of astrocyte cilia in vivo at two distinct stages of astrocyte development results in changes to Sonic Hedgehog (Shh) transcriptional targets. We show that Shh activity is decreased in immature and mature astrocytes upon loss of cilia. Furthermore, loss of cilia in immature astrocytes results in decreased astrocyte proliferation and loss of cilia in mature astrocytes causes enlarged astrocyte morphology. Together, these results indicate that astrocytes require cilia for Shh signaling throughout development and uncover functions for astrocyte cilia in regulating astrocyte proliferation and maturation. This expands our fundamental knowledge of astrocyte development and cilia function to advance our understanding of neurodevelopmental disorders.

Keywords: Sonic Hedgehog; astrocytes; cilia; development; morphology; proliferation.


Figures

Figure 1:
Figure 1:. A subset of immature and mature astrocytes have cilia and predominantly express ARL13B
(a) Schematic of primary cilia, the prefrontal cortex (red, region of interest), and genetic labeling approach. (b) Representative image of GFP staining to detect SSTR3-GFP- positive astrocyte cilia and SOX9 staining to label astrocytes. (c) Quantification of the percent ciliated SOX9- positive astrocytes at P8 and P21. (d) Representative image of GFP staining to detect SSTR3-GFP- positive astrocyte cilia and ARL13B and AC3 staining at P8 and P21. (e) Quantification of the percent colocalization of ARL13B or ARL13B and AC3 (ARL13B/AC3) with SSTR3-GFP- positive astrocyte cilia. n = 4 animals. Data are expressed as the mean ± SEM.
Figure 2:
Figure 2:. RNAseq analysis reveals changes in ciliary signaling in Ift88Aldh-E15
(a) Volcano plot showing differentially expressed genes in Ift88Aldh-E15 versus control astrocytes, upregulated genes (green) and downregulated genes (magenta), log FC cutoff of 0.75 and p-value < 0.05. n = 5 animals. (b) Gene ontology terms enriched in downregulated genes.
Figure 3:
Figure 3:. Ift88Aldh-E15 astrocytes display decreased Shh target gene expression and reduced Shh activity.
(a) Representative image of fluorescent in situ hybridization staining for the astrocyte maker Aldh1l1 and Shh target genes Ptch1 and Gli1 in control and Ift88Aldh-E15 astrocytes. (b) Quantification of the average number of Gli1 transcripts per astrocyte by PFC layer and (c) across all PFC layers in control and Ift88Aldh-E15. (d) Quantification of the average number of Ptch1 transcripts per astrocyte by PFC layer and (e) across all PFC layers in control and Ift88Aldh-E15. (f) Representative image of β-Gal staining (green) to detect Ptch1LacZ/+ and SOX9 staining (magenta) to label astrocytes in Ptch1LacZ/+ control and Ift88Aldh-E15; Ptch1LacZ/+ mice. (g) Quantification of the percent β-Gal-positive SOX9- positive astrocytes and (h) β-Gal mean fluorescence intensity in Ptch1LacZ/+ control and Ift88Aldh-E15; Ptch1LacZ/+ mice. n = 4 animals. Data are expressed as the mean ± SEM. Statistical analysis using t-test, *p-value < 0.05.
Figure 4:
Figure 4:. The relationship between cilia and the cell cycle during astrocyte proliferation
(a) Schematic of the Arl13b-Fucci2a reporter and representative image of astrocytes with or without cilia in each cell cycle stage. (b) Quantification of the percent of astrocytes in each cell cycle stage from P2- P8 in control pups. (c) Quantification of the percent of cycling astrocytes with or without cilia. (d) Quantification of the percent of quiescent astrocytes with or without cilia. n = 3–4 animals. Data are expressed as the mean ± SEM.
Figure 5:
Figure 5:. Ift88Aldh-E15 astrocytes display decreased proliferation
(a) Representative image of staining for Ki67 and GFP to label proliferating astrocytes and quantification of the percent Ki67- positive astrocytes in P4 mTmG control Ift88Aldh-E15;mTmG. (b) Representative image of staining for EdU and GFP to label proliferating astrocytes and quantification of the percent EdU- positive astrocytes in P4 mTmG control and Ift88Aldh-E15;mTmG. (c) Quantification of the percent of astrocytes in G0, G1, or S/G2/M from P4- P8 in AF2a control. (d) Quantification of the percent of astrocytes in G0, G1, or S/G2/M from P4- P8 in Ift88Aldh-E15;AF2a. n = 4– 6 animals. Data are expressed as the mean ± SEM. Statistical analysis using t-test. *p-value < 0.05.
Figure 6:
Figure 6:. RNAseq analysis reveals changes in developmental signaling pathways in Ift88Aldh-P0
(a) Volcano plot showing differentially expressed genes in Ift88Aldh-P0 versus control astrocytes, upregulated genes (green) and downregulated genes (magenta), log FC cutoff of 0.75 and p-value < 0.05. (b) Gene ontology terms enriched in downregulated genes.
Figure 7:
Figure 7:. Ift88Aldh-P0 deep PFC layer astrocytes display decreased Shh target gene expression and reduced Shh activity.
(a) Representative image of fluorescent in situ hybridization staining for the astrocyte maker Aldh1l1 and Shh target genes Ptch1 and Gli1 in PFC layer V-VI control and Ift88Aldh-P0 astrocytes. (b) Quantification of the average number of Gli1 transcripts per astrocyte by PFC layer and (c) PFC layer V-VI in control and Ift88Aldh-P0. (d) Quantification of the number of Ptch1 transcripts per astrocyte in each PFC layer and (e) PFC layer V-VI in control and Ift88Aldh-P0. (f) Representative image of β-Gal staining (green) to detect Ptch1LacZ/+ and SOX9 staining (magenta) to label astrocytes in Ptch1LacZ/+ control and Ift88Aldh-P0; Ptch1LacZ/+ mice. (g) Quantification of the percent β-Gal- positive SOX9- positive astrocytes and (h) β-Gal mean fluorescence intensity in Ptch1LacZ/+ control and Ift88Aldh-P0; Ptch1LacZ/+ mice. n = 4 animals. Data are expressed as the mean ± SEM. Statistical analysis using t-test, *p-value < 0.05.
Figure 8:
Figure 8:. Ift88Aldh-P1 astrocytes display increased membrane and branch structure in deep cortical layers.
(a, b) Representative confocal images of Aldh1l1-GFP astrocytes, 3-D reconstruction, and filament trace from PFC layer I-III and layer IV-VI in P21 control and Ift88Aldh-P1 astrocytes. (c) Quantification of membrane area and (d) membrane volume in total astrocytes and by PFC layer in control and Ift88Aldh-P1 astrocytes. (e) Quantification of total branch length in total astrocytes and by PFC layer in control and Ift88Aldh-P1 astrocytes. n = 3 animals, 30 astrocytes per genotype (15 each for layer I-III and layer IV-VI). Data are expressed as the mean ± SEM. Statistical analysis using t-test or one-way ANOVA followed by Turkey’s test for multiple comparisons, *p-value < 0.05.

References

    1. Akinlaja Y. O., & Nishiyama A. (2024). Glial modulation of synapse development and plasticity: Oligodendrocyte precursor cells as a new player in the synaptic quintet. Frontiers in Cell and Developmental Biology, 12, 1418100. 10.3389/fcell.2024.1418100 - DOI - PMC - PubMed
    1. Allen N. J., & Eroglu C. (2017). Cell Biology of Astrocyte-Synapse Interactions. Neuron, 96(3), 697–708. 10.1016/j.neuron.2017.09.056 - DOI - PMC - PubMed
    1. Anvarian Z., Mykytyn K., Mukhopadhyay S., Pedersen L. B., & Christensen S. T. (2019). Cellular signalling by primary cilia in development, organ function and disease. Nature Reviews Nephrology, 15(4), Article 4. 10.1038/s41581-019-0116-9 - DOI - PMC - PubMed
    1. Archer F. L., & Wheatley D. N. (1971). Cilia in cell-cultured fibroblasts. II. Incidence in mitotic and post-mitotic BHK 21-C13 fibroblasts. Journal of Anatomy, 109(Pt 2), 277–292. - PMC - PubMed
    1. Bangs F., & Anderson K. V. (2017). Primary Cilia and Mammalian Hedgehog Signaling. Cold Spring Harbor Perspectives in Biology, 9(5), a028175. 10.1101/cshperspect.a028175 - DOI - PMC - PubMed

Publication types

LinkOut - more resources