[Preprint]. 2024 Oct 14:2024.10.14.618124.
doi: 10.1101/2024.10.14.618124.

Virulence-linked adhesin drives mutualist colonization of the bee gut via biofilm formation

Affiliations

Virulence-linked adhesin drives mutualist colonization of the bee gut via biofilm formation

Patrick J Lariviere et al. bioRxiv. .

Abstract

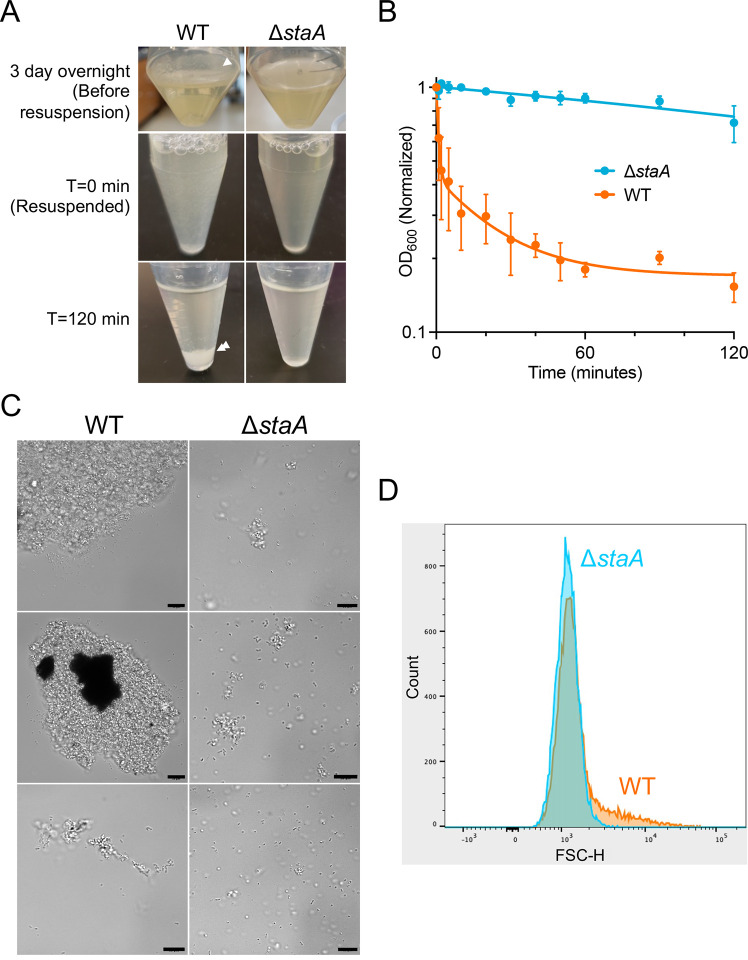
Bacterial biofilms are stable multicellular structures that can enable long term host association. Yet, the role of biofilms in supporting gut mutualism is still not fully understood. Here, we investigate Snodgrassella alvi, a beneficial bacterial symbiont of honey bees, and find that biofilm formation is required for its colonization of the bee gut. We constructed fifteen S. alvi mutants containing knockouts of genes known to promote colonization with putative roles in biofilm formation. Genes required for colonization included staA and staB, encoding trimeric autotransporter adhesins (TAAs) and mltA, encoding a lytic transglycosylase. Intriguingly, TAAs are considered virulence factors in pathogens but support mutualism by the symbiont S. alvi. In vitro, biofilm formation was reduced in ΔstaB cells and abolished in the other two mutants. Loss of staA also reduced auto-aggregation and cell-cell connections. Based on structural predictions, StaA/B are massive (>300 nm) TAAs with many repeats in their stalk regions. Further, we find that StaA/B are conserved across Snodgrassella species, suggesting that StaA/B-dependent colonization is characteristic of this symbiont lineage. Finally, staA deletion increases sensitivity to bactericidal antimicrobials, suggesting that the biofilm indirectly buffers against antibiotic stress. In all, the inability of two biofilm-deficient strains (ΔstaA and ΔmltA) to effectively mono-colonize bees indicates that S. alvi biofilm formation is required for colonization of the bee gut. We envision the bee gut system as a genetically tractable model for studying the physical basis of biofilm-mutualist-gut interactions.


Conflict of interest statement

Competing interests N.A.M. and J.E.B. have a patent (US11382989B2) on the use of engineered symbionts to improve bee health.

Figures

Figure 1.
Figure 1.. StaA, StaB, and MltA are required for effective host mono-colonization
A. Plot of CFU counts of WT and mutant S. alvi cells co-colonized in bees, indicating WT outcompetes the mutant strains. Ilea from bees co-colonized with 10% WT and 90% mutant S. alvi were plated on media containing Tet (selects for WT and mutant, green bars) and Tet + Kan (selects for mutant, yellow bars). N = 11–12 biological replicates for each condition. A Shapiro-Wilk test found that not all log10-transformed data are normally distributed. Individual data points and group medians with 95% CI are shown. Significant differences between the indicated log10-transformed group medians were determined by Mann-Whitney U tests with the two-stage Benjamini, Krieger, & Yekutieli method to correct for multiple comparisons by controlling the FDR (****q ≤ 0.0001). B. Plot of CFU counts of S. alvi mutants mono-colonized in bees, indicating ΔstaA and ΔstaB cannot effectively mono-colonize bees. Ilea from bees mono-colonized with mutant S. alvi were plated on media containing Tet + Kan (selects for mutant). Ilea from bees mono-colonized with WT control were plated on both Tet (allows for WT growth) and Tet + Kan (does not allow for WT growth). N = 7–12 biological replicates for each condition. A Shapiro-Wilk test found that not all log10-transformed data are normally distributed. Individual data points and group medians with 95% CI are shown. Significant differences between the log10-transformed medians of WT (+Tet) and all other groups were determined by Mann-Whitney U tests with the two-stage Benjamini, Krieger, & Yekutieli method to correct for multiple comparisons by controlling the FDR (*q ≤ 0.05, ***q ≤ 0.001, ****q ≤ 0.0001). C. Plot of CFU counts of S. alvi mutants mono-colonized in bees, indicating ΔmltA cannot effectively mono-colonize bees. ΔstaA, ΔstaB were also confirmed to not effectively mono-colonize bees. Ilea from bees mono-colonized with mutant S. alvi were plated on media containing Tet + Kan (selects for mutant). Ilea from bees mono-colonized with WT control were plated on both Tet (allows for WT growth) and Tet + Kan (does not allow for WT growth). N = 12 biological replicates for each condition. A Shapiro-Wilk test found that not all log10-transformed data are normally distributed. Individual data points and group medians with 95% CI are shown. Significant differences between the log10-transformed medians of WT (+Tet) and all other group were determined by Mann-Whitney U tests with the two-stage Benjamini, Krieger, & Yekutieli method to correct for multiple comparisons by controlling the FDR (***q ≤ 0.001, ****q ≤ 0.0001).
Figure 2.
Figure 2.. StaA and MltA are required for biofilm formation
A. Plot quantifying cell growth-normalized biofilm formation, indicating biofilm formation is decreased in most strains and abolished in ΔstaA. N = 6 for each condition. A Shapiro-Wilk test found that not all data are normally distributed. Individual data points and group medians with 95% CI are shown. Significant differences between the medians of WT and other groups were determined by Mann-Whitney U tests with the two-stage Benjamini, Krieger, & Yekutieli method to correct for multiple comparisons by controlling the FDR (**q ≤ 0.01). B. Image of 96-well plate stained with crystal violet, indicating biofilm formation is abolished in ΔstaA and reduced to varying degrees in other mutants. C. Plots quantifying non-normalized biofilm formation (top) and cell growth (bottom), demonstrating ΔstaA has near normal growth, but does not form biofilm. Other mutants produce varying degrees of biofilm, with OD600 values similar to or higher than WT. N = 6 for each condition. A Shapiro-Wilk test found that not all data are normally distributed. Individual data points and group medians with 95% CI are shown. D. Plot quantifying cell growth-normalized biofilm formation, indicating biofilm formation is abolished in ΔmltA and decreased to varying degrees in other mutants. N = 6 for each condition. A Shapiro-Wilk test found that not all data are normally distributed. Individual data points and group medians with 95% CI are shown. Significant differences between the medians of WT and other groups were determined by Mann-Whitney U tests with the two-stage Benjamini, Krieger, & Yekutieli method to correct for multiple comparisons by controlling the FDR (**q ≤ 0.01). E. Image of 96-well plate stained with crystal violet, indicating biofilm formation is abolished in ΔmltA, reduced in some mutants, and close to WT levels in others. F. Plots quantifying non-normalized biofilm formation (top) and cell growth (bottom), demonstrating ΔmltA has normal growth, but does not form biofilm. Some mutants have decreased or WT-like biofilm formation, with WT-like or better growth. N = 6 for each condition. A Shapiro-Wilk test found that not all data are normally distributed. Individual data points and group medians with 95% CI are shown.
Figure 3.
Figure 3.. StaA promotes auto-aggregation in S. alvi cells
A. Images of tubes containing WT or ΔstaA before (top) and after resuspension (middle) that were allowed to sediment (bottom), demonstrating that WT but not ΔstaA noticeably sediments within 120 min. WT cells form a biofilm prior to resuspension (top left, single arrow), briefly remain resuspended (middle left), and sediment after resuspension (bottom left, double arrow). ΔstaA cells primarily remain planktonic before (top right) and after (middle and bottom right) resuspension. B. Plot of cell density (normalized OD600, log scale) taken from the top of resuspended cell cultures at different timepoints post-resuspension. WT (blue) quickly sediments, whereas ΔstaA (orange) does not. N = 3 biological replicates for each condition. Trendline = Non-linear best fit (two-phase decay model); data points = means of biological replicates; error bars = SD. C. DIC microscopy images of WT (resuspended from biofilm, left) and ΔstaA (planktonic, right) cells after growth in liquid culture. Micrographs demonstrate that WT cells form large auto-aggregates, whereas ΔstaA cells do not. Specifically, WT cells form larger (top left, middle left) and smaller (bottom left) aggregates, whereas ΔstaA cells are planktonic (right) or found in smaller aggregates (top right, middle right). Rows depict different fields of view from the same experiment. Scale bar = 10 μm. D. Plot of forward scatter of populations of WT (orange) and ΔstaA (blue) cells measured during flow cytometry. The WT forward scatter distribution has a right shoulder absent in ΔstaA, indicating that WT cells form larger aggregates than ΔstaA cells.
Figure 4.
Figure 4.. StaA promotes formation of cell-cell connections
SEM images of WT (Ai-Aiii) and ΔstaA (Bi-Biii) cells. Short range cell-cell connections (white arrow) and cell surface knobs (white asterisk) are present in WT cells, but are largely absent in ΔstaA cells. Longer strands (black double arrow) are presumed to be biofilm matrix material. EPS (black x) is observed in both WT and ΔstaA cells. Rows represent different fields of view from the same experiment. Scale bar = 1 μm.
Figure 5.
Figure 5.. StaA and StaB are massive TAAs that are conserved in Snodgrassella
A. Protein domain diagrams of TAAs from S. alvi (StaA/B/C) and other bacteria (NadA, YadA, UpaG), demonstrating the S. alvi TAAs are encoded by large genes. Genes and domains are depicted to scale. The number of amino acids (aa) encoded by each gene is shown above each gene. Domain colors are indicated in the key. B. Predicted protein structures of TAAs from S. alvi (StaA/B/C) and other bacteria (NadA, YadA, UpaG), demonstrating the S. alvi TAAs are massive proteins. Within individual structures, each monomer has a single color (red, blue, or green). Membrane anchor domains are shown inserted in the outer membrane. Structures are depicted to scale. C. Zoomed in view of the StaA head, neck, and stalk domains. The neck + stalk superdomain repeats 27 times, as indicated, throughout the length of the protein. Each monomer has a single color (red, blue, or green). D. Zoomed in view of the StaA membrane anchor, shown inserted into the outer membrane. Each monomer has a single color (red, blue, or green). E. Zoomed in view of a neck domain hydrophobic core, highlighting that the neck pincushions three monomers together. Putative interacting residues are shown and labeled, with colors (red, blue, or green) representing distinct monomers. Other neck residues are shown in white (for all 3 monomers). F. Phylogenetic tree of the StaA anchor domain in Snodgrassella (left), indicating StaA is conserved across the genus. Annotation of presence or absence of StaB/StaC in the indicated species (right), indicating conservation of StaB in Snodgrassella. Tree is drawn to scale, as indicated. StaB and StaC from wkB2 root the tree. Snodgrassella taxonomic groups are denoted by colors and are labeled (Apis-specific species: A1, A2; Bombus-specific species: B2, B3, B4, B5) according to the subclades previously identified on the basis of 254 core proteins. Black circle: StaB/StaC ortholog present in the indicated species; White circle: StaB/StaC ortholog absent in the indicated species.
Figure 6.
Figure 6.. The S. alvi biofilm is mildly protective against antimicrobials
A. Plot of log10 fold change in CFUs/ml of WT (white) or ΔstaA (red) exposed to increasing concentrations of gentamicin, indicating that ΔstaA cells are slightly more sensitive to higher concentrations of gentamicin. Fold change is normalized to baseline CFUs/ml of cells not exposed to gentamicin. Dotted line (fold change baseline): 0-fold change in log10 normalized CFUs/ml. For each group, individual data points and medians with 95% CI are shown. N = 1–3 biological replicates per condition. B. Plot of log10 fold change in CFUs/ml of WT (white) or ΔstaA (orange) exposed to increasing concentrations of apidaecin 1B, indicating that ΔstaA cells are more sensitive to higher concentrations of apidaecin 1B. Fold change is normalized to baseline CFUs/ml of cells not exposed to gentamicin. Dotted line (fold change baseline): no change in log10 normalized CFUs/ml. For each group, individual data points and medians with 95% CI are shown. N = 2 biological replicates per condition.
Figure 7.
Figure 7.. Model for StaA/StaB-mediated host colonization
Cartoon of model for StaA/StaB-dependent colonization of the bee gut by S. alvi. Both StaA and StaB are required for effective colonization. As a biofilm-forming adhesin, StaA mediates S. alvi auto-aggregation (right) and putatively interacts with host epithelium or cuticle and other gut bacteria (right). As a non-biofilm forming adhesin, StaB is hypothesized to interact with host epithelium or cuticle (right). The host-microbe interaction panel (right) is an inset of a cross section of the ileum (middle left), itself an inset of the bee gut (top left). Key of symbols is shown (bottom left).

References

    1. Raymann K. & Moran N. A. The role of the gut microbiome in health and disease of adult honey bee workers. Curr. Opin. Insect Sci. 26, 97–104 (2018). - PMC - PubMed
    1. Thaiss C. A., Zmora N., Levy M. & Elinav E. The microbiome and innate immunity. Nature 535, 65–74 (2016). - PubMed
    1. Oliphant K. & Allen-Vercoe E. Macronutrient metabolism by the human gut microbiome: Major fermentation by-products and their impact on host health. Microbiome 7, 91 (2019). - PMC - PubMed
    1. Joo H.-S. & Otto M. Molecular basis of in vivo biofilm formation by bacterial pathogens. Chem. Biol. 19, 1503–1513 (2012). - PMC - PubMed
    1. Chakraborty P., Bajeli S., Kaushal D., Radotra B. D. & Kumar A. Biofilm formation in the lung contributes to virulence and drug tolerance of Mycobacterium tuberculosis. Nat. Commun. 12, 1606 (2021). - PMC - PubMed

Publication types

LinkOut - more resources