[Preprint]. 2024 Oct 14:2024.10.10.617261.
doi: 10.1101/2024.10.10.617261.

Glucose-dependent glycosphingolipid biosynthesis fuels CD8+ T cell function and tumor control

Affiliations

Glucose-dependent glycosphingolipid biosynthesis fuels CD8+ T cell function and tumor control

Joseph Longo et al. bioRxiv. .

Update in

Abstract

Glucose is essential for T cell proliferation and function, yet its specific metabolic roles in vivo remain poorly defined. Here, we identify glycosphingolipid (GSL) biosynthesis as a key pathway fueled by glucose that enables CD8+ T cell expansion and cytotoxic function in vivo. Using 13C-based stable isotope tracing, we demonstrate that CD8+ effector T cells use glucose to synthesize uridine diphosphate-glucose (UDP-Glc), a precursor for glycogen, glycan, and GSL biosynthesis. Inhibiting GSL production by targeting the enzymes UGP2 or UGCG impairs CD8+ T cell expansion and cytolytic activity without affecting glucose-dependent energy production. Mechanistically, we show that glucose-dependent GSL biosynthesis is required for plasma membrane lipid raft integrity and aggregation following TCR stimulation. Moreover, UGCG-deficient CD8+ T cells display reduced granzyme expression and tumor control in vivo. Together, our data establish GSL biosynthesis as a critical metabolic fate of glucose-independent of energy production-required for CD8+ T cell responses in vivo.

Keywords: CD8+ T cells; UGCG; cytotoxic function; glucose; glycosphingolipids; immunometabolism; lipid rafts; lipidomics; metabolomics; nucleotide sugar metabolism.


Conflict of interest statement

DECLARATION OF INTERESTS R.G.J. is a scientific advisor to Servier Pharmaceuticals and is a member of the Scientific Advisory Board of Immunomet Therapeutics.

Figures

Figure 1:
Figure 1:. UDP-Glc biosynthesis is a major metabolic fate of glucose in physiologically activated CD8+ T cells.
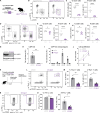
(A) Experimental setup for [U-13C]-glucose infusions in Lm-OVA infected mice. (B) Relative contribution of infused [U-13C]-glucose to the indicated metabolites in CD8+ naïve (Tn; CD8+CD44low) T cells (left) and Lm-OVA-specific effector T (Teff) cells (right) at 3 days post-infection (dpi). 13C metabolite enrichment is normalized relative to steady-state [U-13C]-glucose (m+6) enrichment in serum (see also Figure S1A). Data represent the mean ± SEM (n = 4 mice/group). (C) Schematic of major glucose-fueled metabolic pathways downstream of glucose-6-phosphate (Glc-6-P). The reaction for UGP2-dependent UDP-Glc biosynthesis is indicated. (D) Timecourse of [U-13C]-glucose incorporation into the metabolic pathways outlined in (C). CD8+ OT-I Teff cells isolated from Lm-OVA-infected mice at 3 dpi were cultured ex vivo for up to 2 h in VIM medium containing 5 mM [U-13C]-glucose. Total 13C enrichment (% of pool) from [U-13C]-glucose in UTP, UDP-Glc, serine, and UDP-GlcNAc is shown. Data represent the mean ± SEM (n = 3 biological replicates). (E) Relative UDP-Glc abundance in Tn and OT-I Teff cells isolated from Lm-OVA-infected mice at 3 dpi. Data represent the mean ± SEM (n = 4 mice/group). AU, arbitrary unit. (F) Schematic depicting the contribution of glucose carbon to UDP-Glc synthesis. (G) Mass isotopologue distribution of [U-13C]-glucose-derived UDP-Glc in CD8+ Teff cells over time. CD8+ OT-I Teff cells from Lm-OVA-infected mice as in (D) were cultured ex vivo for up to 2 h in VIM medium containing 5 mM [U-13C]-glucose. Data represent the mean ± SEM (n = 3 biological replicates). (H) Mass isotopologue distribution of [U-13C]-glucose-derived UDP-Glc in mouse and human CD8+ T cells. In vitro-activated CD8+ T cells were cultured for 2 h in VIM medium containing 5 mM [U-13C]-glucose prior to metabolite extraction. Data represent the mean ± SEM (n = 4 mice and 3 human donors).
Figure 2:
Figure 2:. UGP2 coordinates UDP-Glc biosynthesis in T cells to maintain T cell homeostasis and fuel CD8+ Teff cell responses to infection.
(A) Targeting strategy for T cell-specific deletion of Ugp2 in mice (Ugp2fl/flCd4Cre strain). (B) Representative flow cytometry plots for CD19 versus CD3 expression from splenocytes isolated from control Ugp2fl/fl (+/+) and knockout Ugp2fl/flCd4Cre (−/−) mice. (C) Percentage (left) and total number (right) of CD3+ T cells in the spleen of Ugp2fl/fl (+/+) and Ugp2fl/flCd4Cre (−/−) mice. Data represent the mean ± SEM (n = 6 mice/group; circle = female, square = male). (D) Representative flow cytometry plots for CD8A versus CD4 expression (gated on CD3+ cells) from splenocytes isolated from Ugp2fl/fl (+/+) and Ugp2fl/flCd4Cre (−/−) mice. (E-F) Peripheral T cell populations in T cell-specific UGP2-deficient mice. Percentage (left) and total number (right) of CD4+ T cells (E) and CD8+ T cells (F) in the spleen of control Ugp2fl/fl (+/+) and knockout Ugp2fl/flCd4Cre (−/−) mice. Data represent the mean ± SEM (n = 6 mice/group; circle = female, square = male). (G) Immunoblot of UGP2 protein expression in control shRNA (shCtrl) and shUgp2-expressing CD8+ T cells. ACTIN protein expression is shown as a loading control. (H) Relative abundance of UDP-Glc in shCtrl and shUgp2-expressing CD8+ T cells cultured in vitro. Data represent the mean ± SEM (n = 3). AU, arbitrary unit. (I) Relative abundance of the indicated [U-13C]-glucose-derived UDP-Glc mass isotopologues in shCtrl and shUgp2-expressing CD8+ T cells after 24 h of culture in VIM medium containing 5 mM [U-13C]-glucose. Data represent the mean ± SEM (n = 3). AU, arbitrary unit. (J) Relative cell number over time for activated shCtrl and shUgp2-expressing CD8+ T cells cultured in vitro in IMDM containing 50 U/mL IL-2. Data represent the mean ± SEM (n = 3). (K-M) Expansion of UGP2-depleted CD8+ OT-I cells in vivo in response to Lm-OVA infection. (K) Experimental setup for adoptive transfer of control (shCtrl) or shUgp2-expressing Thy1.1+CD8+ OT-I cells followed by Lm-OVA infection. (L) Representative flow cytometry plots showing the abundance of antigen-specific (Thy1.1+) control and shUgp2-expressing CD8+ OT-I cells in the spleen of Lm-OVA-infected mice at 7 days post-infection (dpi). (M) Percentage (left) and total number (right) of antigen-specific (Thy1.1+) control and shUgp2-expressing CD8+ OT-I cells in the spleen of Lm-OVA-infected mice at 7 dpi. Data represent the mean ± SEM (n = 4 mice/group). (N-O) Cytokine response of UGP2-depleted CD8+ OT-I cells ex vivo. (N) Representative flow cytometry plots showing the percentage of IFN-γ-producing Thy1.1+ control (shCtrl) and shUgp2-expressing CD8+ OT-I cells in the spleen of Lm-OVA-infected mice at 7 dpi after ex vivo re-stimulation with OVA peptide. (O) Percentage (left) and total number (right) of IFN-γ-producing Thy1.1+ control and shUgp2-expressing CD8+ OT-I cells in the spleen of Lm-OVA-infected mice at 7 dpi after ex vivo re-stimulation with OVA peptide. Data represent the mean ± SEM (n = 4 mice/group).
Figure 3:
Figure 3:. UDP-Glc fuels glycogen biosynthesis and UDP-Gal-dependent metabolic processes in CD8+ T cells.
(A) Schematic showing metabolic pathways fueled by UDP-Glc. Metabolic intermediates are shown in black and enzymes are shown in blue. (B) Total glycogen abundance in in vitro-activated shCtrl-(control) and shUgp2-expressing CD8+ T cells. Data represent the mean ± SEM (n = 3). (C) Relative abundance of UDP-Gal (left) and UDP-GlcA (right) levels in in vitro-activated control and shUgp2-expressing CD8+ T cells. Data represent the mean ± SEM (n = 3). AU, arbitrary unit. (D) N-glycan expression on the surface of activated control and shUgp2-expressing CD8+ T cells. Representative histogram (left) and quantification of geometric mean fluorescence intensity (MFI; right) of ConA on control and shUgp2-expressing CD8+ T cells. Data represent the mean ± SEM (n = 3). (E) Glycan profiling of in vitro-activated control and shUgp2-expressing CD8+ T cells via lectin binding. Left, Schematic of N-glycan extension. Sugar structures are highlighted in the legend (GlcNAc, N-acetylglucosamine; Gal, galactose; Fuc, fucose; Man, mannose; Sia, sialic acid). Right, geometric MFI of the indicated glycan features on the surface of CD8+ T cells and the lectins that bind them. Data are plotted as the log2 fold change (log2FC) of shUgp2/shCtrl. Data represent the mean ± SEM (n = 3). (F) Volcano plot of lipid levels in in vitro-activated control and shUgp2-expressing CD8+ T cells. Specific lipid species are indicated (GA1, gangliosides; HexCer, hexosylceramides; Cer, ceramides; SM, sphingomyelins). Data are plotted as the log2 fold change (log2FC) of shUgp2/shCtrl and represent the average of 3 biological replicates. The horizontal line indicates the false discovery rate (FDR)-adjusted p value cutoff of 0.05 and the vertical line indicates a log2FC of 0. (G) Relative abundance of the indicated GSLs in in vitro-activated shUgp2-expressing CD8+ T cells relative to the mean abundance in shCtrl-expressing cells. Data represent the mean ± SEM (n = 3). Statistical significance was determined using multiple t-tests and an FDR correction for multiple comparisons. ‡, q < 0.01.
Figure 4:
Figure 4:. CD8+ T cells direct glucose to fuel GSL biosynthesis in vivo.
(A) Protein levels of GSL biosynthesis pathway and galactosyltransferase enzymes in activated CD8+ T cells in vivo. Data are expressed as the log2 fold change (log2FC) in protein levels in antigen-specific CD8+ OT-I T effector (Teff) cells relative to CD8+ naïve T (Tn) cells isolated from Lm-OVA-infected mice at 3 days post-infection (dpi). Data represent the mean ± SEM (n = 4–5 mice/group). Data were mined from Ma et al.. (B) Relative contribution of [U-13C]-glucose to the indicated GSL species (m+6) in CD8+ naïve (Tn; CD8+CD44low) T cells and Lm-OVA-specific Teff cells following [U-13C]-glucose infusion at 3 dpi. Mice were infused with [U-13C]-glucose in vivo at 3 dpi as described in Figure 1A. 13C metabolite enrichment is normalized relative to steady-state [U-13C]-glucose (m+6) enrichment in serum (see also Figure S1A). Data represent the mean ± SEM (n = 4 mice/group). Statistical significance was determined using multiple t-tests and a false discovery rate correction for multiple comparisons. ‡, q < 0.01. (C) Relative abundance of total (left) and m+6-labeled (right) Hex1Cer (d18:1/16:0) in Tn and Teff cells from Lm-OVA-infected mice infused with [U-13C]-glucose in vivo at 3 dpi. Data represent the mean ± SEM (n = 4 mice/group). AU, arbitrary unit. (D) Schematic of GA1 ganglioside biosynthesis from GlcCer. (E) Relative abundance of total (left) and m+6-, m+12-, m+18-, and m+24-labeled (right) GA1 (d18:1/16:0) ganglioside in Tn and Teff cells from Lm-OVA-infected mice infused with [U-13C]-glucose in vivo at 3 dpi. Data represent the mean ± SEM (n = 4 mice/group). AU, arbitrary unit.
Figure 5:
Figure 5:. Glucose-dependent GSL biosynthesis is essential for CD8+ T cell expansion in vivo.
(A) Schematic of the GSL biosynthesis pathway. Eliglustat inhibits GlcCer production by inhibiting the enzyme UGCG. (B) Proliferation of CD8+ T cells as measured by VPD450 dilution after 72 h of activation in vitro with anti-CD3 and anti-CD28 antibodies in the presence of eliglustat (0–25 μM). Representative histograms of VPD450 staining (left) and quantification of the percentage of divided cells (right) are shown. The dashed line indicates the EC50 of eliglustat (4.33 μM) for inhibiting proliferation. Data represent the mean ± SEM (n = 3). (C) Relative abundance of Hex1Cer (d18:1/16:0) (left) and GA1 (d18:1/16:0) ganglioside (right) in CD8+ T cells treated with DMSO or 4 μM eliglustat for 24 h. Data represent the mean ± SEM (n = 3). AU, arbitrary unit. (D) Relative UGCG protein abundance (normalized to ACTN4 abundance) in CD8+ T cells as determined by LC-MS-based proteomics. Activated CD8+ T cells were modified using CRISPR/Cas9 gene editing with either a non-targeting control (NTC) single guide RNA (sgRNA) or a sgRNA targeting Ugcg (sgUgcg). Data represent the mean ± SEM (n = 4). (E) Relative abundance of total (left) and m+6-labeled (right) Hex1Cer (d18:1/16:0) in NTC- and sgUgcg-modified CD8+ T cells after 24 h of culture in VIM medium containing 5 mM [U-13C]-glucose. Data represent the mean ± SEM (n = 4). AU, arbitrary unit. (F) Relative abundance of total (left) and m+6-, m+12-, m+18-, and m+24-labeled (right) GA1 (d18:1/16:0) ganglioside in NTC- and sgUgcg-modified CD8+ T cells after 24 h of culture in VIM medium containing 5 mM [U-13C]-glucose. Data represent the mean ± SEM (n = 4). AU, arbitrary unit. (G-H) Bioenergetic profile of NTC- and sgUgcg-modified CD8+ T cells. (G) Graphs depict the extracellular acidification rate (left) and oxygen consumption rate (right) of edited CD8+ T cells over time. Oligomycin (Oligo), FCCP, rotenone and antimycin A (Rot/AA), and monensin (Mon) were added to cells where indicated. (H) Basal ATP production rates from glycolysis, OXPHOS, and glycolysis + OXPHOS (total) in NTC- and sgUgcg-modified CD8+ T cells. Data represent the mean ± SD (n = 10/group). (I) Relative cell number over time for NTC- and sgUgcg-modified CD8+ T cells cultured in vitro in IMDM containing 50 U/mL IL-2. Data represent the mean ± SEM (n = 4). Statistical significance was determined using a two-way ANOVA. (J-K) Expansion of sgUgcg-modified CD8+ T cells in vivo in response to Lm-OVA infection. NTC- or sgUgcg-modified Thy1.1+CD8+ OT-I cells were transferred into congenic hosts, the mice were infected with Lm-OVA, and T cell responses in the spleen of Lm-OVA-infected mice were analyzed at 7 days-post infection (dpi; as in Figure 2K). (J) Representative flow cytometry plots showing the abundance of antigen-specific (Thy1.1+) NTC- and sgUgcg-modified CD8+ OT-I cells in the spleen at 7 dpi. (K) Percentage (left) and total number (right) of antigen-specific (Thy1.1+) NTC- and sgUgcg-modified Thy1.1+CD8+ OT-I cells from (J). Data represent the mean ± SEM (n = 5–6 mice/group).
Figure 6:
Figure 6:. GSL biosynthesis is required to maintain lipid rafts at the plasma membrane.
(A) Global proteomic analysis of control (NTC) and UGCG-deficient (sgUgcg) CD8+ T cells. Data represent the average of 4 biological replicates. The proteins indicated in red had a second-generation p value of 0. The vertical line indicates a log2 fold change (log2FC) of 0. (B) Pathway analysis indicating the top suppressed pathways in UGCG-deficient CD8+ T cells from Figure 6A. NES, normalized enrichment score. (C-D) Quantification of membrane lipid rafts as determined by cholera toxin B (CTxB) binding. Representative histogram (left) and quantification of relative geometric mean fluorescence intensity (MFI; right) of CTxB expression on (C) shCtrl- and shUgp2-expressing or (D) NTC- and sgUgcg-modified CD8+ T cells. Data represent the mean ± SEM (n = 3–4). (E) Lipid raft aggregation following TCR crosslinking in NTC- and sgUgcg-modified CD8+ T cells. Left, Representative confocal images of an NTC- and sgUgcg-modified cell stained with CTxB (green), streptavidin (magenta), and DAPI (blue) after incubation with anti-CD3ε antibody and crosslinking with biotin-labeled IgG. Right, Quantification of lipid raft (CTxB) aggregation and CD3ε intensity (normalized to cell size) in NTC-(n = 46) and sgUgcg-modified (n = 12) cells was conducted 30 min after crosslinking. Data represent the mean ± SD. Statistical significance was determined using Mann-Whitney tests. AU, arbitrary unit.
Figure 7:
Figure 7:. UGCG controls CD8+ T cell cytotoxic function and anti-tumor immunity.
(A-B) Cytolytic activity of UGCG-deficient CD8+ T cells. (A) Tumor cell kill curve for control (NTC) and UGCG-deficient (sgUgcg) CD8+ OT-I cells isolated from Lm-OVA-infected mice at 7 days post-infection (dpi). OT-I cells were co-cultured ex vivo with MC38-OVA cancer cells at the indicated effector:target (E:T) ratio and cancer cell viability measured after 24 h. The E:T ratio required to kill 50% of cancer cells (EC50) and 95% confidence interval are indicated for each genotype. Data represent the mean ± SEM (n = 6). (B) Timecourse of cancer cell lysis for the experiment in (A) at a fixed effector:target ratio of 10:1. The rate constant (k) ± SEM is indicated for each genotype. Data represent the mean ± SEM (n = 6). (C) Granzyme B (GZMB) production in NTC- and sgUgcg-modified CD8+ OT-I cells. OT-I cells isolated from Lm-OVA-infected mice at 7 dpi as in (A) were stained for intracellular GZMB expression. Representative histogram (left) and quantification of relative mean fluorescence intensity (MFI; right) of GZMB in NTC- and sgUgcg-modified CD8+ T cells. Data represent the mean ± SEM (n = 6). (D) Timecourse of B16-OVA melanoma tumor growth in mice that received NTC- or sgUgcg-modified CD8+ OT-I cells. OT-I cells (1×10⁶) were transferred into tumor-bearing mice 7 days post-implantation (n = 11 mice/group). Vehicle control-injected mice (n = 8) were included as a “no adoptive transfer” control. Statistical significance was determined using a mixed-effects model with Geisser-Greenhouse correction and Dunnett’s multiple comparisons test. (E) Kaplan-Meier curve of time-to-humane endpoint for tumor-bearing mice from (D). Statistical significance was determined using log-rank tests and a Bonferroni correction for multiple comparisons. (F) Percentage of antigen-specific (Thy1.1+) NTC- and sgUgcg-modified CD8+ OT-I cells in B16-OVA tumors 7 days post-adoptive transfer. Data represent the mean ± SEM (n = 9 mice/group). (G) GZMB production in B16-OVA TILs from (F). Relative MFI of GZMB in Thy1.1+CD8+ NTC- and sgUgcg-modified OT-I cells 7 days post-adoptive transfer. Data represent the mean ± SEM (n = 9 mice/group).

References

    1. Pearce E.L., Poffenberger M.C., Chang C.-H., and Jones R.G. (2013). Fueling immunity: insights into metabolism and lymphocyte function. Science 342, 1242454. - PMC - PubMed
    1. MacIver N.J., Michalek R.D., and Rathmell J.C. (2013). Metabolic regulation of T lymphocytes. Annu. Rev. Immunol. 31, 259–283. - PMC - PubMed
    1. Geltink R.K., Kyle R.L., and Pearce E.L. (2018). Unraveling the complex interplay between T cell metabolism and function. Annu. Rev. Immunol. 36, 461–488. - PMC - PubMed
    1. Jacobs S.R., Herman C.E., Maciver N.J., Wofford J.A., Wieman H.L., Hammen J.J., and Rathmell J.C. (2008). Glucose uptake is limiting in T cell activation and requires CD28-mediated Akt-dependent and independent pathways. J. Immunol. 180, 4476–4486. - PMC - PubMed
    1. Macintyre A.N., Gerriets V.A., Nichols A.G., Michalek R.D., Rudolph M.C., Deoliveira D., Anderson S.M., Abel E.D., Chen B.J., Hale L.P., et al. (2014). The glucose transporter Glut1 is selectively essential for CD4 T cell activation and effector function. Cell Metab. 20, 61–72. - PMC - PubMed

Publication types