

Point-of-care breath sample analysis by semiconductor-based E-Nose technology discriminates non-infected subjects from SARS-CoV-2 pneumonia patients: a multi-analyst experiment
- PMID: 39465142
- PMCID: PMC11502717
- DOI: 10.1002/mco2.726
Point-of-care breath sample analysis by semiconductor-based E-Nose technology discriminates non-infected subjects from SARS-CoV-2 pneumonia patients: a multi-analyst experiment
Abstract
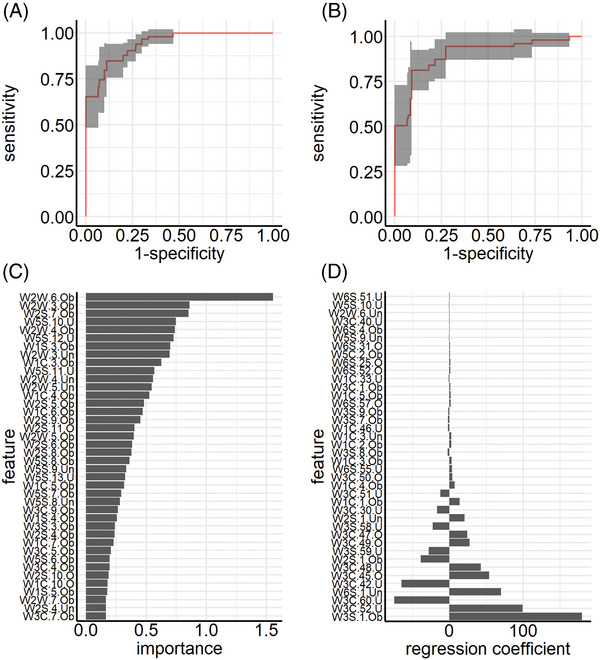
Metal oxide sensor-based electronic nose (E-Nose) technology provides an easy to use method for breath analysis by detection of volatile organic compound (VOC)-induced changes of electrical conductivity. Resulting signal patterns are then analyzed by machine learning (ML) algorithms. This study aimed to establish breath analysis by E-Nose technology as a diagnostic tool for severe acute respiratory syndrome coronavirus type 2 (SARS-CoV-2) pneumonia within a multi-analyst experiment. Breath samples of 126 subjects with (n = 63) or without SARS-CoV-2 pneumonia (n = 63) were collected using the ReCIVA® Breath Sampler, enriched and stored on Tenax sorption tubes, and analyzed using an E-Nose unit with 10 sensors. ML approaches were applied by three independent data analyst teams and included a wide range of classifiers, hyperparameters, training modes, and subsets of training data. Within the multi-analyst experiment, all teams successfully classified individuals as infected or uninfected with an averaged area under the curve (AUC) larger than 90% and misclassification error lower than 19%, and identified the same sensor as most relevant to classification success. This new method using VOC enrichment and E-Nose analysis combined with ML can yield results similar to polymerase chain reaction (PCR) detection and superior to point-of-care (POC) antigen testing. Reducing the sensor set to the most relevant sensor may prove interesting for developing targeted POC testing.
Keywords: COVID‐19; E‐Nose; breath gas; machine learning; mass spectrometry; metal oxide sensor; pneumonia; volatile organic compounds.
© 2024 The Author(s). MedComm published by Sichuan International Medical Exchange & Promotion Association (SCIMEA) and John Wiley & Sons Australia, Ltd.
Conflict of interest statement
A.K. and J.H. are employees of Airbus Defense & Space, and authors W.S. and D.L. are part of Lanz GmbH, and have no potential relevant financial or non‐financial interests to disclose. The other authors have no conflicts of interest to declare.
Figures


References
-
- Dolch ME, Chouker A, Hornuss C, et al. Quantification of propionaldehyde in breath of patients after lung transplantation. Free Radic Biol Med. 2015;85:157‐164. - PubMed
-
- Aleksic M, Simeon A, Vujic D, Giannoukos S, Brkic B. Food and lifestyle impact on breath VOCs using portable mass spectrometer‐pilot study across European countries. J Breath Res. 2023;17. - PubMed
-
- Chou H, Arthur K, Shaw E, et al. Metabolic insights at the finish line: deciphering physiological changes in ultramarathon runners through breath VOC analysis. J Breath Res. 2024;18. - PubMed
-
- Amann A, de Lacy Costello B, Miekisch W, et al. The human volatilome: volatile organic compounds (VOCs) in exhaled breath, skin emanations, urine, feces and saliva. J Breath Res. 2014;8:034001. - PubMed
-
- Dolch ME, Hornuss C, Klocke C, et al. Volatile compound profiling for the identification of Gram‐negative bacteria by ion‐molecule reaction‐mass spectrometry. J Appl Microbiol. 2012;113:1097‐1105. - PubMed
LinkOut - more resources
Full Text Sources
Miscellaneous