. 2024 Oct 27;14(1):25660.
doi: 10.1038/s41598-024-77154-7.

Endolymphatic hydrops and cochlear synaptopathy after noise exposure are distinct sequelae of hair cell stereociliary bundle trauma

Affiliations

Endolymphatic hydrops and cochlear synaptopathy after noise exposure are distinct sequelae of hair cell stereociliary bundle trauma

Michelle L Fong et al. Sci Rep. .

Abstract

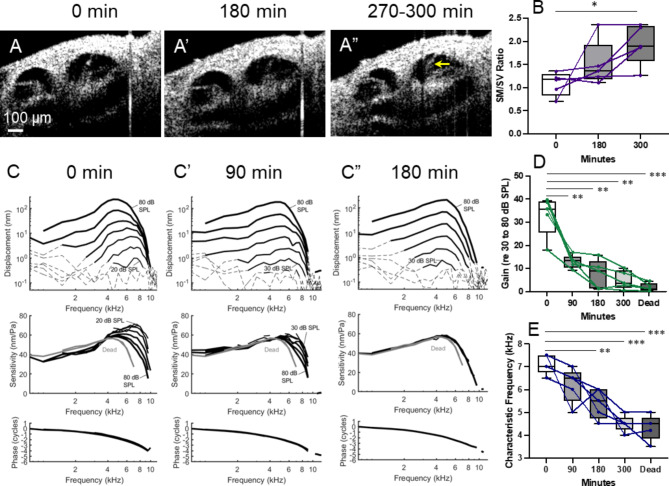
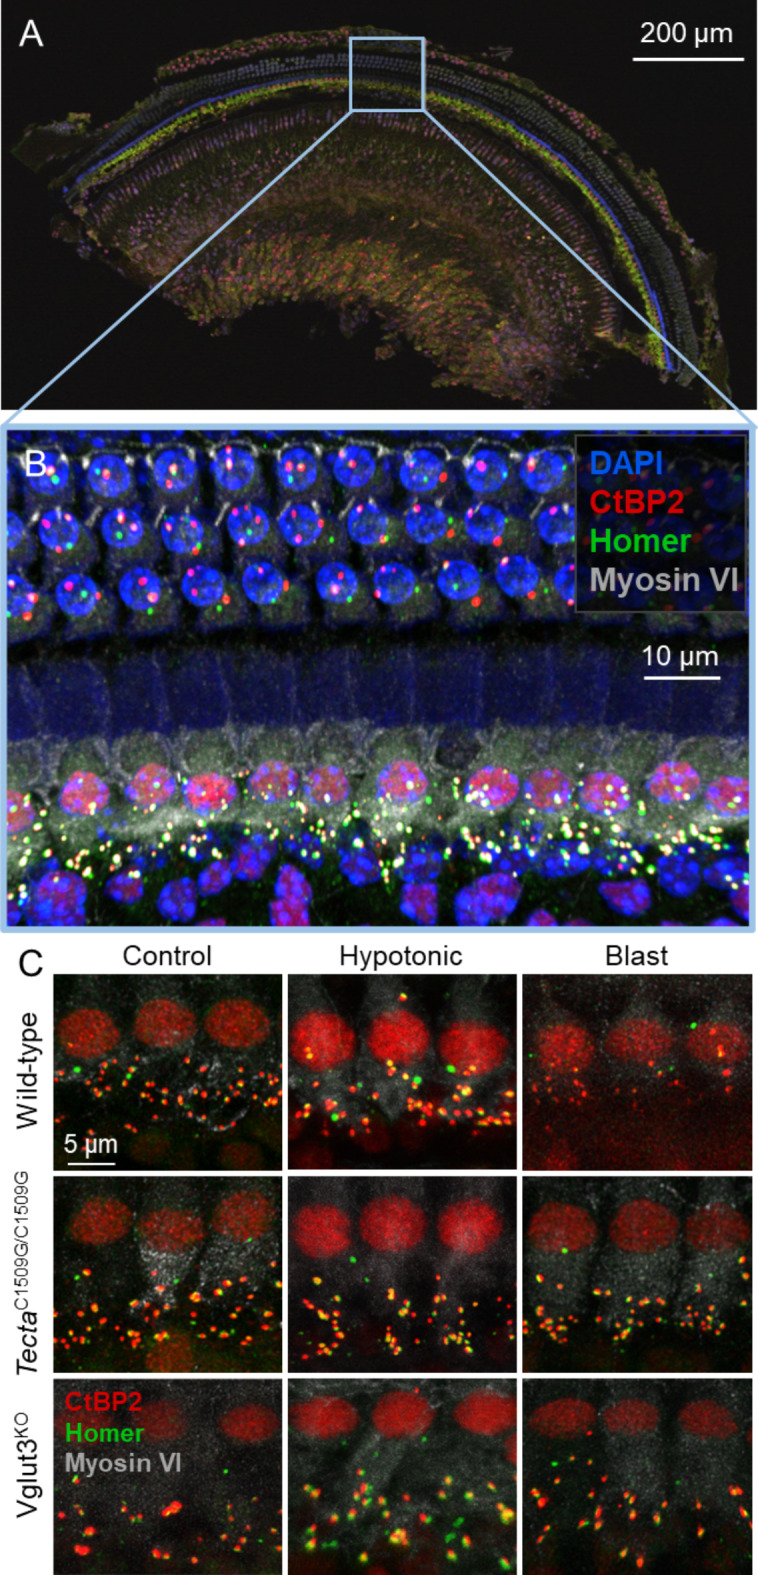
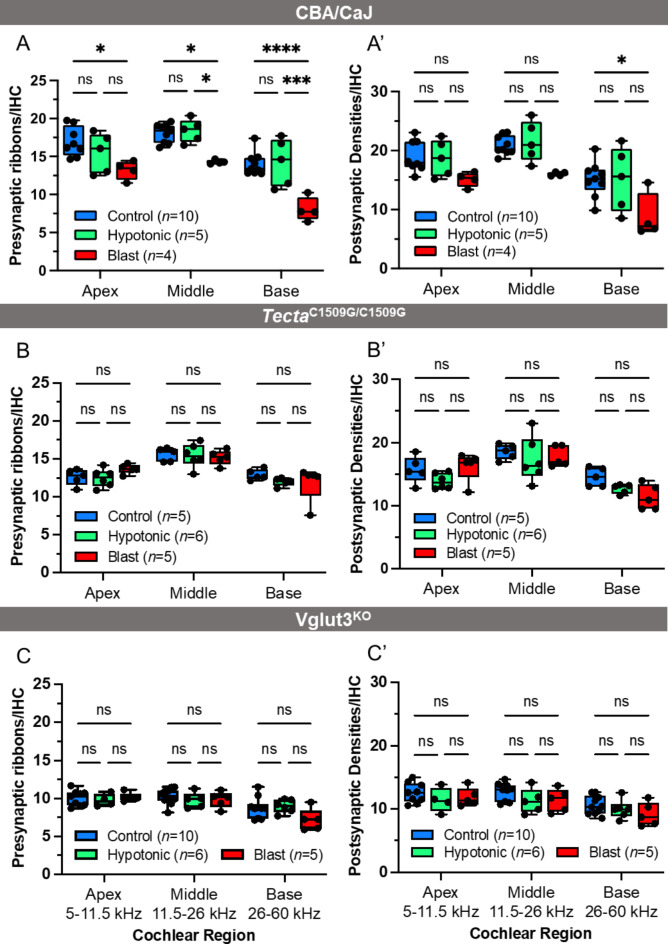
Endolymphatic hydrops, increased endolymphatic fluid within the cochlea, is the key pathologic finding in patients with Meniere's disease, a disease of episodic vertigo, fluctuating hearing loss, tinnitus, and aural fullness. Endolymphatic hydrops also can occur after noise trauma and its presence correlates with cochlear synaptopathy, a form of hearing loss caused by reduced numbers of synapses between hair cells and auditory nerve fibers. Here we tested whether there is a mechanistic link between these two phenomena by using multimodal imaging techniques to analyze the cochleae of transgenic mice exposed to blast and osmotic challenge. In vivo cochlear imaging after blast exposure revealed dynamic increases in endolymph that involved hair cell mechanoelectrical transduction channel block but not the synaptic release of glutamate at the hair cell-auditory nerve synapse. In contrast, ex vivo and in vivo auditory nerve imaging revealed that synaptopathy requires glutamate release from hair cells but not endolymphatic hydrops. Thus, although endolymphatic hydrops and cochlear synaptopathy are both observed after noise exposure, one does not cause the other. They are simply co-existent sequelae that derive from the traumatic stimulation of hair cell stereociliary bundles. Importantly, these data argue that Meniere's disease derives from hair cell transduction channel blockade.

Keywords: Auditory nerve; Cochlea; Hair cell; Hearing; Optical coherence tomography; Osmosis.


Conflict of interest statement

John Oghalai and Brian Applegate are founders of AO technologies, with the goal of translating inner ear imaging technologies for clinical purposes. The other authors have no competing interests.

Figures

Fig. 1
Fig. 1
The ratio of the cross-sectional areas of scala media to scala vestibuli was used to quantify endolymph volume. SM = Scala Media, SV = Scala Vestibuli, RM = Reissner’s Membrane, TM = Tectorial Membrane, OoC = Organ of Corti.
Fig. 2
Fig. 2
Endolymph volume increases after blast exposure in the Vglut3KO mouse. (A) OCT visualization of the apical turn of the cochlea in a control mouse not exposed to blast (left) and a mouse three hours after blast exposure (right). Endolymphatic hydrops could be noted after blast by distension of Reissner’s membrane (arrow). (B) The SM to SV area ratio significantly increased after blast exposure, indicating endolymphatic hydrops. *p < 0.05.
Fig. 3
Fig. 3
Perilymphatic perfusion of the MET channel blocker UoS-7692 in wild-type mice causes loss of cochlear amplification and endolymphatic hydrops. (A-A”) OCT visualization of the cochlea apical turn at baseline 0 min (prior), 180 min, and 270–300 min after PSCC injection of UoS-7692 in one representative mouse. (B) The SM to SV ratio increases after MET channel blockade. (C–C”) Basilar membrane vibration demonstrates loss of cochlear amplification in the representative mouse during the experiment. This is best seen in the middle row of curves, where the sensitivity plots all overlap each other in C’’. (D) Cochlear gain and (E) characteristic frequency shift downward after MET channel blocker injection, and reach purely passive, post-mortem levels. *p < 0.05, **p < 0.01, ***p < 0.001, n = 5.
Fig. 4
Fig. 4
Endolymph volume increases after hypotonic challenge in three different mouse models. OCT visualization of the apical turn of the cochlea in (A-A”) wild-type, (B-B”) TectaC1509G/C1509G, and (C–C”) Vglut3KO mice at 0 min, 30 min, and 60 min after application of distilled water to the round window. The SM to SV ratio increases at 30 and 60 min after the application in (D) wild-type, (E) TectaC1509G/C1509G, and (F) Vglut3KO mice. *p < 0.05, **p < 0.01.
Fig. 5
Fig. 5
Cochlear sections were imaged using confocal microscopy to assess for synaptic loss. (A) A middle cochlear section at 25 × magnification and (B) the region of interest for analysis at 63 × magnification. (C) Wild-type, TectaC1509G/C1509G, and Vglut3KO mice were imaged 8 days after no exposure, hypotonic challenge, or blast exposure. Immunostaining was used to visualize hair cell nuclei (DAPI, blue), IHC nuclei and presynaptic ribbons (CtBP2, red), postsynaptic densities (Homer, green), and IHC bodies (myosin VI, grey).
Fig. 6
Fig. 6
Blast exposure causes a decrease in presynaptic ribbons and postsynaptic densities in wild-type mice only; hypotonic challenge has no significant effect on counts in any of the mouse strains. (A-A’) In wild-type mice, a blast exposure causes a significant decrease in the number of presynaptic ribbons across all regions of the cochlear, but only a significant loss of postsynaptic densities in the basal region. (B-B’, C–C’) Presynaptic ribbon and postsynaptic density counts in TectaC1509G/C1509G and Vglut3KO mice did not change after hypotonic challenge or blast exposure, indicating that the mutations in these mice eliminate crucial steps in the synaptopathy pathway. *p < 0.05, ***p < 0.001, ****p < 0.0001.
Fig. 7
Fig. 7
Ultrastructural changes after a blast wave illustrated through TEM images of IHCs and synapse area. (A) Image of an IHC from a control mice taken at 1500 × magnification. (B) High power view of the region in the blue box from (A). (CE) High-power views of representative blast-exposed mice harvested at 3, 7, and 24 h post-exposure. Individual dendrites outlined in yellow appear larger in area after blast exposure compared to control dendrites. Cyan asterisks: swollen dendrites with reduced cytoplasmic density. Red ellipse: increased extracellular space. All high-power images were taken at 6000x.
Fig. 8
Fig. 8
In vivo imaging of the Atoh1CreERT2-tdTomato;TauEGFP mouse through the round window allows visualization of synaptic boutons within the organ of Corti. (A) The microscopic view shows the orientation of the organ of Corti in relation to anatomic landmarks. (B) The inner hair cells (IHCs) and outer hair cells (OHCs) are depicted in magenta. (C) Nerve dendrites and boutons are depicted in cyan. The coursing of the dendrites longitudinally (yellow arrow) indicates that this image was taken at the bottom of the OHCs, where the type II afferents run. (D) Bouton size was quantified by selecting five boutons within the z-stack of a two-photon image. (E,F) The intensity was plotted for each point and fitted to a Gaussian curve. The full width at half maximum was recorded for each bouton and averaged.
Fig. 9
Fig. 9
Blast exposure and hypotonic challenge both produce bouton swelling in vivo. (A) Images from a control mouse and three different mice after blast. There is swelling of synaptic boutons after blast exposure. Only Mapt fluorescence is displayed with intensity pseudocolored. Bright yellow indicates high signal, violet is low signal. (B) Averaged data from control and blast-exposed mice. (C) Synaptic boutons also swell after hypotonic challenge, as documented from sequential images from one mouse. The swelling of one individual bouton over 4.5 h is highlighted (arrow). Only Mapt fluorescence is displayed with intensity pseudocolored. Bright yellow indicates high signal, blue is low signal. (D) Averaged data from control mice and mice exposed to the hypotonic challenge. *p < 0.05, **p < 0.01, n = 5. Error bars represent SEM.

References

    1. Shargorodsky, J. et al. Change in prevalence of hearing loss in US adolescents. JAMA304, 772. 10.1001/jama.2010.1124 (2010). - PubMed
    1. Furness, D. N. Molecular basis of hair cell loss. Cell Tissue Res.361, 387–399. 10.1007/s00441-015-2113-z (2015). - PubMed
    1. Yang, C. H., Schrepfer, T. & Schacht, J. Age-related hearing impairment and the triad of acquired hearing loss. Front. Cell Neurosci.10.3389/FNCEL.2015.00276 (2015). - PMC - PubMed
    1. Liberman, M. C. & Kujawa, S. G. Cochlear synaptopathy in acquired sensorineural hearing loss: Manifestations and mechanisms. Hear. Res.349, 138–147. 10.1016/J.HEARES.2017.01.003 (2017). - PMC - PubMed
    1. Mammano, F. et al. ATP-Induced Ca(2+) release in cochlear outer hair cells: Localization of an inositol triphosphate-gated Ca(2+) store to the base of the sensory hair bundle. J. Neurosci.19, 6918–6929 (1999). - PMC - PubMed

MeSH terms