. 2024 Oct 28;23(1):240.
doi: 10.1186/s12943-024-02162-0.

Combined targeting of GPX4 and BCR-ABL tyrosine kinase selectively compromises BCR-ABL+ leukemia stem cells

Affiliations

Combined targeting of GPX4 and BCR-ABL tyrosine kinase selectively compromises BCR-ABL+ leukemia stem cells

Chengwu Zeng et al. Mol Cancer. .

Abstract

Background: In the ongoing battle against BCR-ABL+ leukemia, despite significant advances with tyrosine kinase inhibitors (TKIs), the persistent challenges of drug resistance and the enduring presence of leukemic stem cells (LSCs) remain formidable barriers to achieving a cure.

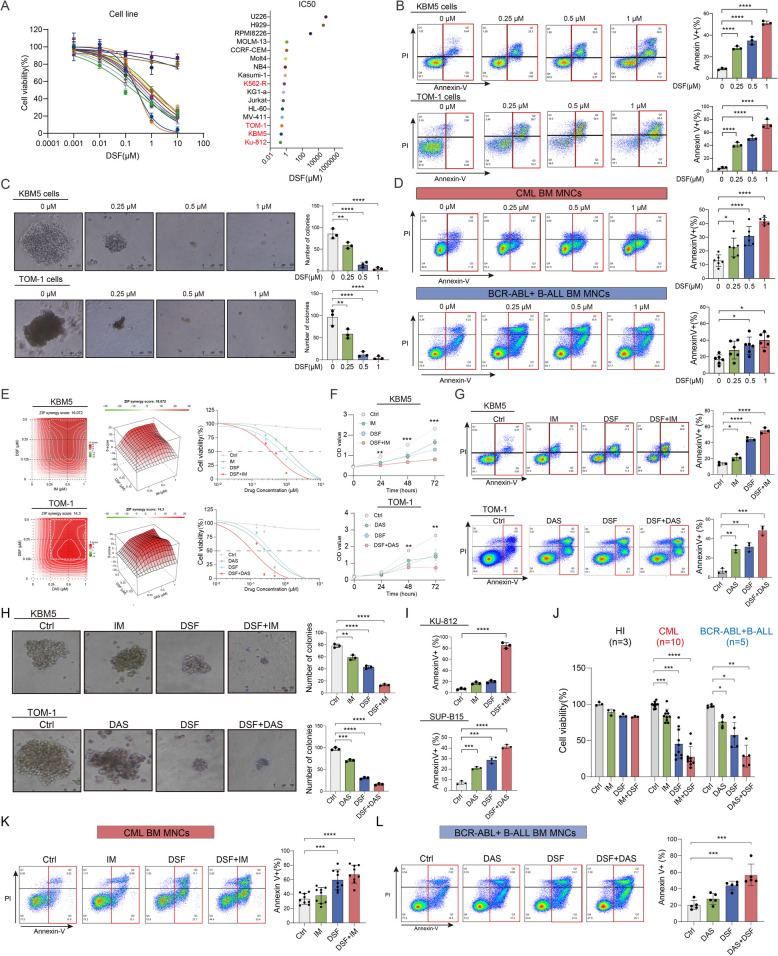
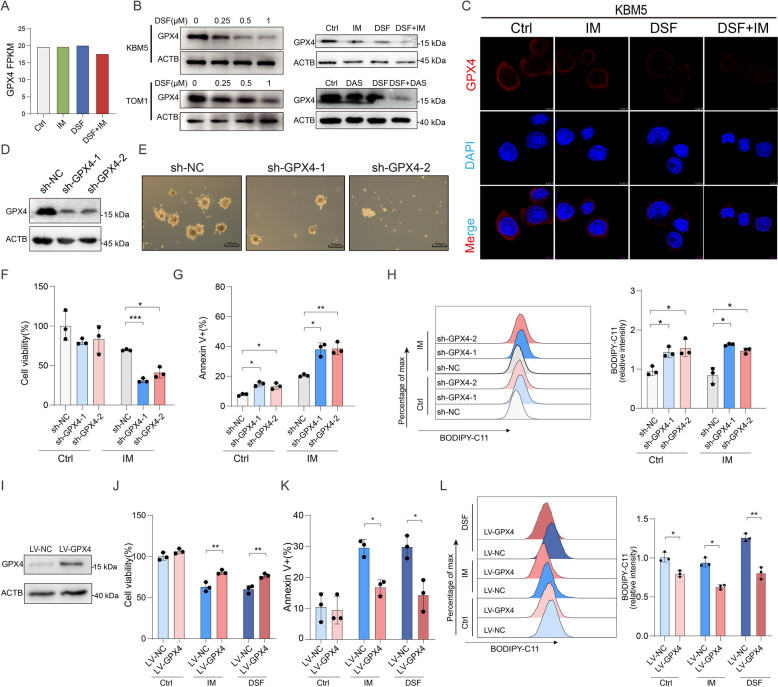
Methods: In this study, we demonstrated that Disulfiram (DSF) induces ferroptosis to synergize with TKIs in inhibiting BCR-ABL+ cells, particularly targeting resistant cells and LSCs, using cell models, mouse models, and primary cells from patients. We elucidated the mechanism by which DSF promotes GPX4 degradation to induce ferroptosis through immunofluorescence, co-immunoprecipitation (CO-IP), RNA sequencing, lipid peroxidation assays, and rescue experiments.

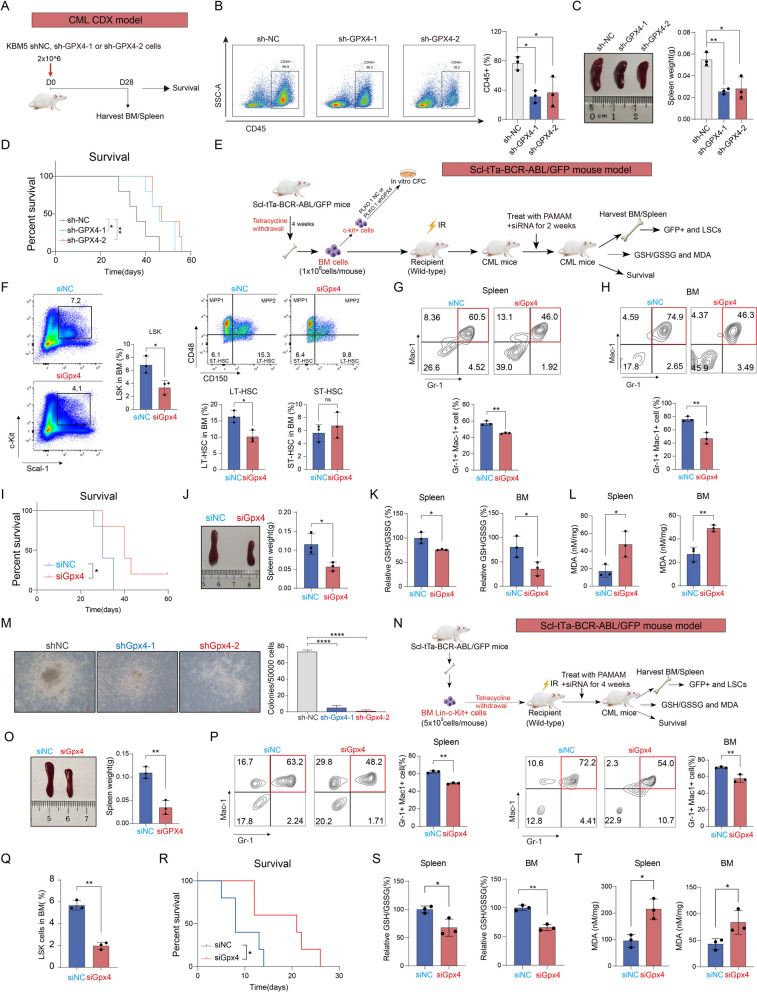
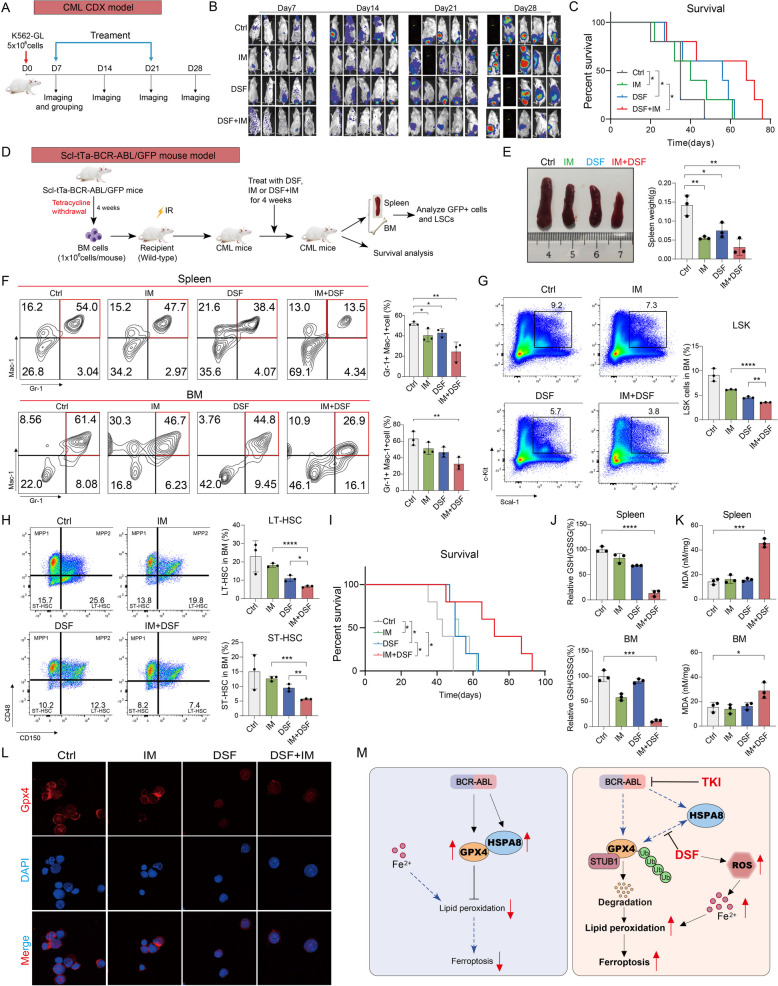
Results: Here, we present compelling evidence elucidating the sensitivity of DSF, an USA FDA-approved drug for alcohol dependence, towards BCR-ABL+ cells. Our findings underscore DSF's ability to selectively induce a potent cytotoxic effect on BCR-ABL+ cell lines and effectively inhibit primary BCR-ABL+ leukemia cells. Crucially, the combined treatment of DSF with TKIs selectively eradicates TKI-insensitive stem cells and resistant cells. Of particular note is DSF's capacity to disrupt GPX4 stability, elevate the labile iron pool, and intensify lipid peroxidation, ultimately leading to ferroptotic cell death. Our investigation shows that BCR-ABL expression induces alterations in cellular iron metabolism and increases GPX4 expression. Additionally, we demonstrate the indispensability of GPX4 for LSC development and the initiation/maintenance of BCR-ABL+ leukemia. Mechanical analysis further elucidates DSF's capacity to overcome resistance by reducing GPX4 levels through the disruption of its binding with HSPA8, thereby promoting STUB1-mediated GPX4 ubiquitination and subsequent proteasomal degradation. Furthermore, the combined treatment of DSF with TKIs effectively targets both BCR-ABL+ blast cells and drug-insensitive LSCs, conferring a significant survival advantage in mouse models.

Conclusion: In summary, the dual inhibition of GPX4 and BCR-ABL presents a promising therapeutic strategy to synergistically target blast cells and drug-insensitive LSCs in patients, offering potential avenues for advancing leukemia treatment.

Keywords: BCR-ABL+ leukemia; Disulfiram; Ferroptosis; GPX4; Tyrosine kinase inhibitor.


Conflict of interest statement

The authors declare no competing interests.

Figures

Fig. 1
Fig. 1
DSF cooperates with TKIs to induce the cell death of BCR-ABL+ leukemia cells. A A panel of BCR-ABL+ leukemia cells and cancer cell lines were treated with increasing concentrations of DSF for 48 h and the cell viability was determined by CCK-8 assay (left panel), and the IC50 was calculated by CompuSyn 2.0 (right panel). B BCR-ABL+ leukemia cell lines were treated with the indicated concentrations of DSF (left panel), and the percentage of Annexin V + cells was detected by the flow cytometry (right panel). C Effect of DSF on the colony-forming ability of BCR-ABL+ leukemia cells. Representative results are shown in the left panel, with quantification from three experiments displayed in the right panel. D BM MNCs from newly diagnosed patients with CML (n = 6) or BCR-ABL+ B-ALL (n = 6) were exposed to indicated concentrations of DSF for 48 h, and the percentage of Annexin V + cells was detected by the flow cytometry. E Heatmaps of drug combination responses were generated using the online SynergyFinder software (https://www.synergyfinder.fimm.fi/), assessing the synergistic effects of DSF + TKIs in KBM5 and TOM-1 cells. Synergistic effects were indicated by scores over 0, and those surpassing 10 suggested strong synergistic effects. In these heatmaps, red signals synergism, while green represents antagonism. The drug combinations exhibiting the most potent synergistic effects are highlighted with white squares (left panel). KBM5 and TOM-1 cells were treated with DSF alone, TKIs alone, or the combination of DSF and TKIs at the indicated concentrations for 48 h and the cell viability was measured by CCK8 assay (right panel). F KBM5 and TOM-1 cells were treated with DSF (0.25 µM) alone, IM (0.25 µM) for KBM5 cells, DAS (0.25 µM) for TOM-1 cells, or the combination of DSF and TKIs at the indicated time points, and cell viability was measured by CCK8 assay(two-way ANOVA test, data are presented as mean ± SD). G KBM5 (upper panel) and TOM-1 cells (lower panel) were treated with 0.25 µM DSF, 0.25 µM TKIs or the combination of DSF and TKIs, and the percentage of Annexin V + cells was determined by flow cytometry. H Representative image and quantification of the colony-forming ability of BCR-ABL+ leukemia cells treated with DSF (0.25 µM), with or without IM (0.25 µM). I Cell death in Ku-812 and SUP-B15 cells with indicated treatment (0.25 µM DSF, 0.25 µM TKIs or the combination of DSF and TKIs for 48 h) was evaluated by flow cytometry labeling with Annexin-V and PI. J-L Cell viability of BM MNCs from newly diagnosed patients with CML (n = 10) or BCR-ABL+ B-ALL (n = 5) or HI PB (n = 3) with indicated treatment (0.25 µM DSF, 0.25 µM TKIs or the combination of DSF and TKIs) for 48 h were measured by CCK-8 assay (J) and flow cytometry(K-L). Data are expressed as the mean ± SD. n = 3 or more independent biological replicates, * P  < 0.05; ** P  < 0.01**** P  ≤ 0.0001
Fig. 2
Fig. 2
DSF induces BCR-ABL+ leukemia cell ferroptosis. A Schema of the experimental design to define the pathway in DSF-treated BCR-ABL+ leukemia cells. B Bubble diagram of KEGG pathway enrichment analysis was performed in KBM5 cells. The top 16 pathways most significantly changed in DSF + IM group compared with Ctrl group (left panel). The top 12 pathways most significantly changed in DSF + IM group compared with IM group (right panel). C The inhibitory effects of DSF (0.25 µM), IM (0.25 µM), or the combination of DSF and IM on KBM5 cells were assessed in the presence of the indicated inhibitors using the CCK-8 assay. D Fluorescence intensities of BODIPY-C11 in DSF treated KBM5 and TOM1 cells by flow cytometry. E The MDA in cell lysates of KBM5(up panel) and TOM-1(lower panel) were treated with the indicated concentrations of DSF for 36 h. F-G KBM5 and TOM-1 were treated with 0.25 µM DSF, 0.25 µM TKIs, or a combination of DSF and TKIs for 48 h. Fluorescence intensities of BODIPY-C11 (F) and ROS level (G) were determined by flow cytometry. H The MDA concentration of BM MNCs from newly diagnosed patients with CML treated with DSF (0.25 µM) or TKIs (0.25 µM) alone, or a combination of DSF and TKIs for 48 h. I The primary cells from HIs, CML patients and BCR-ABL+ B-ALL patients were treated with DSF (0.25 µM) alone, TKIs (0.25 µM) alone, or a combination of DSF and TKIs for 48 h. The levels of lipid peroxidation were determined by flow cytometry using the BODIPY-C11 probe. Representative results are shown in (left panel), and quantification are shown in (right panel). Data are expressed as the mean ± SD. n = 3 or more independent biological replicates, * P  < 0.05; ** P  < 0.01, *** P  ≤ 0.001, **** P  ≤ 0.0001
Fig. 3
Fig. 3
DSF induce ferroptosis through GPX4 targeting. A The mRNA level of GPX4 in RNA-seq data and the FPKM values were used to compare differences in gene expression among samples. B The protein level of GPX4 in BCR-ABL+ leukemia cell lines treated with the indicated concentrations of DSF, or DSF (0.25 µM) alone, TKIs (0.25 µM) alone, or a combination of DSF and TKIs for 48 h. C Representative immunofluorescence images of GPX4 protein in KBM5 cells treated with DSF (0.25 µM) alone, IM (0.25 µM) alone, or a combination of DSF and IM for 48 h. Nuclei are stained with DAPI (×10). Scale bars, 5 μm. D Western blot assay of GPX4 and ACTB proteins in KBM5 cells transfected with sh-GPX4 or its control sh-NC. E The colony formation assay was utilized to detect cell proliferation of KBM5 cells transfected with sh-GPX4 or its control sh-NC. F-H KBM5 cells transfected with sh-GPX4 were treated with 0.25 µM IM for 48 h, Cell viability (F), cell death (G), and fluorescence intensities of BODIPY-C11(H) were analyzed using the CCK8 assay or flow cytometry. I Western blot analysis of the GPX4 expression in GPX4-overexpressing KBM5 cells. Cell viability (J), cell death analysis (K), and fluorescence intensities of BODIPY-C11 (L) of GPX4-overexpressing KBM5 cells treated with 0.25 µM DSF or 0.25 µM IM for 48 h. Data are expressed as the mean ± SD. n  = 3 or more independent biological replicates, * P  < 0.05; ** P  < 0.01, *** P  ≤ 0.001, **** P  ≤ 0.0001
Fig. 4
Fig. 4
Dual BCR-ABL and GPX4 inhibition more effectively targets IM-resistant cells and LSCs than either treatment alone. A-D Prior to the experiment, K562-R cells were cultured in an IM-free medium for 48 h. IM-resistant cells were treated with IM (5 µM) alone, DSF (0.25 µM) alone, or a combination of DSF and IM for 48 h (A-C) or 56 h (D). Their responses were assessed using CCK8, western blot and flow cytometry to measure cell viability (A), cell death (B), the protein levels of GPX4 (C), and fluorescence intensities of BODIPY-C11 (D). E-G CD34 + cells from CML patients were treated with IM (0.25 µM) alone, DSF (0.25 µM) alone, or a combination of DSF and IM for 48 h. The effects were evaluated using CCK8 and flow cytometry to assess cell viability (E), cell death (F), and fluorescence intensities of BODIPY-C11 (G). H-I Mouse LSK cells from BCR-ABL mice 4 weeks after induction of BCR-ABL expression were treated with IM (0.25 µM) alone, DSF (0.25 µM) alone, or a combination of DSF and IM. Their responses were evaluated using CCK8 (H) and colony formation assays (I). Data are expressed as the mean ± SD. n = 3 or more independent biological replicates, * P  < 0.05; ** P  < 0.01, *** P  ≤ 0.001, **** P  ≤ 0.0001
Fig. 5
Fig. 5
GPX4 is highly expressed in BCR-ABL+ leukemia cells and is associated with a poor prognosis in BCR-ABL+ B-ALL. A-B Protein levels of GPX4 were assessed in primary cells from CML (A) and BCR-ABL+ B-ALL leukemia (B) patients and HIs. C GPX4 protein levels were examined in BCR-ABL+ leukemia cell lines, and primary cells from HIs. D RNA levels of GPX4 were evaluated in CD34 + cells obtained from HIs and CML patients. E Expression of GPX4 in cells from BCR-ABL mice before or after tetracycline withdrawal. Representative western blot (left panel) and immunofluorescence images (middle panel) of GPX4 protein in BM cells. RNA levels of GPX4 in LSK cells from BCR-ABL mice were also examined (right panel). F Protein levels of GPX4 were measured in 32D and 32D-BCR-ABL cells (left panel). Representative immunofluorescence images of GPX4 in these cells were analyzed (right panel). G Levels of lipid reactive oxygen species were determined in PB MNCs from HIs and CML patients. H Fluorescence intensities of BODIPY-C11 in 32D and 32D-BCR-ABL cells following treatment with IM (0.25 µM) alone, DSF (0.25 µM) alone, or a combination of DSF and IM for 48 h were measured. I Kaplan‒Meier analysis was performed to evaluate the associations of GPX4 expression with overall survival (OS) in patients with BCR-ABL+ B-ALL in the GSE34941-GP11088. The cutoff value is 13.9. J GPX4 expression levels in 477 newly diagnosed BCR-ABL+ CML patients and 74 patients receiving TKI treatment more than 1 year. Data are expressed as the mean ± SD. n = 3 or more independent biological replicates, * P < 0.05; ** P < 0.01, *** P ≤ 0.001, **** P ≤ 0.0001
Fig. 6
Fig. 6
GPX4 is essential for LSC development and the maintenance of BCR-ABL+ leukemia. Schema of the experimental strategy to define the dependence of CML cells on GPX4 in the maintenance of leukemia. (n = 8 mice per group). B Flow cytometry analysis of the CD45 + cell in the BM of CML mice. C Representative images of spleen. Statistical analysis of spleen weight is presented. D Kaplan–Meier survival curves showing effect of GPX4 KD on leukemia maintenance in immunodeficient mice. subsequent to sh-GPX4 KBM5 cell transplantation (n = 5). E Schematic overview of G5-siGpx4 nanoparticle therapy of BCR-ABL+ leukemia mice. (n = 8 mice per group for this experiment). F The frequency of LSKs, LT-HSCs, and ST-HSCs was analyzed by flow cytometry. G-H Mac-1 + Gr1 + myeloid cells in spleen (G) and BM (H). I-L Survival (I), spleen weight (J), the ratio of GSH and GSSG (K), MDA (L), and CFC (M) of the G5-siGpx4-treated vs. G5-siNC-treated mice are shown. N-R Experimental design (N). To assess the impact of G5-siGpx4 treatment on the LSC development, lineage-c-Kit + cells from BCR-ABL mice (BCR-ABL were induced for two days by Tet-off) were transplanted into recipient mice, starting on the day after transplantation, mice were treated G5-siGpx4 or G5-siNC. Spleen weight (O), Mac-1 + Gr1 + myeloid cells (P), LSK cells (Q), Survival (R), the ratio of GSH/GSSG (S) and MDA(T) of the G5-siGpx4-treated vs. G5-siNC-treated mice are shown. Data are expressed as mean ± SD from three or more independent biological replicates. Statistical significance is denoted as * P < 0.05; ** P < 0.01; *** P ≤ 0.001; **** P ≤ 0.0001
Fig. 7
Fig. 7
GPX4 degradation and Ferroptosis induced by DSF was dependent on HSPA8. A KBM5 cells were treated with CHX alone (20 µM) or in combination with DSF (0.25 µM) or MG132 (0.25 µM). The protein level of GPX4 was assayed by western blots. B Western blot assay of GPX4 in KBM5 cells treated with DMSO, DSF (0.25 µM), or MG132 (0.25 µM) and CQ (25 µM) for 48 h. C Anti-Ubiquitin immunoblotting assay of GPX4 polyubiquitination in KBM5 cells treated with DSF (0.25 µM, 36 h) or control. D Molecular docking predicted a direct interaction between HSPA8 and GPX4. E Co-immunoprecipitation (Co-IP) of HSPA8 and GPX4 proteins in the whole cell lysates of KBM5 cells with or without DSF treatment (0.25 µM, 36 h). F GPX4-reconstituted cells were treated with 0.25 µM DSF for 46 h, and cells were collected for Western blot analysis. G qPCR analysis of HSPA8 (left panel) expression in KBM5 cells transfected with siHSPA8 or siNC. Western blot analysis of GPX4(right panel). H Western blot analysis of GPX4 expression in KBM5 cells transfected with siNC, siHSPA8-1, or siHSPA8-2 and treated with DMSO or MG132 (0.25 µM, 48 h). I qPCR analysis of HSPA8 (left panel) expression in HSPA8-overexpressing KBM5 cells. Western blot analysis of GPX4 (right panel) expression in these cells is also shown. J Western blot analysis of GPX4 expression in KBM5 cells transduced with LV-NC or LV-HSPA8 and treated with DSF or control. K The effect of HSPA8 on the ubiquitination modification of GPX4. L Western blot analysis of GPX4 expression in LV-NC or LV-HSPA8 transfected KBM5 cells following GPX4 KD. M Cell death (left panel) and fluorescence intensities of BODIPY-C11 (right panel) in LV-NC or LV-HSPA8 transfected KBM5 cells following GPX4 KD are displayed. N Co-IP of STUB1 and GPX4 proteins in the whole cell lysates of KBM5 cells with or without DSF treatment. O qPCR analysis of STUB1 (upper panel) expression in KBM5 cells transfected with siSTUB1 or siNC. Western blot analysis of GPX4(lower panel). P The effect of STUB1 KD on the ubiquitination modification of GPX4. Q The effect of HSPA8 on the STUB1-GPX4 binding. Data are expressed as mean ± SD from three or more independent biological replicates
Fig. 8
Fig. 8
Enhanced anti-leukemia activity in BCR-ABL+ leukemia by the combination of DSF and TKIs in vivo. A Schematic of xenotransplantation assay with K562 cells and B-NDG immune-deficient recipient mice. (n = 5 mice per group for this experiment). B Representative in vivo bioluminescent images of NRGS recipient mice xenotransplanted with GFP+/luciferase + K562 (K562-GL) cells treated with IM and DSF, either alone or in combination. C Kaplan–Meier survival curve following treatments with vehicle, TKIs alone, DSF alone, or a combination of DSF and TKIs (n = 5 mice per group). D Experimental design using the BCR-ABL transgenic mouse model. Treatment with DSF, IM, or DSF in combination with IM or vehicle alone (Ctrl) was initiated after transplantation and continued for 4 weeks. E-L A group of mice was sacrificed and analyzed after Treatment, and the rest for survival analysis. Images and weights of spleen (E), Mac-1 + Gr1 + myeloid cells (F), frequency of LSKs(G), LT-HSCs/ST-HSCs cells (H), survival (I), the ratio of GSH and GSSG (J), MDA (K), and representative immunofluorescence images of GPX4 protein (L) from each group are shown. M A summary of regulatory mechanisms that are significantly affected by the interaction of DSF and TKIs is shown. Data are presented as mean ± SD from three or more independent biological replicates

References

    1. Soverini S, Bassan R, Lion T. Treatment and monitoring of Philadelphia chromosome-positive leukemia patients: recent advances and remaining challenges. J Hematol Oncol. 2019;12(1):39. - PMC - PubMed
    1. Braun TP, Eide CA, Druker BJ. Response and resistance to BCR-ABL1-targeted therapies. Cancer Cell. 2020;37(4):530–42. - PMC - PubMed
    1. Zhou H, Xu R. Leukemia stem cells: the root of chronic myeloid leukemia. Protein Cell. 2015;6(6):403–12. - PMC - PubMed
    1. Zhang B, et al. Inhibition of interleukin-1 signaling enhances elimination of tyrosine kinase inhibitor-treated CML stem cells. Blood. 2016;128(23):2671–82. - PMC - PubMed
    1. Liu C, et al. Loss of PRMT7 reprograms glycine metabolism to selectively eradicate leukemia stem cells in CML. Cell Metab. 2022;34(6):818-e8357. - PubMed

MeSH terms

Substances