. 2024 Oct 28;21(1):87.
doi: 10.1186/s12987-024-00588-8.

[11C]Metoclopramide PET can detect a seizure-induced up-regulation of cerebral P-glycoprotein in epilepsy patients

Affiliations

[11C]Metoclopramide PET can detect a seizure-induced up-regulation of cerebral P-glycoprotein in epilepsy patients

Myriam El Biali et al. Fluids Barriers CNS. .

Abstract

Background: P-glycoprotein (P-gp) is an efflux transporter which is abundantly expressed at the blood-brain barrier (BBB) and which has been implicated in the pathophysiology of various brain diseases. The radiolabelled antiemetic drug [11C]metoclopramide is a P-gp substrate for positron emission tomography (PET) imaging of P-gp function at the BBB. To assess whether [11C]metoclopramide can detect increased P-gp function in the human brain, we employed drug-resistant temporal lobe epilepsy (TLE) as a model disease with a well characterised, regional P-gp up-regulation at the BBB.

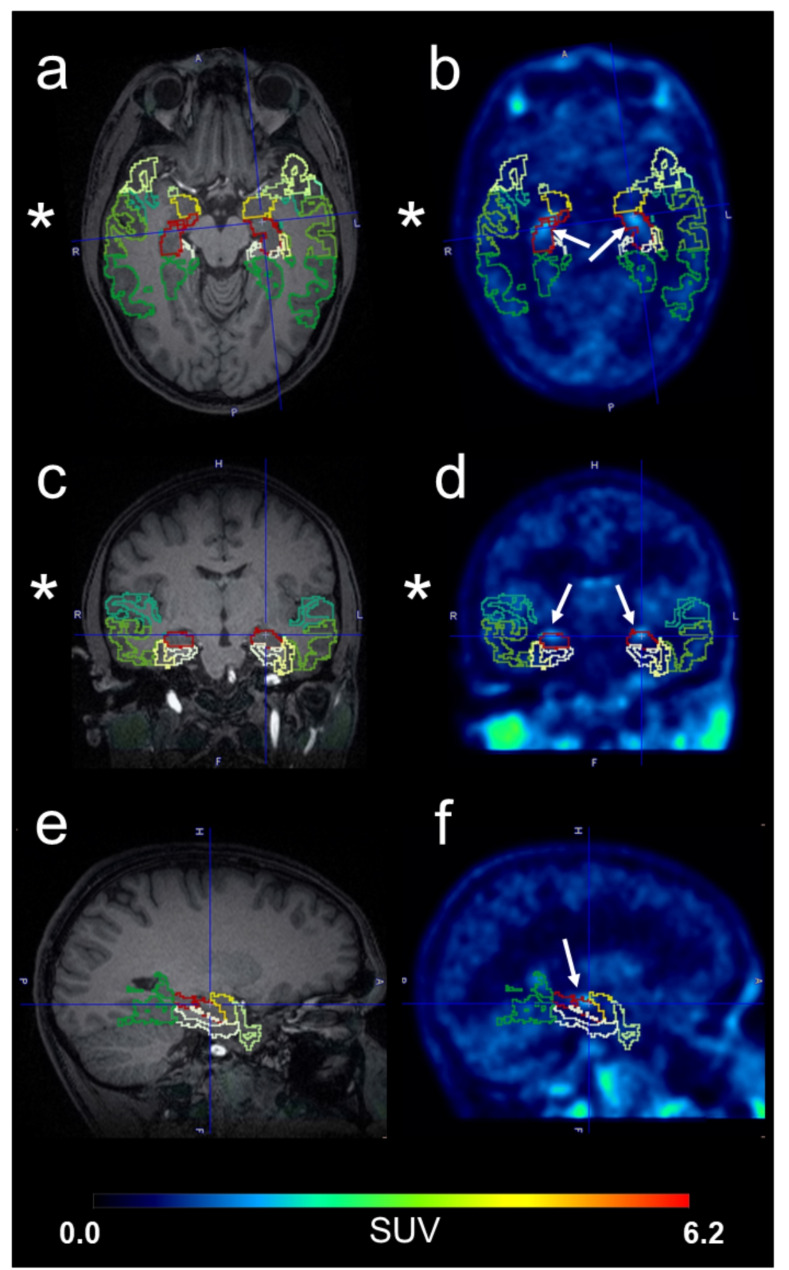
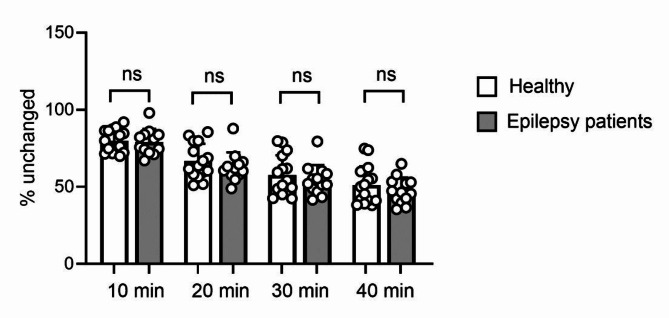
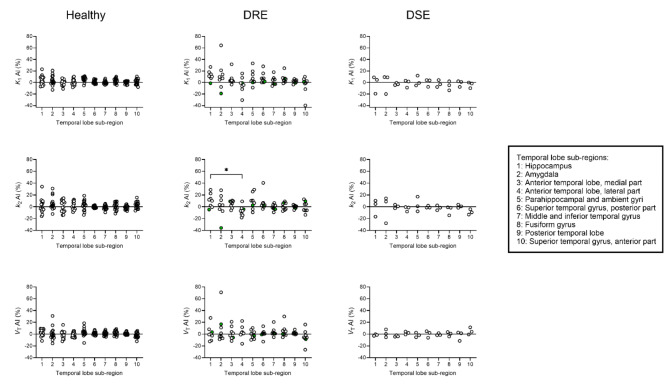
Methods: Eight patients with drug-resistant (DRE) TLE, 5 seizure-free patients with drug-sensitive (DSE) focal epilepsy, and 15 healthy subjects underwent brain PET imaging with [11C]metoclopramide on a fully-integrated PET/MRI system. Concurrent with PET, arterial blood sampling was performed to generate a metabolite-corrected arterial plasma input function for kinetic modelling. The choroid plexus was outmasked on the PET images to remove signal contamination from the neighbouring hippocampus. Using a brain atlas, 10 temporal lobe sub-regions were defined and analysed with a 1-tissue-2-rate constant compartmental model to estimate the rate constants for radiotracer transfer from plasma to brain (K1) and from brain to plasma (k2), and the total volume of distribution (VT = K1/k2).

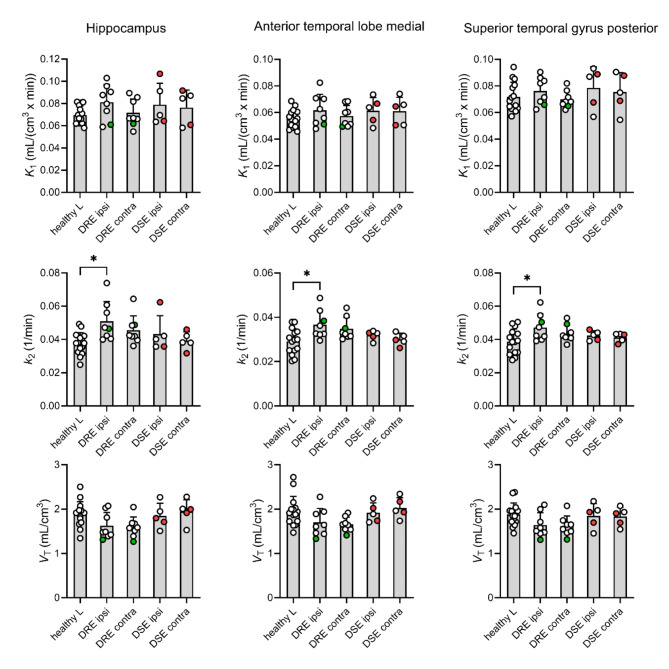
Results: DRE patients but not DSE patients showed significantly higher k2 values and a trend towards lower VT values in several temporal lobe sub-regions located ipsilateral to the epileptic focus as compared to healthy subjects (k2: hippocampus: +34%, anterior temporal lobe, medial part: +28%, superior temporal gyrus, posterior part: +21%).

Conclusions: [11C]Metoclopramide PET can detect a seizure-induced P-gp up-regulation in the epileptic brain. The efflux rate constant k2 seems to be the most sensitive parameter to measure increased P-gp function with [11C]metoclopramide. Our study provides evidence that disease-induced alterations in P-gp expression at the BBB can lead to changes in the distribution of a central nervous system-active drug to the human brain, which could affect the efficacy and/or safety of drugs. [11C]Metoclopramide PET may be used to assess or predict the contribution of increased P-gp function to drug resistance and disease pathophysiology in various brain diseases.

Trial registration: EudraCT 2019-003137-42. Registered 28 February 2020.

Keywords: Blood-brain barrier; Drug-resistant epilepsy; P-glycoprotein; PET; [11C]Metoclopramide.


Conflict of interest statement

The authors declare no competing interests.

Figures

Fig. 1
Fig. 1
T1-weighted MR images (a, c, e) and averaged [11C]metoclopramide PET images (b, d, f) in 3 planes (from top to bottom: horizontal, coronal and sagittal [left hemisphere]) in one non-lesional drug-resistant epilepsy patient (p01-04) showing different temporal lobe sub-regions (green to yellow) from the brain region atlas (N30R83) and contamination of the hippocampus VOI (in red) by the choroid plexus (white arrows). The side of the seizure focus (right hemisphere) is indicated by an asterisk. Intensity scale for PET is expressed as standardised uptake value (SUV) and set from 0 to 6.2
Fig. 2
Fig. 2
Percentage of unchanged [11C]metoclopramide in arterial plasma of healthy subjects (n = 15) and epilepsy patients (n = 13) at different time points after radiotracer injection. Error bars and lines indicate mean + SD. ns, not significant; two-sided, unpaired t-test
Fig. 3
Fig. 3
Time-activity curves (mean ± SD) of unchanged [11C]metoclopramide in arterial plasma (a) and total radioactivity in whole brain grey matter (b) of healthy subjects (n = 15) and epilepsy patients (n = 13)
Fig. 4
Fig. 4
Outcome parameters from kinetic modelling (K1, k2 and VT) in the hippocampus, anterior temporal lobe, medial part and superior temporal gyrus, posterior part ipsilateral (ipsi) and contralateral (contra) to the epileptic focus of drug-resistant (DRE, n = 8) and drug-sensitive (DSE, n = 5) epilepsy patients as compared to corresponding left-sided control regions of healthy subjects (healthy L, n = 15). In two DSE patients (p03-02 and p03-03), the localisation of the epileptic focus was not known and was arbitrarily assigned to the left side (red symbols). In one DRE patient (p01-04), the epileptic focus was located temporal posterior (green symbols). Error bars and lines indicate mean + SD. *, p ≤ 0.05; one-way ANOVA followed by a Tukey’s multiple comparison test
Fig. 5
Fig. 5
Asymmetry indices (AI, %) for outcome parameters from kinetic modelling (K1, k2 and VT) in 10 temporal lobe sub-regions of healthy subjects (n = 15), drug-resistant epilepsy (DRE) patients (n = 8) and drug-sensitive epilepsy (DSE) patients (n = 3). Two out of 5 DSE patients (p03-02 and p03-03) were excluded because the localisation of the epileptic focus was not known. In one DRE patient (p01-04), the epileptic focus was located temporal posterior (green symbols). *, p ≤ 0.05; one-way ANOVA followed by a Tukey’s multiple comparison test

References

    1. Cordon-Cardo C, O’Brien JP, Casals D, Rittman-Grauer L, Biedler JL, Melamed MR, et al. Multidrug-resistance gene (P-glycoprotein) is expressed by endothelial cells at blood-brain barrier sites. Proc Natl Acad Sci U S A. 1989;86:695–8. 10.1073/pnas.86.2.695 - PMC - PubMed
    1. Cirrito JR, Deane R, Fagan AM, Spinner ML, Parsadanian M, Finn MB, et al. P-glycoprotein deficiency at the blood-brain barrier increases amyloid-beta deposition in an Alzheimer disease mouse model. J Clin Invest. 2005;115:3285–90. 10.1172/JCI25247 - PMC - PubMed
    1. Schinkel AH, Smit JJ, van Tellingen O, Beijnen JH, Wagenaar E, van Deemter L, et al. Disruption of the mouse mdr1a P-glycoprotein gene leads to a deficiency in the blood-brain barrier and to increased sensitivity to drugs. Cell. 1994;77:491–502. - PubMed
    1. Baltira C, Aronica E, Elmquist WF, Langer O, Löscher W, Sarkaria JN, et al. The impact of ATP-binding cassette transporters in the diseased brain: context matters. Cell Rep Med. 2024;5:101609. 10.1016/j.xcrm.2024.101609 - PMC - PubMed
    1. Bauer M, Tournier N, Langer O. Imaging P-glycoprotein function at the blood-brain barrier as a determinant of the variability in response to central nervous system drugs. Clin Pharmacol Ther. 2019;105:1061–4. 10.1002/cpt.1402 - PMC - PubMed

MeSH terms

Substances

LinkOut - more resources