. 2024 Oct 27;21(1):276.
doi: 10.1186/s12974-024-03267-5.

Fenebrutinib, a Bruton's tyrosine kinase inhibitor, blocks distinct human microglial signaling pathways

Affiliations

Fenebrutinib, a Bruton's tyrosine kinase inhibitor, blocks distinct human microglial signaling pathways

Julie Langlois et al. J Neuroinflammation. .

Abstract

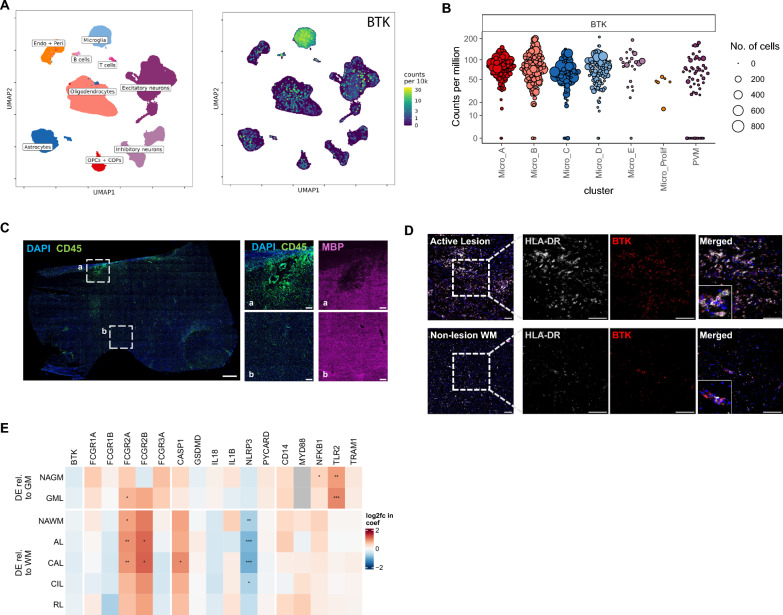
Background: Bruton's tyrosine kinase (BTK) is an intracellular signaling enzyme that regulates B-lymphocyte and myeloid cell functions. Due to its involvement in both innate and adaptive immune compartments, BTK inhibitors have emerged as a therapeutic option in autoimmune disorders such as multiple sclerosis (MS). Brain-penetrant, small-molecule BTK inhibitors may also address compartmentalized neuroinflammation, which is proposed to underlie MS disease progression. BTK is expressed by microglia, which are the resident innate immune cells of the brain; however, the precise roles of microglial BTK and impact of BTK inhibitors on microglial functions are still being elucidated. Research on the effects of BTK inhibitors has been limited to rodent disease models. This is the first study reporting effects in human microglia.

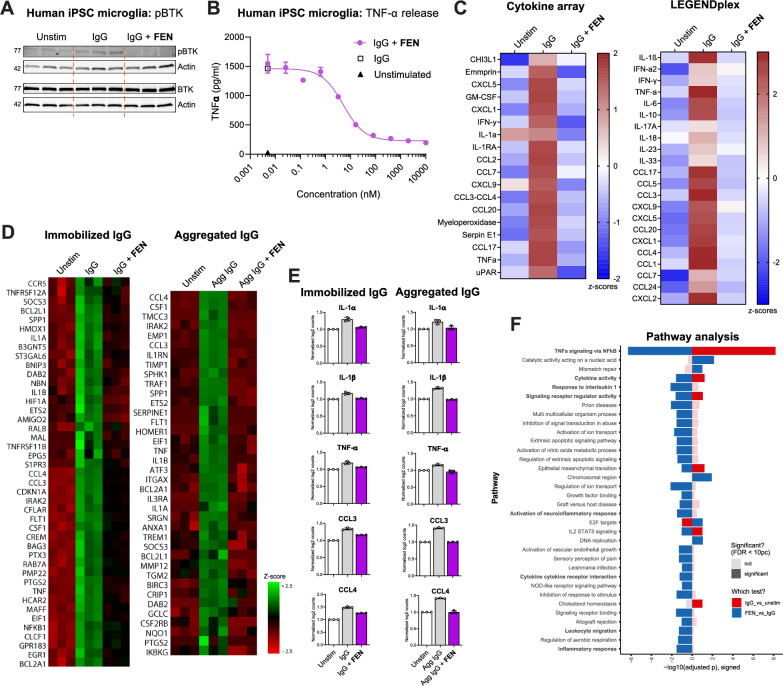
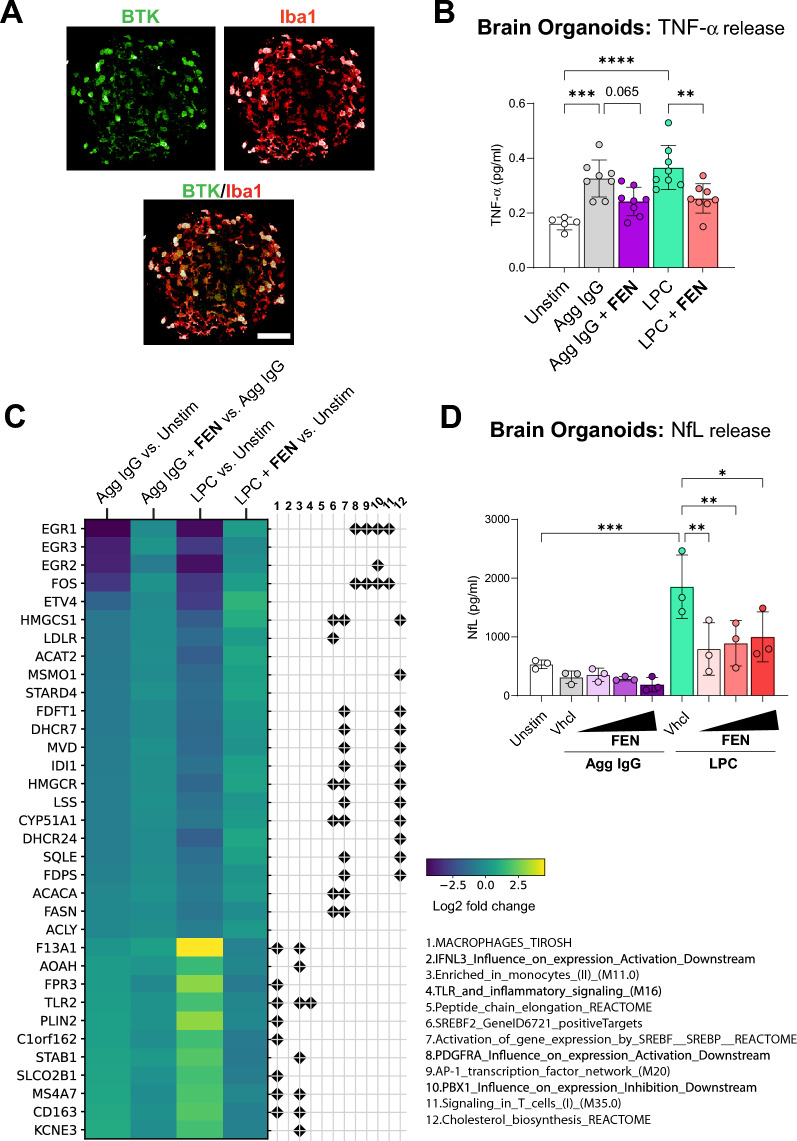
Methods: Here we characterize the pharmacological and functional properties of fenebrutinib, a potent, highly selective, noncovalent, reversible, brain-penetrant BTK inhibitor, in human microglia and complex human brain cell systems, including brain organoids.

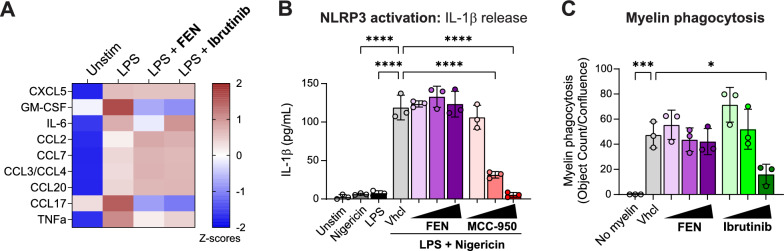
Results: We find that fenebrutinib blocks the deleterious effects of microglial Fc gamma receptor (FcγR) activation, including cytokine and chemokine release, microglial clustering and neurite damage in diverse human brain cell systems. Gene expression analyses identified pathways linked to inflammation, matrix metalloproteinase production and cholesterol metabolism that were modulated by fenebrutinib treatment. In contrast, fenebrutinib had no significant impact on human microglial pathways linked to Toll-like receptor 4 (TLR4) and NACHT, LRR and PYD domains-containing protein 3 (NLRP3) signaling or myelin phagocytosis.

Conclusions: Our study enhances the understanding of BTK functions in human microglial signaling that are relevant to MS pathogenesis and suggests that fenebrutinib could attenuate detrimental microglial activity associated with FcγR activation in people with MS.

Keywords: BTK; Fenebrutinib; Microglia; Multiple sclerosis; Neuroinflammation; Organoids.


Conflict of interest statement

JL, SL, ME, WM, RS, JD, TS, LC and JK were employees and shareholders of F. Hoffmann-La Roche Ltd during the time that this work was completed. YS and CH were employees of Genentech, Inc., and shareholders of F. Hoffmann-La Roche Ltd during the time this work was completed. VWY has research contracts with Genentech, Inc. and Novartis. He has received speaker honoraria from Biogen Idec, EMD Serono (Merck), Novartis, F. Hoffmann-La Roche Ltd, Sanofi Genzyme and Teva Canada. He is the recipient of unrestricted educational grants from Biogen Idec, EMD Serono (Merck), Novartis, F. Hoffmann-La Roche Ltd, Sanofi Genzyme and Teva Canada to support educational activities of the Alberta MS Network and Americas School of Neuroimmunology of the International Society of Neuroimmunology, which he directs.

Figures

Fig. 1
Fig. 1
BTK and innate immune pathway gene expression in human microglia and across MS lesion types. A Uniform Manifold Approximation and Projection plot showing expression of BTK (right) in an snRNA-seq dataset of human brain samples. BTK is highly expressed in microglia in the human CNS. B snRNA-seq dataset showing broad expression of BTK across microglial subclusters from the human brain. Dots correspond to “pseudobulk” values for clusters, i.e. the sum of counts across all cells in one cluster, in one sample. Counts are normalized by the TMM-normalized library size. Values are only shown where there are at least 10 cells in the combination of cluster and sample. C Immunofluorescent images of postmortem MS brain tissue from subcortical WM containing an active lesion. Low-magnification overview, with DAPI identifying cell nuclei (blue), CD45 identifying immune cells (green) and MBP identifying myelin (magenta), with dotted white boxes containing higher magnification images showing the active lesion (a) and nonlesion WM (b). Scale bar is 2 mm. D The active lesion area shows prominent infiltration of microglia and macrophages labeled with HLA-DR (white) that are closely associated with BTK staining (red), as shown in the merged panels. Scale bars are 100 μm. E Heat map showing expression of BTK and associated innate immune pathway genes in microglia across MS lesion types. Differential expression relative to control WM and GM is shown. Expression of certain FcγR-encoding genes, including FCGR2A and FCGR2B, is significantly increased in WM active lesions and chronic active lesions. Significance is indicated by ****P < 0.0001, ***P < 0.001, **P < 0.01 and *P < 0.05. R package glmmTMB was used, and the Benjamini–Hochberg procedure was used to control the false discovery rate. AL active lesion, BTK Bruton’s tyrosine kinase, CAL chronic active lesion, CIL chronic inactive lesion, CNS central nervous system, COP committed oligodendrocyte precursor, DAPI 4′,6-diamidino-2-phenylindole, DE differential expression, endo endothelial, FcγR Fc gamma receptor, GM gray matter, GML gray matter lesion, HLA-DR human leukocyte antigen-DR variant, MBP myelin basic protein, MS multiple sclerosis, NAGM normal-appearing gray matter, NAWM normal-appearing white matter, OPC oligodendrocyte precursor cell, peri pericyte, prolif proliferating, PVM perivascular macrophage, RL remyelinating lesion, snRNA-seq single-nuclei ribonucleic acid sequencing, WM white matter
Fig. 2
Fig. 2
Fenebrutinib blocks inflammatory pathways linked to FcγR activation in human iMicroglia. A Western blot of protein lysates from human iMicroglia incubated with fenebrutinib (1 μM) and stimulated with immobilized IgG (300 μg/mL) for 30 min. Fenebrutinib treatment reduced immobilized IgG-induced BTK activation, as shown by pBTK levels. Cropped images show relevant bands for pBTK, BTK and actin. Full uncropped images are shown in Supplementary Fig. 1. B TNF-α release from human iMicroglia incubated with fenebrutinib and stimulated with immobilized IgG (300 μg/mL) for 24 h. Fenebrutinib (0.05 nM to 10 µM) demonstrated potent concentration-dependent reduction in immobilized IgG-induced TNF-α release. C Extended cytokine and chemokine release profiles from human iMicroglia incubated with fenebrutinib (1 μM) and stimulated with immobilized IgG (300 μg/mL; 24 h) using two different immunoassay methods. Fenebrutinib treatment attenuated the release of multiple proinflammatory cytokines and chemokines. D NanoString® gene expression profiling of human iMicroglia incubated with fenebrutinib (1 μM) and stimulated with immobilized IgG (300 μg/mL) or aggregated IgG (1 mg/mL) for 24 h. Fenebrutinib reverses transcriptional signatures associated with FcγR activation. E Expression levels of key proinflammatory cytokines (IL-1α, IL-1β and TNF-α) and chemokines (CCL3 and CCL4) are reduced with fenebrutinib treatment. F Gene set enrichment analysis identified FcγR activation-induced pathways linked to neuroinflammation, cytokine signaling and inflammatory response (displayed in bold) that are modulated by fenebrutinib treatment. Data are shown as mean ± SD, with three to four replicates per condition. Individual dots in E represent replicate wells. Results are representative of two to three independent experiments. Agg IgG heat-aggregated immunoglobulin G, BTK Bruton’s tyrosine kinase, CCL C-C motif chemokine ligand, CHI3L1 chitinase-3-like protein 1, CXCL C-X-C motif chemokine ligand, DNA deoxyribonucleic acid, FcγR Fc gamma receptor, FDR false discovery rate, FEN fenebrutinib, GM-CSF granulocyte–macrophage colony-stimulating factor, IFN interferon, Ig immunoglobulin, IL interleukin, iMicroglia induced pluripotent stem cell-derived microglia, iPSC induced pluripotent stem cell, NOD nucleotide-binding oligomerization domain, pBTK phosphorylated Bruton’s tyrosine kinase, SD standard deviation, STAT5 signal transducer and activator of transcription 5, TNF tumor necrosis factor, uPAR urokinase-type plasminogen activator receptor
Fig. 3
Fig. 3
Fenebrutinib blocks effects of FcγR activation in human brain tricultures and MCM-exposed neurons. A Immunocytochemistry of the human iPSC-derived brain triculture system showing GFAP+ astrocytes, pan-NF+ neurons and Iba1+ microglia. Scale bar is 50 µm. B TNF-α release from human iPSC-derived brain tricultures treated with fenebrutinib (1 μM) and stimulated with Agg IgG (1 mg/mL) for 24 h. Fenebrutinib treatment reduced Agg IgG-induced TNF-α release. C Representative live cell microscopy images of human iPSC-derived brain tricultures showing Agg IgG-induced clustering of GFP+ iMicroglia. Scale bar is 100 µm. D Quantification of GFP+ iMicroglia demonstrated a significant reduction in microglial clustering with fenebrutinib treatment. E Heatmap showing top differentially expressed genes from annotated gene sets in human iPSC-derived brain tricultures treated with fenebrutinib (1 μM) and stimulated with Agg IgG (1 mg/mL) for 72 h. F Box plots showing representative genes from the BSG pathway, which is the most significant gene set modulated by fenebrutinib treatment. G Representative confocal images of MCM-exposed iNGN2 showing reduced neurite staining with Agg IgG MCM, which is reversed by fenebrutinib treatment. Scale bar is 200 µm. H NfL levels in supernatants of MCM-exposed iNGN2. Fenebrutinib treatment significantly reduced NfL release compared with Agg IgG alone. Data are shown as mean ± SD; individual dots represent replicate wells. Results are representative of two to three independent experiments. Significance is indicated by ****P < 0.0001, ***P < 0.001 and *P < 0.05, determined by one‐way ANOVA and Tukey’s post hoc test. Agg IgG heat-aggregated immunoglobulin G, ANOVA analysis of variance, BSG basigin, DAPI 4′,6-diamidino-2-phenylindole, FcγR Fc gamma receptor, FEN fenebrutinib, GFAP glial fibrillary acidic protein, GFP green fluorescent protein, iMicroglia/iMGL induced pluripotent stem cell-derived microglia, iNGN2 neurogenin 2-inducible neuron, Iba1 ionized calcium-binding adaptor molecule 1, iPSC induced pluripotent stem cell, MCM microglia-conditioned media, NF neurofilament, NfL neurofilament light chain, ns not significant, SD standard deviation, TNF tumor necrosis factor, tpm transcripts per million
Fig. 4
Fig. 4
Fenebrutinib inhibits downstream pathways linked to FcγR activation and LPC exposure in IMHBOs. A Immunoreactivity of BTK and Iba1 in IMHBOs showing overlap between BTK expression in iMicroglia in IMHBOs. Scale bar is 100 µm. B TNF-α release from IMHBOs incubated with fenebrutinib (1 μM) and stimulated with Agg IgG (1 mg/mL; 24 h) or LPC (0.1 mM; 72 h). Fenebrutinib treatment reduced Agg IgG- and LPC-induced TNF-α release. C Heatmap showing top differentially expressed genes from annotated gene sets in IMHBOs treated with fenebrutinib (1 μM) and stimulated with Agg IgG (1 mg/mL; 24 h) or LPC (0.1 mM; 72 h). D NfL levels in supernatants of IMHBOs incubated with fenebrutinib (0.01–1 μM) and stimulated with Agg IgG (1 mg/mL; 24 h) or LPC (0.1 mM; 72 h). Fenebrutinib treatment significantly reduced LPC-induced NfL release. Data are shown as mean ± SD; individual dots represent replicate wells from single organoids. Significance is indicated by ****P < 0.0001, ***P < 0.001, **P < 0.01 and *P < 0.05, determined by one‐way ANOVA and Tukey’s post hoc test. Agg IgG heat-aggregated immunoglobulin G, ANOVA analysis of variance, BTK Bruton’s tyrosine kinase, FcγR Fc gamma receptor, FEN fenebrutinib, Iba1 ionized calcium-binding adaptor molecule 1, IMHBO immunocompetent human brain organoid, iMicroglia induced pluripotent stem cell-derived microglia, LPC lysolecithin, NfL neurofilament light chain, SD standard deviation, TNF tumor necrosis factor
Fig. 5
Fig. 5
Human microglial pathways not impacted by fenebrutinib treatment. A Cytokine and chemokine release from LPS-stimulated (0.1 μg/mL) human iMicroglia incubated with fenebrutinib or ibrutinib (both 1 μM) for 24 h. While BTK inhibition reduced levels of GM-CSF and CCL17, limited effects were observed for other cytokines and chemokines that are increased with LPS stimulation. B IL-1β release from human iMicroglia incubated with fenebrutinib or MCC-950 (0.01–1 μM) and stimulated with LPS (0.1 μg/mL; 3 h) followed by nigericin (10 μM; 1 h). Fenebrutinib had no effect on IL-1β release in contrast to MCC-950, which dose dependently reduced IL-1β levels. C Phagocytosis of pHrodo-conjugated myelin by human iMicroglia incubated with fenebrutinib or ibrutinib (0.01–1 μM) for 24 h. Fenebrutinib had no effect on myelin phagocytosis, while ibrutinib reduced myelin phagocytosis at 1 μM only. Data are shown as mean ± SD; individual dots represent replicate wells. Results are representative of two to three independent experiments. Significance is indicated by ****P < 0.0001, ***P < 0.001 and *P < 0.05, determined by one‐way ANOVA and Tukey’s post hoc test. ANOVA analysis of variance, BTK Bruton’s tyrosine kinase, CCL C-C motif chemokine ligand, CXCL C-X-C motif chemokine ligand, GM-CSF granulocyte–macrophage colony-stimulating factor, FEN fenebrutinib, IL interleukin, iMicroglia induced pluripotent stem cell-derived microglia, LPS lipopolysaccharide, NLRP3 NACHT, LRR and PYD domains-containing protein 3, SD standard deviation, TNF tumor necrosis factor
Fig. 6
Fig. 6
Schematic representation of fenebrutinib effects on both B-cell and microglial pathways. BTK Bruton’s tyrosine kinase

References

    1. Pal Singh S, Dammeijer F, Hendriks RW. Role of Bruton’s tyrosine kinase in B cells and malignancies. Mol Cancer. 2018;17:57. - PMC - PubMed
    1. Advani RH, Buggy JJ, Sharman JP, Smith SM, Boyd TE, Grant B, Kolibaba KS, Furman RR, Rodriguez S, Chang BY, et al. Bruton tyrosine kinase inhibitor ibrutinib (PCI-32765) has significant activity in patients with relapsed/refractory B-cell malignancies. J Clin Oncol. 2013;31:88–94. - PMC - PubMed
    1. Hendriks RW, Yuvaraj S, Kil LP. Targeting Bruton’s tyrosine kinase in B cell malignancies. Nat Rev Cancer. 2014;14:219–32. - PubMed
    1. Jongstra-Bilen J, Puig Cano A, Hasija M, Xiao H, Smith CI, Cybulsky MI. Dual functions of Bruton’s tyrosine kinase and Tec kinase during Fcgamma receptor-induced signaling and phagocytosis. J Immunol. 2008;181:288–98. - PubMed
    1. Ellmeier W, Abramova A, Schebesta A. Tec family kinases: regulation of FcεRI-mediated mast-cell activation. FEBS J. 2011;278:1990–2000. - PubMed

MeSH terms