. 2024 Dec;11(48):e2410880.
doi: 10.1002/advs.202410880. Epub 2024 Oct 28.

E2F2 Reprograms Macrophage Function By Modulating Material and Energy Metabolism in the Progression of Metabolic Dysfunction-Associated Steatohepatitis

Affiliations

E2F2 Reprograms Macrophage Function By Modulating Material and Energy Metabolism in the Progression of Metabolic Dysfunction-Associated Steatohepatitis

Zheng Liu et al. Adv Sci (Weinh). 2024 Dec.

Erratum in

Abstract

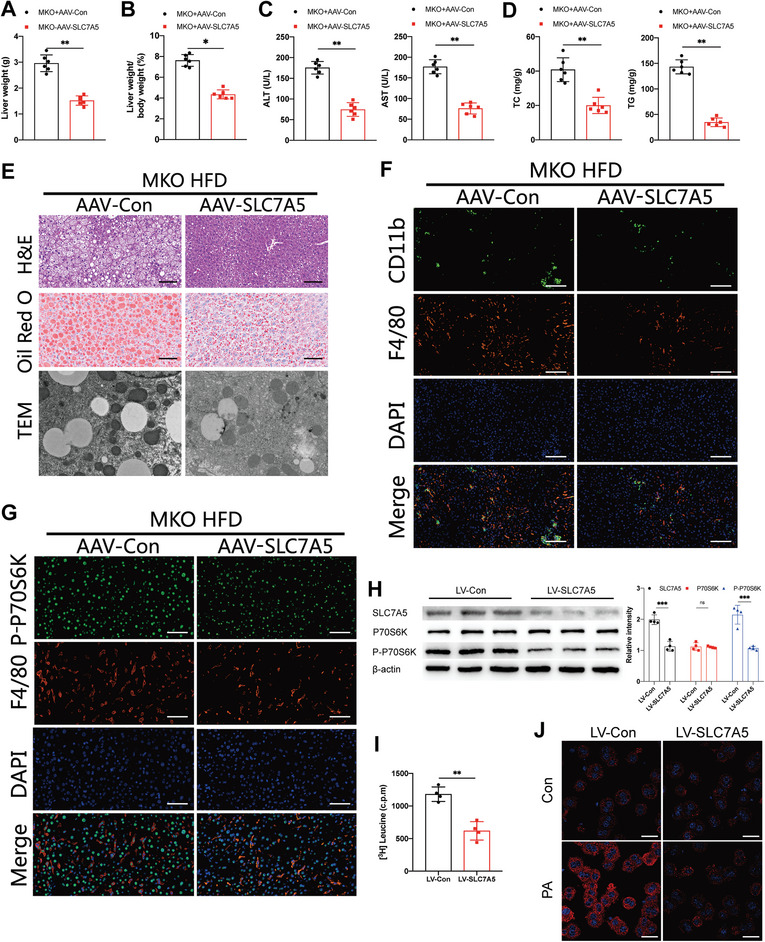
Macrophages are essential for the development of steatosis, hepatic inflammation, and fibrosis in metabolic dysfunction-associated steatohepatitis(MASH). However, the roles of macrophage E2F2 in the progression of MASH have not been elucidated. This study reveals that the expression of macrophage E2F2 is dramatically downregulated in MASH livers from mice and humans, and that this expression is adversely correlated with the severity of the disease. Myeloid-specific E2F2 depletion aggravates intrahepatic inflammation, hepatic stellate cell activation, and hepatocyte lipid accumulation during MASH progression. Mechanistically, E2F2 can inhibit the SLC7A5 transcription directly. E2F2 deficiency upregulates the expression of SLC7A5 to mediate amino acids flux, resulting in enhanced glycolysis, impaired mitochondrial function, and increased macrophages proinflammatory response in a Leu-mTORC1-dependent manner. Moreover, bioinformatics analysis and CUT &Tag assay identify the direct binding of Nrf2 to E2F2 promoter to promote its transcription and nuclear translocation. Genetic or pharmacological activation of Nrf2 effectively activates E2F2 to attenuate the MASH progression. Finally, patients treated with CDK4/6 inhibitors demonstrate reduced E2F2 activity but increased SLC7A5 activity in PBMCs. These findings indicated macrophage E2F2 suppresses MASH progression by reprogramming amino acid metabolism via SLC7A5- Leu-mTORC1 signaling pathway. Activating E2F2 holds promise as a therapeutic strategy for MASH.

Keywords: amino acid transportation; glycolysis; macrophage; metabolic dysfunction‐associated steatohepatitis; slc7a5.


Conflict of interest statement

The authors declare no conflict of interest.

Figures

Figure 1
Figure 1
E2F2 levels are down‐regulated in the macrophages of mouse and human MASH livers, and negatively correlated with disease severity. A) A Uniform Manifold Approximation and Projection (UMAP) shows 32, 325 cells from 3 MASH mouse samples and 3 chow mouse samples, colored by major cell types. B) Heatmap showing the mean expression of top2 markers of each cell type. C) Dot plot showing the enrichment of major cell types via beta‐binomial generalized linear model. colors represent the differential cell types. D) UMAP plot showing the RNA expression of E2f2. E) Box plots showing the predicted transcriptional level of E2f2 in the major cell types between the Chow and MASH tissues. Colors represent the sample types. F) UMAP plot showing the specific clusters of macrophages (left). Bar plots showing the ratio of sample type in each cluster, violin plots showing the RNA expression of Ef2 in each cluster, and violin plots showing the transcriptional level of E2f2 (from left to right). G) Violin plots showing the RNA expression of E2f2 between Chow and MASH tissues in each cluster. H). UMAP plot showing the major cell types in the human healthy control, MASLD, and MASH tissues from GSE202379. I) Heatmap showing the mean expression of top 2 markers of each cell type. J) Heatmap showing the result of the Ro/e. K) UMAP plot showing the RNA expression of E2F2. L) Box plots showing the transcriptional level of E2F2 among disease stages in each cell type. M,N) E2F2 Protein and mRNA levels in hepatic macrophages isolated from WT mice livers. WT mice were fed the HFD, or control diet. O) Representative IF images showing E2F2 and F4/80 (green and red) in liver sections from WT mice fed the HFD, or control diet. n = 6/group; P) E2F2 Protein levels in hepatic macrophages isolated from human subjects without steatosis or with MASH livers. Q) Representative IF images showing E2F2 and CD68 (green and red) in liver sections from human subjects without steatosis, with simple steatosis, and with MASH. Data were presented as mean± SEM; Scale bars, 100µm; *p ≤ 0.05, **p ≤ 0.01, ***p ≤ 0.001.
Figure 2
Figure 2
Myeloid‐specific E2F2 deficiency aggravates the MASH progression. A–D) Liver weights (A), ratios of liver weight to body weight (B), body weight (C), and fasting blood glucose (D) of E2F2M‐KO mice and their corresponding E2F2FL/FL control after NC or HFD consumption (n = 6/group). E) Representative photographs of liver tissues from E2F2M‐KO and E2F2FL/FL mice fed with NC or HFD (n = 6/group). F) Serum ALT and AST concentrations in the indicated groups of mice (n = 6/group). G) Hepatic TG and TC content of mice in the indicated groups (n = 6/group). H,I) H&E, Oil Red O (H), and TEM (I) in liver sections from E2F2M‐KO and E2F2FL/FL mice fed with NC or HFD. (n = 6/group). J,K) Heatmap (J) and GO (K) reveal the signature genes and up‐regulated signaling pathways related to lipid metabolism in the liver samples of E2F2M‐KO mice compared with E2F2FL/FL mice. E2F2M‐KO and E2F2FL/FL mice were fed with HFD. (n = 3/group). L) The mRNA levels of lipogenesis genes (Pparg, Srebp‐1c, ChREBP, CD36, Apoa4 and Fasn) and β‐oxidation genes (Ppara, Acadi, Acox, and Cpt1a) in primary hepatocytes co‐cultured with BMDMs from E2F2M‐KO and E2F2FL/FL mice in palmitic acid (PA) medium for 24 h. M) Representative Western blot of Caspase3, cleaved Caspase3 (C‐Caspase3) and β‐catin in liver tissues from E2F2M‐KO and E2F2FL/FL mice fed with NC or HFD. n = 6/group. Data were presented as mean± SEM; Scale bars, 100µm; *p ≤ 0.05, **p ≤ 0.01, ***p ≤ 0.001.
Figure 3
Figure 3
E2F2 deficiency reprograms amino acid metabolism in macrophages by upregulating SLC7A5‐mediated leucine transportation. BMDMs from E2F2M‐KO and E2F2FL/FL mice co‐cultured with primary hepatocytes with or without palmitic acid (PA) medium treated for 24 h. A,B) Heatmap (A) and GO (B) reveal the signature genes and up‐regulated signaling pathways in BMDMs. n = 3/group. C) Representative Integrative Genomics Viewer (IGV) overview of CUT&Tag signals of SLC7A5 gene loci bound by E2F2. n = 6/group. D) ChIP‐PCR analysis of Nrf2 binding to the SLC7A5 promoter. n = 6/group. E) Putative E2F2‐ binding site (BS) within the genomic sequence adjacent to the transcription start site of SLC7A5 gene. F) Luciferase activities of SLC7A5 promoter reporter vectors in THP‐1 cells. Red characters in the binding regions suggest the putative or mutated E2F2‐binding sequences. H) BMDMs were stained with SLC7A5 (red), F4/80 (green), and DAPI (blue). Scale bars, 100µm. I) Heatmap analysis of amino acid metabolism in BMDMs. n = 5/group. J) Representative IF images showing mTORC1 and LAMP1 (green and red) in BMDMs. n = 6/group. K) Western blot analysis of total Raptor, acetylation of Raptor and E2F2 in hepatic macrophages isolated from E2F2M‐KO and E2F2FL/FL mice fed with HFD. n = 6/group. L) Uptake of 3H‐leucine in BMDMs. Data were presented as mean± SEM; Scale bars, 100µm; *p ≤ 0.05, **p ≤ 0.01, ***p ≤ 0.001.
Figure 4
Figure 4
E2F2 deficiency enhances macrophage proinflammatory response by promoting glycolysis and mitochondrial dysfunction in a Leu‐mTORC1‐dependent manner. BMDMs were isolated from E2F2M‐KO and E2F2FL/FL mice and co‐cultured with primary hepatocytes with or without palmitic acid (PA) medium treated for 24 h. A,B) Heatmap (A) and GO (B) reveal the signature genes and up‐regulated signaling pathways related to glycolysis and mitochondrial function in BMDMs. n = 3/group. C) Western blot analysis of Glut1 and PKM2 in hepatic macrophages isolated from E2F2M‐KO and E2F2FL/FL mice fed with HFD. n = 6/group. D) The mRNA of glycolysis‐related genes (Pgk1, Slc2a1, Hk2, Ldha, Pfkfb3, Pfkl, and Pkm2) in BMDMs. n = 6/group. E) The glycolytic rate and capacities of BMDMs were measured by real‐time recording of extracellular acidification rates (ECAR) after injection of glucose (Glu), oligomycin (OM), and 2‐DG. n = 6/group. F) The mRNA level of Tnfa, il6 and il1b in BMDMs isolated from E2F2M‐KO and E2F2FL/FL mice. n = 6/group. G) The amount of cytokines in culture supernatant from BMDMs isolated from E2F2M‐KO replenished with the indicated AAs. n = 6/group. H) mRNA expression of Tnf‐α, Il‐6, and Il‐1β in BMDMs isolated from E2F2M‐KO. n = 6/group. Data were presented as mean± SEM; *p ≤ 0.05, **p ≤ 0.01, ***p ≤ 0.001.
Figure 5
Figure 5
Knockdown of SLC7A5 in E2F2M‐KO mice attenuates HFD diet‐induced steatohepatitis. A,B) Liver weights (A) and ratios of liver weight to body weight (B) of AAV‐Con or AAV‐SLC7A5 treated E2F2M‐KO mice after HFD consumption. C) Serum ALT and AST concentrations in the indicated groups of mice. D) Hepatic TG and TC content of mice in the indicated groups. E–G) H&E, Oil Red O, TEM (E), CD11b and F4/80 (green and red) IF staining (F), P‐P70S6K and F4/80 (green and red)IF staining (G) in liver sections from AAV‐Con or AAV‐SLC7A5 treated E2F2M‐KO mice fed with HFD. n = 6/group. H) Western blot analysis of SLC7A5, P70S6K, P‐P70S6K and β‐actin in BMDMs. I) Uptake of 3H‐leucine in BMDMs. BMDMs isolated from E2F2M‐KO mice were treated with LV‐Con or LV‐SLC7A5, then co‐cultured with primary hepatocytes in palmitic acid (PA) medium for 24 h. J) representative Nile Red staining of primary hepatocytes co‐cultured with LV‐Con or LV‐SLC7A5 pre‐treated BMDMs isolated from E2F2M‐KO mice with or without palmitic acid (PA) medium for 24 h. Data were presented as mean± SEM; Scale bars, 100µm; *p ≤ 0.05, **p ≤ 0.01, ***p ≤ 0.001.
Figure 6
Figure 6
Macrophage E2F2 deficiency promotes hepatocyte lipid accumulation and hepatic stellate cell activation. A,B) Heatmap (A) and GO (B) reveal the signature genes and up‐regulated signaling pathways related to fibrosis in the liver samples of E2F2M‐KO mice compared with E2F2FL/FL mice. E2F2M‐KO and E2F2FL/FL mice were fed with HFD. (n = 3/group). C) Sirius Red, Masson, and α‐SMA IHC staining of liver sections from E2F2M‐KO and E2F2FL/FL mice fed with MCD or HFD. (n = 6/group). Scale bars, 100µm. D) Representative IF images showing MPO and α‐SMA (green and red) in liver sections from E2F2M‐KO and E2F2FL/FL mice fed with MCD or HFD. (n = 6/group). Scale bars, 100µm. E) Primary hepatocyte‐conditioned media was transferred to BMDMs for 48 h and then BMDM‐conditioned media was transferred to primary mouse hepatic stellate cells for 24 h. F,G) IF staining (F) and Western blot analysis (G) for α‐SMA in primary mouse hepatic stellate cells. (n = 6/group). Scale bars, 50µm. Data were presented as mean± SEM; *p ≤ 0.05, **p ≤ 0.01, ***p ≤ 0.001.
Figure 7
Figure 7
Genetic or pharmacological activation of macrophage Nrf2‐E2F2 signaling effectively attenuates the MASH progression. A) Nrf2 protein levels in hepatic macrophages isolated from WT mice livers. WT mice were fed the HFD, or control diet. B) Representative pictures in H&E and Oil Red O stained liver sections in Nrf2M‐KO and Nrf2FL/FL mice fed with HFD. C) Protein expression levels of Nrf2 and E2F2 in hepatic macrophages from Nrf2M‐KO and Nrf2FL/FL mice after HFD consumption. D) E2F2 promoter region targeted by the transcription factor, Nrf2. E) Representative Integrative Genomics Viewer (IGV) overview of CUT&Tag signals of E2F2 gene loci bound by Nrf2. F) ChIP‐PCR analysis of Nrf2 binding to the E2F2 promoter. G–J) Protein expression levels of E2F2, SLC7A5, P70S6K, P‐P70S6K and β‐actin in hepatic macrophages from WT mice after HFD consumption with PBS, RTA 408 (G and I) or CDDO (H and J) treatment. K) Representative pictures in H&E and Oil Red O stained liver sections in Nrf2M‐KO and WT HFD‐fed mice with PBS, RTA 408 or CDDO. n = 6/group. Data were presented as mean± SEM; Scale bars, 100µm; *p ≤ 0.05, **p ≤ 0.01, ***p ≤ 0.001.

References

    1. Rinella M. E., Lazarus J. V., Ratziu V., Francque S. M., Sanyal A. J., Kanwal F., Romero D., Abdelmalek M. F., Anstee Q. M., Arab J. P., Arrese M., Bataller R., Beuers U., Boursier J., Bugianesi E., Byrne C. D., Castro Narro G. E., Chowdhury A., Cortez‐Pinto H., Cryer D. R., Cusi K., El‐Kassas M., Klein S., Eskridge W., Fan J., Gawrieh S., Guy C. D., Harrison S. A., Kim S. U. p, Koot B. G., et al., J Hepatol 2023, 79, 1542. - PubMed
    1. Younossi Z., Anstee Q. M., Marietti M., Hardy T., Henry L., Eslam M., George J., Bugianesi E., Nat. Rev. Gastroenterol. Hepatol. 2018, 15, 11. - PubMed
    1. Llovet J. M., Zucman‐Rossi J., Pikarsky E., Sangro B., Schwartz M., Sherman M., Gores G., Nat. Rev. Dis. Primers 2016, 2, 16018. - PubMed
    1. Tincopa M. A., Anstee Q. M., Loomba R., Cell Metab. 2024, 36, 912. - PubMed
    1. Widjaja A. A., Singh B. K., Adami E., Viswanathan S., Dong J., D'Agostino G. A., Ng B., Lim W. W., Tan J., Paleja B. S., Tripathi M., Lim S. Y., Shekeran S. G., Chothani S. P., Rabes A., Sombetzki M., Bruinstroop E., Min L. P., Sinha R. A., Albani S., Yen P. M., Schafer S., Cook S. A., Gastroenterology 2019, 157, 777. - PubMed

Substances

LinkOut - more resources