

Predictive value of serological indices for guiding bundle of care to prevent the occurrence of poststroke fatigue for ischemic stroke survivors
- PMID: 39465711
- PMCID: PMC11460855
- DOI: 10.1097/MD.0000000000039991
Predictive value of serological indices for guiding bundle of care to prevent the occurrence of poststroke fatigue for ischemic stroke survivors
Abstract
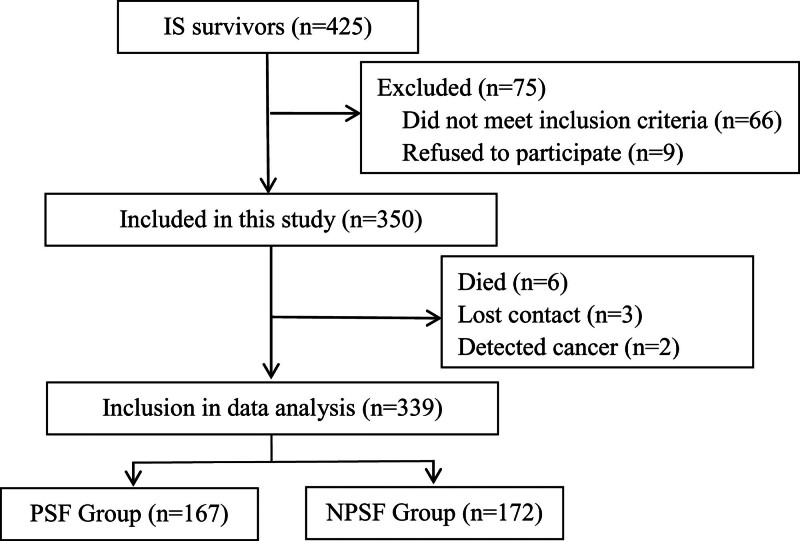
Almost half of ischemic stroke (IS) survivors have poststroke fatigue (PSF) during rehabilitation, which can reduce their rehabilitation compliance and quality of life. The primary link of PSF management is early identification, which can guide bundle of care for prevention. This study aimed to explore the predictive value of serological indicators for guiding bundle of care to prevent the occurrence of PSF among IS survivors. This study was a prospective observational study. A total of 350 patients with IS who were hospitalized in 2 tertiary hospitals in Nanning from October 2022 to September 2023 were selected. The general data of patients and serological indicators within 24 hours of admission were collected. Based on the follow-up results, the patients were divided into the PSF group and the NPSF group. Multivariate logistic regression analysis was used to screen the risk factors affecting the occurrence of PSF, and the receiver operating characteristic curve (ROC curve) method was used to analyze the predictive value of this factor. The incidence of acute-phase PSF among elderly patients with IS was 49.26%. The elevated levels of fasting plasma glucose (FPG) (OR = 1.485, 95% CI: 1.145-1.925, P = .003), total cholesterol (TC) (OR = 1.394, 95% CI: 1.013-1.917, P = .041), C-reactive protein (CRP) (OR = 1.394, 95% CI: 1.013-1.917, P = .041), and homocysteine (Hcy) (OR = 1.370, 95% CI: 1.233-1.524, P < .001) were risk factors of PSF in elderly patients with acute IS (P < .05). FPG (area under the curve = 0.632), TC (area under the curve = 0.621), CRP (area under the curve = 0.889), and Hcy (area under the curve = 0.807) had a good predictive value for acute-phase PSF, and the combination of the 4 indicators could further improve the predictive efficacy (area under the curve = 0.938, sensitivity 86.2%, specificity 90.7%, P < .05). The elevated levels of FPG, TC, CRP, and Hcy could predict the risk of PSF, and the combination of the 4 indicators can effectively improve prediction efficiency and provide a reference for guiding the formulation of bundle nursing programs.
Copyright © 2024 the Author(s). Published by Wolters Kluwer Health, Inc.
Conflict of interest statement
The authors have no conflicts of interest to disclose.
Figures

References
-
- Lerdal A, Bakken LN, Rasmussen EF, et al. Physical impairment, depressive symptoms and pre-stroke fatigue are related to fatigue in the acute phase after stroke. Disabil Rehabil. 2011;33:334–42. - PubMed
Publication types
MeSH terms
Substances
Grants and funding
LinkOut - more resources
Full Text Sources
Medical
Research Materials
Miscellaneous
