. 2024 Oct 11;103(41):e40060.
doi: 10.1097/MD.0000000000040060.

Identification of a potential sialylation-related pattern for the prediction of prognosis and immunotherapy response in small cell lung cancer

Affiliations

Identification of a potential sialylation-related pattern for the prediction of prognosis and immunotherapy response in small cell lung cancer

Yao Yu et al. Medicine (Baltimore). .

Abstract

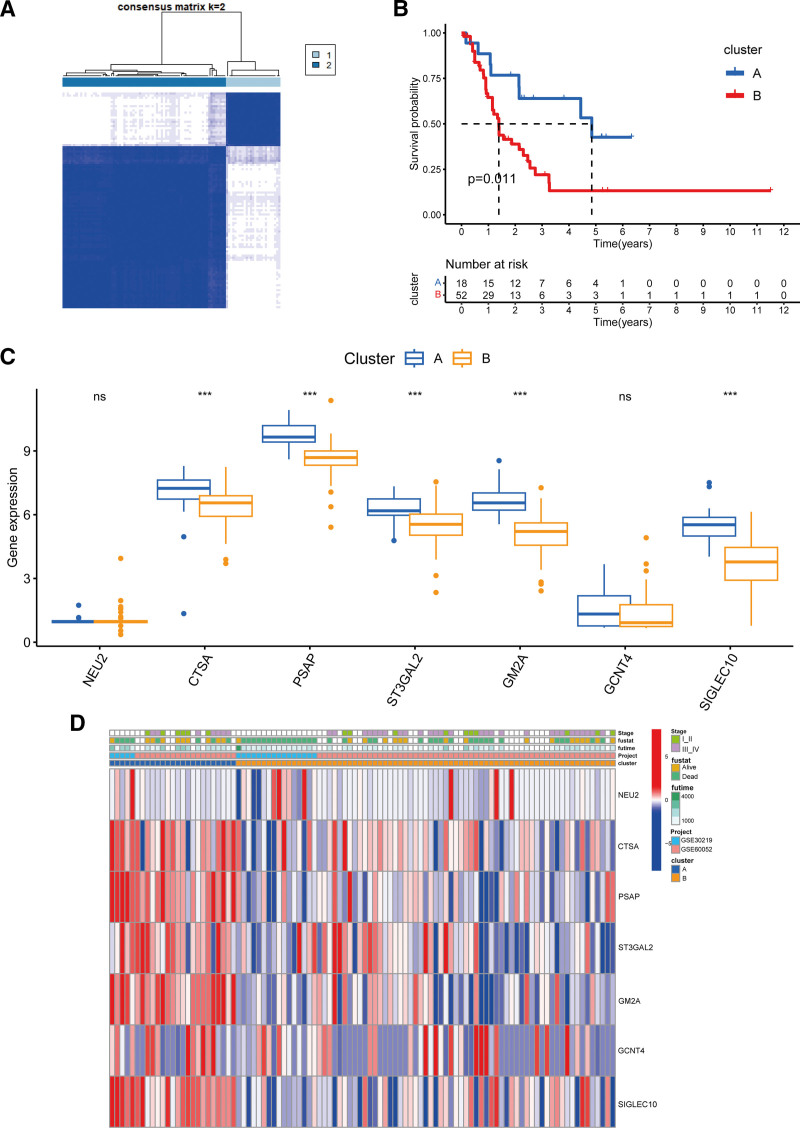
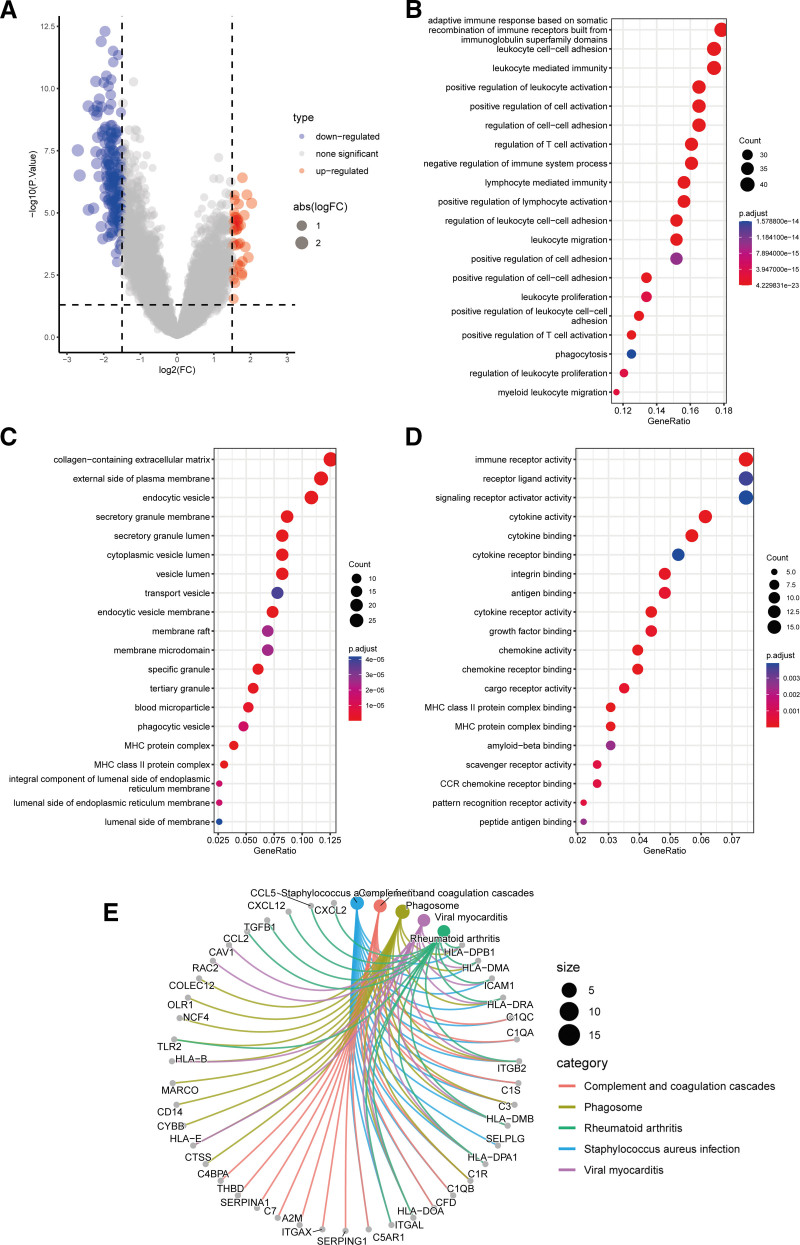
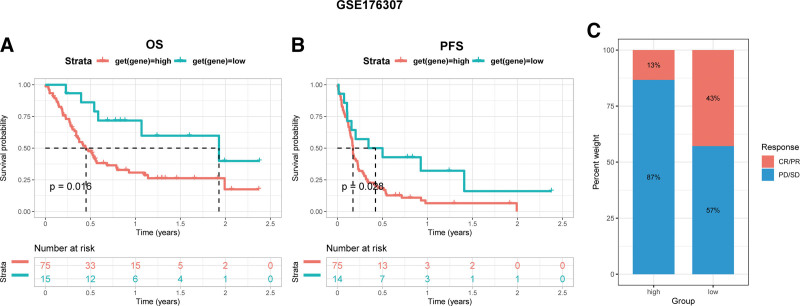
Our study aimed to establish a novel system for quantifying sialylation patterns and comprehensively analyze their relationship with immune cell infiltration (ICI) characterization, prognosis, and therapeutic sensitivity in small cell lung cancer (SCLC). We conducted a thorough assessment of the sialylation patterns in 100 patients diagnosed with SCLC. Our primary focus was on analyzing the expression levels of 7 prognostic sialylation-related genes. To evaluate and quantify these sialylation patterns, we devised a sialylation score (SS) using principal component analysis algorithms. Prognostic value and therapeutic sensitivities were then evaluated using multiple methods. The GSE176307 was used to verify the predictive ability of SS for immunotherapy. Our study identified 2 distinct clusters based on sialylation patterns. Sialylation cluster B exhibited a lower level of induced ICI therapy and immune-related signaling enrichment, which was associated with a poorer prognosis. Furthermore, there were significant differences in prognosis, response to targeted inhibitors, and immunotherapy between the high and low SS groups. Patients with high SS were characterized by decreased immune cell infiltration, chemokine and immune checkpoint expression, and poorer response to immunotherapy, while the low SS group was more likely to benefit from immunotherapy. This work showed that the evaluation of sialylation subtypes will help to gain insight into the heterogeneity of SCLC. The quantification of sialylation patterns played a non-negligible role in the prediction of ICI characterization, prognosis and individualized therapy strategies.


Conflict of interest statement

The authors have no funding and conflicts of interest to disclose.

Figures

Figure 1.
Figure 1.
Distinct sialylation-related patterns. (A) Consensus clustering matrix for k = 2. (B) Kaplan–Meier survival analyses for 2 different clusters. (C) Differential expression of prognostic sialylation-related genes between 2 clusters. (D) Heatmap of prognostic sialylation-related genes in 2 clusters. P values were showed as: *P < .05, **P < .01, ***P < .001, ****P < .0001, ns, no significance.
Figure 2.
Figure 2.
Differences in immune cell infiltration between clusters A and B. (A) Principal component analysis (PCA) for the transcriptome profiles of 2 clusters. (B) Differential expression levels of stromal, immune, and ESTIMATE scores between clusters A and B. (C) The abundance of each ICI in sialylation clusters A and B. P values were showed as: *P < .05, **P < .01, ***P < .001, ****P < .0001, ns, no significance.
Figure 3.
Figure 3.
GSVA enrichment analyses based on the Hallmark, KEGG, and Reactome gene sets in clusters A and B.
Figure 4.
Figure 4.
Functional enrichment analysis of DEGs between clusters A and B. (A) Identification of DEGs between clusters A and B. (B) GO analysis showed the biological process of the DEGs. (C) GO analysis showed the cellular component of the DEGs. (D) GO analysis showed the molecular function of the DEGs. (E) KEGG pathway enrichment analysis of DEGs between 2 clusters.
Figure 5.
Figure 5.
Construction of gene clusters based on DEGs. (A) Univariate cox regression analysis of DEGs with P < .001. (B) Consensus clustering matrix for k = 2. (C) Survival analyses for the 2 gene clusters based on the prognosis-related DEGs with P < .001. (D) Expression of prognostic DEGs with P < .001 in 2 gene clusters. (E) Differential expression of prognostic DEGs with P < .001 between 2 gene clusters. *P < .05, **P < .01, ***P < .001, ****P < .0001, ns, no significance.
Figure 6.
Figure 6.
Construction of a prognostic risk model. (A) Survival analysis for low- and high-risk group in SCLC patients. (B) Differential SS between dead and alive. (C) The proportion of survival status in low- and high-risk group. (D) Alluvial diagram showing the relationships of survival status, sialylation clusters, gene clusters, and risk score. (E) Correlations between SS and abundance of each ICI using Spearman analysis. Positive correlations are shown in red and negative correlations are shown in blue.
Figure 7.
Figure 7.
Characteristic of immune landscape between low- and high-risk groups. (A) Heatmap of expression levels of chemokines, interleukins, interferons, and their corresponding receptors, and other cytokines among the 2 risk subtypes. (B) Correlation of sialylation score with the hallmark pathways. (C) Immune checkpoint expression between low- and high-risk groups. *P < .05, **P < .01, ***P < .001, ****P < .0001, ns, no significance.
Figure 8.
Figure 8.
Prediction of immunotherapy efficacy by the risk model. (A) Survival analysis for OS between low- and high-risk groups in GSE176307. (B) Survival analysis for PFS between low- and high-risk groups in GSE176307. (C) Difference of responder between low- and high-risk groups in GSE176307.
Figure 9.
Figure 9.
Evaluation of drug sensitivity between low-risk and high-risk groups.

Similar articles

References

    1. Sung H, Ferlay J, Siegel RL, et al. . Global Cancer Statistics 2020: GLOBOCAN estimates of incidence and mortality worldwide for 36 Cancers in 185 Countries. CA Cancer J Clin. 2021;71:209–49. - PubMed
    1. Wang WZ, Shulman A, Amann JM, Carbone DP, Tsichlis PN. Small cell lung cancer: subtypes and therapeutic implications. Semin Cancer Biol. 2022;86(Pt 2):543–54. - PubMed
    1. George J, Lim JS, Jang SJ, et al. . Comprehensive genomic profiles of small cell lung cancer. Nature. 2015;524:47–53. - PMC - PubMed
    1. Horn L, Mansfield AS, Szczęsna A, et al. . First-Line Atezolizumab plus chemotherapy in extensive-stage small-cell lung cancer. N Engl J Med. 2018;379:2220–9. - PubMed
    1. Mathieu L, Shah S, Pai-Scherf L, et al. . FDA approval summary: Atezolizumab and Durvalumab in combination with platinum-based chemotherapy in extensive stage small cell lung cancer. Oncologist. 2021;26:433–8. - PMC - PubMed

Substances