A radiomics-based interpretable machine learning model to predict the HER2 status in bladder cancer: a multicenter study
- PMID: 39466475
- PMCID: PMC11519251
- DOI: 10.1186/s13244-024-01840-3
A radiomics-based interpretable machine learning model to predict the HER2 status in bladder cancer: a multicenter study
Abstract
Objective: To develop a computed tomography (CT) radiomics-based interpretable machine learning (ML) model to preoperatively predict human epidermal growth factor receptor 2 (HER2) status in bladder cancer (BCa) with multicenter validation.
Methods: In this retrospective study, 207 patients with pathologically confirmed BCa were enrolled and divided into the training set (n = 154) and test set (n = 53). Least absolute shrinkage and selection operator (LASSO) regression was used to identify the most discriminative features in the training set. Five radiomics-based ML models, namely logistic regression (LR), support vector machine (SVM), k-nearest neighbors (KNN), eXtreme Gradient Boosting (XGBoost) and random forest (RF), were developed. The predictive performance of established ML models was evaluated by the area under the receiver operating characteristic curve (AUC). The Shapley additive explanation (SHAP) was used to analyze the interpretability of ML models.
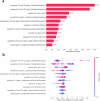
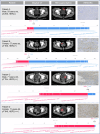
Results: A total of 1218 radiomics features were extracted from the nephrographic phase CT images, and 11 features were filtered for constructing ML models. In the test set, the AUCs of LR, SVM, KNN, XGBoost, and RF were 0.803, 0.709, 0.679, 0.794, and 0.815, with corresponding accuracies of 71.7%, 69.8%, 60.4%, 75.5%, and 75.5%, respectively. RF was identified as the optimal classifier. SHAP analysis showed that texture features (gray level size zone matrix and gray level co-occurrence matrix) were significant predictors of HER2 status.
Conclusions: The radiomics-based interpretable ML model provides a noninvasive tool to predict the HER2 status of BCa with satisfactory discriminatory performance.
Critical relevance statement: An interpretable radiomics-based machine learning model can preoperatively predict HER2 status in bladder cancer, potentially aiding in the clinical decision-making process.
Key points: The CT radiomics model could identify HER2 status in bladder cancer. The random forest model showed a more robust and accurate performance. The model demonstrated favorable interpretability through SHAP method.
Keywords: Bladder cancer; Computed tomography; HER2; Machine learning; Radiomics.
© 2024. The Author(s).
Conflict of interest statement
The authors declare that they have no competing interests.
Figures


References
Grants and funding
LinkOut - more resources
Full Text Sources
Research Materials
Miscellaneous

