. 2025 Mar;80(3):715-737.
doi: 10.1111/all.16369. Epub 2024 Oct 28.

STING-dependent induction of neutrophilic asthma exacerbation in response to house dust mite

Affiliations

STING-dependent induction of neutrophilic asthma exacerbation in response to house dust mite

Yasmine Messaoud-Nacer et al. Allergy. 2025 Mar.

Abstract

Background: Severe refractory, neutrophilic asthma remains an unsolved clinical problem. STING agonists induce a neutrophilic response in the airways, suggesting that STING activation may contribute to the triggering of neutrophilic exacerbations. We aim to determine whether STING-induced neutrophilic lung inflammation mimics severe asthma.

Methods: We developed new models of neutrophilic lung inflammation induced by house dust mite (HDM) plus STING agonists diamidobenzimidazole (diABZI) or cGAMP in wild-type, and conditional-STING-deficient mice. We measured DNA damage, cell death, NETs, cGAS/STING pathway activation by immunoblots, N1/N2 balance by flow cytometry, lung function by plethysmography, and Th1/Th2 cytokines by multiplex. We evaluated diABZI effects on human airway epithelial cells from healthy or patients with asthma, and validated the results by transcriptomic analyses of rhinovirus infected healthy controls vs patients with asthma.

Results: DiABZI administration during HDM challenge increased airway hyperresponsiveness, neutrophil recruitment with prominent NOS2+ARG1- type 1 neutrophils, protein extravasation, cell death by PANoptosis, NETs formation, extracellular dsDNA release, DNA sensors activation, IFNγ, IL-6 and CXCL10 release. Functionally, STING agonists exacerbated airway hyperresponsiveness. DiABZI caused DNA and epithelial barrier damage, STING pathway activation in human airway epithelial cells exposed to HDM, in line with DNA-sensing and PANoptosis pathways upregulation and tight-junction downregulation induced by rhinovirus challenge in patients with asthma.

Conclusions: Our study identifies that triggering STING in the context of asthma induces cell death by PANoptosis, fueling the flame of inflammation through a mixed Th1/Th2 immune response recapitulating the features of severe asthma with a prognostic signature of type 1 neutrophils.

Keywords: DNA sensing; asthma exacerbation; cGAMP; cell death; diABZI; with inserts.


Conflict of interest statement

M.S. reports research grants from Swiss National Science Foundation (nr 310030_189334/1), Novartis Foundation for Medical‐Biological Research, GSK, and Stiftung vorm. Buendner Heilstaette Arosa; speaker's fee from AstraZeneca; voluntary positions in the European Academy of Allergy and Clinical Immunology (EAACI) as Executive Board member and Basic and Clinical Immunology Section Chair. S.L.J. reports grants/contracts from European Research Council ERC FP7 grant number 233015, Chair from Asthma UK CH11SJ, Medical Research Council Centre grant number G1000758, NIHR Biomedical Research Centre grant number P26095, Predicta FP7 Collaborative Project grant number 260895, NIHR Emeritus NIHR Senior Investigator; consulting fees from Lallemand Pharma, Bioforce, resTORbio, Gerson Lehrman Group, Boehringer Ingelheim, Novartis, Bayer, Myelo Therapeutics GmbH; patents issued/licensed: Wark PA, Johnston SL, Holgate ST, Davies DE. Anti‐virus therapy for respiratory diseases. UK patent application No. GB 0405634.7, 12March 2004. Wark PA, Johnston SL, Holgate ST, Davies DE. Interferon‐Beta for Anti‐Virus Therapy for Respiratory Diseases. International Patent Application No. PCT/GB05/50031, 12 March 2004. Davies DE, Wark PA, Holgate ST, Johnston SL. Interferon Lambda therapy for the treatment of respiratory disease. UK patent application No. 6779645.9, granted15th August 2012; Participation on a data safety monitory board or advisory board: Enanta Chair of DSMB, Virtus Respiratory Research Ltd. Shareholder and Board membership. All other authors declare no competing interests.

Figures
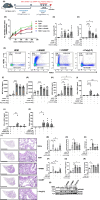
FIGURE 1
FIGURE 1
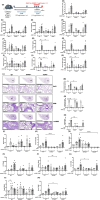
Endogenous STING agonists promote lung neutrophilia and exacerbate allergic airway inflammation. (A) Mice sensitized with HDM on day 0 and 7 (25 μg/mouse, i.n.) and challenged with HDM on day 14–16 (10 μg/mouse, i.n.) received either diABZI (1 μg/mouse, i.t.), cGAMP (10 μg/mouse, i.t.), or Poly(I:C) (200 μg/mouse, i.t.) on day 14–16, and were analyzed on day 17. (B) Airway resistance to increased doses of methacholine (50–200 mg/mL Mch) was measured 24 h after the last HDM/agonist challenges. (C) Eosinophil and (D) neutrophil counts in BAL. (E) Flow cytometry analysis of NOS2/ARG1 expressing neutrophils pre‐gated on singlet cells, and CD45+CD11b+Ly6G+F4/80SiglecF cells. (F, G) Myeloperoxidase (MPO) concentrations in BALF and lung determined by ELISA. (H) dsDNA measured in the acellular fraction of the BAL. (I) IFNγ, (J) IFN‐α and (K) IFN‐β concentrations in BALF measured by multiplex immunoassay. (L) Histology of lung sections stained with PAS, with semi quantitative pathology scoring of (M) goblet cells, (N) peribronchial infiltrates and (O) epithelial injury. Bars, left panel: 2.5 mm, right panel: 250 μm. (P) Muc5ac transcripts measured by real‐time PCR (Q, R) Muc5ac protein in BALF and lung measured by ELISA. (S) Immunoblots of phospho‐STAT6 and STAT6 with Actinβ as a reference. Data were presented as mean ± SEM with n = 6–8 mice per group. Each point represents an individual mouse. *p < 0.05, **p < 0.01, ***p < 0.001, ****p < 0.0001 (Nonparametric Kruskal–Wallis with Dunn's post‐test).
FIGURE 2
FIGURE 2
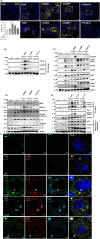
NETosis, apoptosis, pyroptosis and necroptosis (PANoptosis) as main sources of airway dsDNA exacerbating HDM‐induced lung inflammation. Mice sensitized and challenged with HDM received either diABZI, cGAMP, or Poly(I:C) as in Figure 1, and were analyzed on day 17. (A) Visualization of NETs formation in lung tissue with the staining of DNA dye DAPI (Blue) and MPO (Yellow). Bars (20 μm). Tissue fluorescence intensity (TFI) of MPO staining in lung. (B) Immunoblot highlighting DNA damage with expression of Cit‐H3, phospho‐γH2AX and γH2AX with Actinβ as a reference. (C) Immunoblot of STING axis including phospho‐STING, STING dimer, STING, phospho‐TBK1, TBK1 and DNA sensors including cGAS, DDX41 and IFI204 with Actinβ as a reference. (D) Immunoblot of inflammasome activation including AIM2, NLRP3, caspase‐11, cleaved caspase‐11, IL‐1β, cleaved IL‐1β and IL‐18 with Actinβ as a reference. (E) Immunoblot of cell death axis showing cleaved caspase‐3, caspase‐3, MLKL, cleaved GSDMD, GSDMD, ZBP1, caspase‐8, and RIPK3 with Actinβ as a reference. The analysis of cell damage, cell death and PANoptosis (B, E) was performed in the same membrane, therefore the same Actinβ control is shown. (F) Confocal microscopy showing caspase‐8 (green), ASC (red), RIPK3 (far‐red/turquoise blue) and DNA dye DAPI (cyan) in BAL cells showing the colocalization of PANoptosome components. Bars, 2 μm. p value ﹤0.05 was considered significant. *p ﹤ 0.05.
FIGURE 3
FIGURE 3
Asthma exacerbation induced by diABZI‐STING glucocorticoid resistance. (A) Wild‐type mice (WT) were sensitized with HDM on day 0 and 7 (25 μg/mouse, i.n.), challenged with HDM on day 14–16 (10 μg/mouse, i.n.) without or with diABZI (1 μg/mouse, i.t.) and Budesonide (0.3 or 1 mg/kg), and analyzed on day 17. (B) Eosinophil and (C) neutrophil counts in BAL. (D, E) Myeloperoxidase (MPO) concentrations in BALF and lung determined by ELISA. (F) dsDNA measured in the acellular fraction of the BALF. (G) IFNγ, (H) IFN‐α and (I) IFN‐β concentrations in BALF measured by multiplex immunoassay. (J, K) TNF‐α and IL‐6 in BALF determined by ELISA. (L) IL‐4, (M) IL‐5 and (N) IL‐13 concentrations in BALF measured by ELISA. Epithelial‐derived alarmins (O), IL‐33, (P, Q) Immunoblot of IL‐25 protein and quantification. Data were presented as mean ± SEM with n = 8 mice per group. Each point represents an individual mouse. *p < 0.05, **p < 0.01, ***p < 0.001, ****p < 0.0001 (Nonparametric Kruskal–Wallis with Dunn's post‐test).
FIGURE 4
FIGURE 4
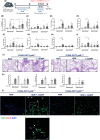
STING dependence of the neutrophilic airway inflammation exacerbation. (A) Wild‐type (WT), STING−/− or cGAS−/− mice were sensitized with HDM on day 0 and 7 (25 μg/mouse, i.n.), challenged with HDM on day 14–16 (10 μg/mouse, i.n.) without or with diABZI (1 μg/mouse, i.t.), and analyzed on day 17. (B) Neutrophils count in BAL. (C, D) MPO concentration in BALF and lung determined by ELISA. (E) dsDNA concentration in the BAL acellular fraction. (F) Protein concentration in BALF. (G) IFN‐γ in BALF determined by multiplex immunoassay. (H, I) TNF‐α in BALF and lung determined by ELISA. (J) IL‐6 and (K) CXCL10/IP‐10 concentration in BALF measured by ELISA. (L) Histology of lung tissues stained with PAS of WT, STING−/− and cGAS−/− mice, with semi quantitative pathology scoring of (M) peribronchial infiltrates, (N) goblet cells and (O) epithelial injury. Bars, upper panel: 2.5 mm, lower panel: 250 μm. (P–W) Muc5ac, Tmem173, Mb21d1, Il‐13 Serpin1, Clc1, Spdef and Socs1 transcripts measured by real‐time qPCR. Data were presented as mean ± SEM with n = 6 ~ 8 mice per group. Each point represents an individual mouse. *p < 0.05, **p < 0.01, ***p < 0.001, ****p < 0.0001 (Nonparametric Kruskal–Wallis with Dunn's post‐test).
FIGURE 5
FIGURE 5
STING‐deficient macrophages and granulocytes mitigates asthma exacerbation in vivo in the lung. (A) STING‐OSTflLysMcre/+ or STING‐OSTflLysM+/+ mice were sensitized with HDM on day 0 and 7 (25 μg/mouse, i.n.), challenged with HDM on day 14–16 (10 μg/mouse, i.n.) without or with cGAMP (10 μg/mouse, i.t.), and analyzed on day 17. (B) Eosinophils and (C) Neutrophils counts in BAL. (D) MPO concentration in BALF measured by ELISA. (E) dsDNA measured in the acellular fraction of the BAL. (F) Concentration of IFN‐α and (G) IFN‐β in BALF measured by luminex immunoassay. (H) IL‐6 concentration (I) and TNF‐α concentration in BALF measured by ELISA. (J) Lung tissue histology with PAS staining of STING‐OSTflLysMcre+ or STING‐OSTflLysM+/+ mice with semi quantitative pathology scoring of (K) peribronchial infiltrates, epithelial injury and goblet cells. (L) Visualization of NETs in BAL with the staining of DNA dye DAPI (blue), MPO (Green), CitH3 (Red). Bars, 20 μm. Data were presented as mean ± SEM with n = 8 ~ 13 mice per group. Each point represents an individual mouse. *p < 0.05, **p < 0.01, ***p < 0.001 (Nonparametric Kruskal–Wallis with Dunn's post‐test).
FIGURE 6
FIGURE 6
Epithelial cells contribute to the process of STING agonists‐induced neutrophilic asthma exacerbation. (A) Immunofluorescence staining of Zonulin‐1 (ZO‐1) (RED) in lung tissue sections from mice treated by HDM and challenged or not with diABZI, cGAMP, or Poly(I:C) as in Figure 1, counterstained with DAPI (Blue). Upper panel: 20 μm, lower panel: 5 μm. Immunoblots of human airway epithelial cell (hAEC) stimulated with HDM at 100 μg/mL alone or in combination with diABZI (10 μM), cGAMP (14 μM) or Poly(I:C) (100 μg/mL) for 2 or 24 h showing (B) STING pathway activation including phospho‐STING, STING, phospho‐TBK1, TBK1, phospho‐IRF3, IRF3, phospho‐STAT6 and STAT6, with Actinβ as a reference. (C) DNA damage and cell death axis including phospho‐γH2AX, γH2AX, phospho‐MLKL, MLKL and Actinβ as a reference. (D‐M) Cytokine concentrations of (D, I) IL‐8/CXCL8, (E, J) IFN‐β, (F, K) IP‐10/CXCL10, (G, L) IL‐6 and (H, M) TNF‐α in cell culture supernatant were measured by multiplex immunoassay at 2 h (D‐H) and 24 h (I–M). Data were presented as mean ± SEM with n = 3 independent wells from the same donor. (N) Human airway epithelium (MUCILAIR™) from a single healthy donor or patient with asthma were restimulated on the apical face, with HDM at 100 μg/mL alone or in combination with diABZI at 10 μM, cGAMP at 14 μM or Poly(I:C) at 100 μg/mL. At 6 h post‐stimulation, (O) Lactate dehydrogenase (LDH) concentration was determined in the supernatant. (P–U) Multiplex immunoassay of IFN‐α (P), IFN‐β (Q), IFN‐λ (R), IP‐10/CXCL‐10 (S), IL‐6 (T) and TNF‐α (U) concentrations in the supernatant. (V) MUC5AC transcripts measured by real‐time PCR. (W) Immunoblot from epithelial cell homogenates from healthy and patients with asthma showing the expression of phospho‐γH2AX with Actinβ as a reference. Data were presented as mean ± SEM with n = 3 independent wells from the same donor. *p < 0.05. (D–M) Nonparametric Kruskal–Wallis with Dunn's post‐test. (O–V) Two‐way ANOVA followed by Sidak multiple comparison test.
FIGURE 7
FIGURE 7
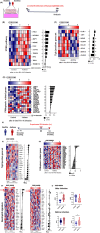
Upregulation of DNA sensing and PANoptosis pathways upon rhinovirus infection in patients with asthma. (A) Human bronchial epithelial cells (HBECs) from patients with asthma (n = 6) and healthy controls (n = 6), were infected with RV‐A16 for 24 h, and subjected to transcriptome analysis. (B‐E) Heatmaps presented together with the corresponding log2 fold change (FC) expression changes (black bars) of (B) STING pathway‐related genes, (C) Tight junction genes set, (D) PANoptosis‐related genes, after in vitro RV‐A16 infection in controls compared to HBEC from patients with asthma. Transcriptomic data were processed with the workflow available on https://github.com/uzh/ezRun. (E) Experimental in vivo RV‐A16 infection in patients with asthma (n = 17) and healthy individuals (n = 7): Transcriptomic analysis of bronchial brushings 14 days before and 4 days after in vivo infection. (F–G) Heatmaps presented together with the corresponding log2 fold change (FC) expression changes (black bars) of (F) Tight junction genes set, (G) PANoptosis‐related genes, after in vivo RV‐A16 infection in controls compared to patients with asthma. (H) Heatmaps of neutrophilic signature before (right panel) and after (left panel) infection in controls compared to patients with asthma. (I) Violin plots representing gene expressing of NOS2 and ARG1 in healthy individual and patients with asthma, before (lower set) and after (Upper set) infection. Data was analyzed with Bioconductor microarray analysis workflow [https://www.bioconductor.org/packages/release/workflows/vignettes/arrays/inst/doc/arrays.html]. All Heatmaps display normalized gene expression across the groups (row normalization). Asterisks demonstrate significantly changed genes with threshold p < 0.05. p‐value: * < 0.05. Publicly available data under accession number: GSE185658 and GSE61141. Source data are provided as Source Data files.

References

    1. Hammad H, Lambrecht BN. The basic immunology of asthma. Cell. 2021;184(6):1469‐1485. - PubMed
    1. Schiffers C, Hristova M, Habibovic A, et al. The transient receptor potential channel vanilloid 1 is critical in innate airway epithelial responses to protease allergens. Am J Respir Cell Mol Biol. 2020;63(2):198‐208. - PMC - PubMed
    1. Agache I. Severe asthma phenotypes and endotypes. Semin Immunol. 2019;46:101301. - PubMed
    1. Cardoso‐Vigueros C, von Blumenthal T, Ruckert B, et al. Leukocyte redistribution as immunological biomarker of corticosteroid resistance in severe asthma. Clin Exp Allergy. 2022;52(10):1183‐1194. - PMC - PubMed
    1. Fahy JV. Type 2 inflammation in asthma—present in most, absent in many. Nat Rev Immunol. 2015;15(1):57‐65. - PMC - PubMed