. 2024 Dec;20(51):e2310522.
doi: 10.1002/smll.202310522. Epub 2024 Oct 28.

Nanoplatforms for Magnetic-Photo-Heating of Thermo-Resistant Tumor Cells: Singular Synergic Therapeutic Effects at Mild Temperature

Affiliations

Nanoplatforms for Magnetic-Photo-Heating of Thermo-Resistant Tumor Cells: Singular Synergic Therapeutic Effects at Mild Temperature

Binh T Mai et al. Small. 2024 Dec.

Abstract

A self-assemble amphiphilic diblock copolymer that can incorporate iron oxide nanocubes (IONCs) in chain-like assemblies as heat mediators for magnetic hyperthermia (MHT) and tuneable amounts of IR780 dye as agent for photothermal therapy (PTT) is developed. MHT-heating performance of photobeads in viscous media have the same heat performances in water at magnetic field conditions of clinical use. Thanks to IR780, the photobeads are activated by infrared laser light within the first biological window (808 nm) with a significant enhancement of photo-stability of IR780 enabling the raise of the temperature at therapeutic values during multiple PTT cycles and showing unchanged optical features up to 8 days. Moreover, the photobeads fluorescent signal is preserved once internalized by glioblastoma multiforme (GBM) cells. Peculiarly, the photobeads are used as toxic agents to eradicate thermo-resistant GBM cells at mild heat, as low as 41 °C, with MHT and PTT both of clinical use. Indeed, a high U87 GBM cell mortality percentage is obtained only with dual MHT/PTT while each single treatment dose not provide the same cytotoxic effects. Only for the combined treatment, the cell death mechanism is assigned to clear sign of apoptosis as observed by structural/morphological cell studies and enhanced lysosome permeability.

Keywords: combined cancer therapy; lysosomal permeabilization; mild hyperthermia; polymeric nanostructures; thermal resistant cancer.


Conflict of interest statement

The authors declare no conflict of interest.

Figures
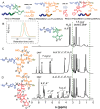
Figure 1
Figure 1
Summary of the amphiphilic diblock copolymers synthesis and NMR characterization. a) Scheme of the synthetic approach used to produce diblock copolymer made of PEG, benzyl pendant and diol derivate. Starting with the synthesis of a diblock copolymer made of PEG and activated ester N‐succinimidyl methacrylate (NSMA) gives PEG‐b‐PNSMA polymer. The NSMA derivate is used as reactive precursor in the second step to introduce propandiol and furfuryl side groups by means of aminolysis reaction. The latter was then clicked with benzyl maleimide in a last reaction step to yield a hydrophobic polymer that has Diels‐Alder adducts as side groups. b) 1H NMR spectrum of PEG‐b‐PNSMA recorded in DMSO‐d6, inset: the SEC traces of pristine PEG‐b‐PNSMA (green) and the one upon the aminolysis reaction with furfuryl amine and 3‐amino‐1,2‐propanediol. c and d) depict the 1H NMR spectra of PEG‐b‐P(FuranMAm‐co‐DiolMAm) and the one after the Diels‐Alder reaction with benzylmaleimide (PEG‐b‐P(BenzylMAm‐co‐DiolMAm), respectively.
Figure 2
Figure 2
Preparation of polymer nanobeads encapsulating IONCs and IR780 via the self‐assembly process. a) Schematic illustration of the self‐assembly process to prepare magnetic photobeads. The first step involves the addition of a selection solvent (H2O) into a solution of surface modified IONCs, polymer and IR780 dissolved in a non‐selective solvent mixture (THF/DMF). Magnetic photobeads were cleaned by means of magnetic separation. DLS traces b) (weighted by number) and TEM images c–g) of obtained magnetic photobeads when different amounts of IR780 were used. C, D, E, F and G correspond to samples PT‐0, PT‐1, PT‐2, PT‐3, PT‐4 (TEM scale bar of 200 nm for low magnification and 100 nm for the inset figures at higher magnifications). In PT‐0, no IR780 was added while the feeding dye to Fe ratios (µg per mg) was 125, 188, 219 and 313 for PT‐1, PT‐2, PT‐3 and PT‐4 respectively.
Figure 3
Figure 3
Magnetic hyperthermia and photothermal properties characterizations of photobeads. A) TEM image of IONCs with inset the histogram of their TEM size distribution. B) TEM images and C) Histogram of TEM size distribution of PT‐2 Photobeads, respectively. D) Vis‐NIR absorption spectra of PT‐2 photobeads samples having optimal loading capacity of IR780 at soon after the preparation (day 0, black dots) and at day 8 (red dots). E) Normalized Photolµminescent (PL) spectra of IR780 dye in DMF and photobeads that contains 7.2 µg of IR780 per mgFe (PT‐2). To note, all data points of the PL spectra of each of the samples were divided by the maximal emission intensity recorded at 810 nm to make the maximal emission in PL spectra equals to 1. F) SAR values of photobeads containing different amounts of IR780. G) SAR values of IR780 free photobeads (PT‐0) as a function of glycerol concentration. H) The comparison between SAR values of PT‐2 measured in viscous media (81% glycerol) and in water at 24 kA m−1 at well‐defined frequencies (105, 217, and 300 kHz) and I) The heating profiles of PT‐2 upon the exposure to laser of 808 nm (4.67 W cm2) (first three cycles shaded in red) and combined MHT (24 kA m−1, 120 kHz) and PTT (last cycle shaded in green).
Figure 4
Figure 4
Confocal imaging of U87 GBM cells labelled with PT‐2 after 24 and 48 h of incubation and comparison to untreated U87 cells (control). NIR Red channel with excitation at 750 nm and collection of emission at 745 ± 35 nm, show a clear red PL signal indicating the internalization of the photobeads in U87 MG cells after 24 and 48 h of continuous incubation. Black spots in transmission light images correspond to the dark contrast of the magnetic photobeads. From these same images no sign of cell sufferance can be seen. Scale bar: 20 µm.
Figure 5
Figure 5
Photobeads as dual MHT and PTT agents. A) Scheme of in vitro efficacy experiment using PT‐2 photobeads to treat cancer cells by combining MHT and PTT following either simultaneous (Si) or subsequent (Su) treatment. B) Cell viability experiment in which U87 cells were exposed to thermal bath set at 43 and 47 °C for a similar time exposure of dual PTT+MHT experiments. Even at the highest temperature of 47 °C, the cells recovered in viability after 72 h, indicating the heat‐resistant characteristic of U87 cells. Values are presented as means with error bars indicating the standard deviation (SD) for n = 3 independent experiments. Statistical analysis was performed using one‐way ANOVA with a Tukey´s post hoc test. *p = 0.015. C) Heating profiles of cell pellets and PT‐2 under PTT only (1.0 W cm2, red) or MHT only (16 kA m−1 and 282 kHz, orange) or simultaneous exposure to MHT (30 min each cycle at 16 kA m−1 and 282 kHz followed by 5 min interval) and PTT (0.9 W cm2) (deep red). The maximum temperature of 47 °C was reached in the case of exposure to PTT alone or PTT+MHT. D) Viability results of U87 GBM cells subjected to different conditions: PT‐2 (green bar), PT‐2 + MHT only (blue bar), PT‐2 + PTT only (yellow bar), PT‐2 + dual treatment applied simultaneously (Si‐PTT+MHT). To compare the effect of therapeutic temperature on cell death, the maximum temperature to reach by dual treatment was set to be 40, 43 and 47 °C. In all Si‐PTT+MHT cases, viability less than 15% was recorded after 72 h. Values are presented as means with error bars indicating the standard deviation (SD) for n = 3 independent experiments. Statistical analysis was performed using one‐way ANOVA with a Tukey´s post hoc test. **p = 0.007. E) Heating profiles of the cell pellets treated with PT‐2 and exposed to 0.9 W cm2 laser reaching 45 °C (orange curve) or exposed to 0.7 W cm2 reaching a maximum temperature of 40 °C (red curve) followed by the MHT application reaching, in this case, a temperature of 23 °C. F) Viability results of U87 GBM cells that are subsequently (one after the other) treated by PTT and MHT (Su‐PTT+MHT) reaching a maximum temperature of 40 or 45 °C (very similar but not exactly the same temperature reached for the Si‐PTT+MHT). Values are presented as mean with error bars indicating the standard deviation (SD) for n = 3 independent experiments. Statistical analysis was performed using one‐way ANOVA with a Tukey´s post hoc test. *p = 0.024.
Figure 6
Figure 6
Comparative SEM and TEM morphological characterizations of cells undergoing different treatment conditions at low A1, A3. A5 and A7 and B1, B3, B5 and B7) and high A2, A4, A6 and A8 and B2, B4, B6 and B8) magnification. A1‐2) SEM images of control untreated U87 cells. Dashed blue box A1) is indicating a detail of a cell at higher magnification A2); A3‐A4) SEM images of U87 cells treated with PT‐2 (NPs) materials; A5‐A6) SEM images of cells undergoing only PTT. Dashed blue box A5) indicates a detail of a cell at higher magnification (A6); (A7‐A8) SEM images of cells undergoing PTT and MHT one after the other. Dashed red box A7) is indicating a detail of a cell at higher magnification A8). The round shape cells as well as the round bumps visible at high magnification (green arrows) on the cell membrane indicate the ongoing process of apoptosis cell death. B1‐B2) TEM images of control untreated U87 cells, B3‐B4) TEM images of U87 cells treated with PT‐2 (NPs) materials; (B5‐B6) TEM images of cells undergoing only PTT (B7‐B8) TEM images of cells undergoing PTT and MHT one after the other. In this experiment, some U87 cell pellets were exposed to PT‐2 ([Fe] = 3.6 g L−1) and treated with only PTT (laser 808 nm, 1.0 W cm−2, reaching 45 °C) (dashed blue boxes are indicating cell details at higher magnification), or a subsequent PTT and MHT treatment (PTT under an 808nm‐laser at 1. 0 W cm−2, reaching 45 °C and MHT at 16 kA m−1, 282 kHz, reaching a temperature of 25 °C) (dashed red boxes are indicating a detail of a cell at higher magnification and red arrows are highlighting the presence of endocyted photobeads into cells). SEM images were taken at 1000X magnification for low magnification images and 3000X magnification for high magnification images. TEM pictures were taken at10 000X magnification for low magnification images and 25 000X magnification for high magnification pictures.
Figure 7
Figure 7
Investigating lysosomes permeability via lysotracker assays. A) Upon exposure to different treatments cells were incubated with lysotracker, a dye that turns to be more fluorescent in response to acidic lysosomal pH. Confocal images B–G) and confocal and bright field merged channels B1–G1) of cells differently treated: control cells B/B1), cells treated with PT‐2 photobeads only C/C1), cells treated with PT‐2 photobeads and undergoing MHT D/D1), cells treated with PT‐2 photobeads and undergoing PTT E/E1) and cells treated with PT‐2 photobeads and undergoing dual PTT+MHT one after the other F/F1 and G/G1), respectively. The cells group undergoing dual PTT+MHT has a bright fluorescent signal which appears spread all over the cell body as a clear indication of the lysosomal disfunctions F/F1 and G/G1). From B/B1 to F/F1 magnification of 10X. Panels G/G1 are a detailed magnification (20X) of treated cells with the combined therapy PTT+MHT. Scale bar: Control B/B1 20 µm; NPs C/C1: 50 µm; MHT D/D1: 20 µm; PTT E/E1: 20 µm; PTT+MHT F/F1: 20 µm. H) Quantitative PL intensity signal analysis of different cell groups after staining with lysotracker. Images for the PL analysis quantification for each of the groups (Control, PT‐2, MHT, PTT, PTT+MHT) were taken under the same confocal experimental conditions (20X magnification and under the same confocal setting parameters). PL intensity represents the mean value of three independent experiments with error bars indicating the standard deviation (SD). Statistical analysis was performed using one‐way ANOVA with a Dunn´s post hoc test. ***p = <0001. Black asterisks indicate statistical differences found in PTT+MHT versus PTTs experimental conditions. Red line shows statistical differences between PTT versus MHT experimental conditions.

References

    1. Sung H., Ferlay J., Siegel R. L., Laversanne M., Soerjomataram I., Jemal A., Bray F., Ca‐Cancer J. Clin. 2021, 71, 209. - PubMed
    1. Miller K. D., Fidler‐Benaoudia M., Keegan T. H., Hipp H. S., Jemal A., Siegel R. L., Ca‐Cancer J. Clin. 2020, 70, 443. - PubMed
    1. Helmink B. A., Khan M. W., Hermann A., Gopalakrishnan V., Wargo J. A., Nat. Med. 2019, 25, 377. - PubMed
    1. Fan W., Yung B., Huang P., Chen X., Chem. Rev. 2017, 117, 13566. - PubMed
    1. Chang D., Lim M., Goos J. A., Qiao R., Ng Y. Y., Mansfeld F. M., Jackson M., Davis T. P., Kavallaris M., Front. Pharmacol. 2018, 9, 831. - PMC - PubMed

Publication types

Substances

LinkOut - more resources