. 2024 Dec;11(48):e2409499.
doi: 10.1002/advs.202409499. Epub 2024 Oct 28.

Dexmedetomidine Ameliorates Myocardial Ischemia-Reperfusion Injury by Inhibiting MDH2 Lactylation via Regulating Metabolic Reprogramming

Affiliations

Dexmedetomidine Ameliorates Myocardial Ischemia-Reperfusion Injury by Inhibiting MDH2 Lactylation via Regulating Metabolic Reprogramming

Han She et al. Adv Sci (Weinh). 2024 Dec.

Abstract

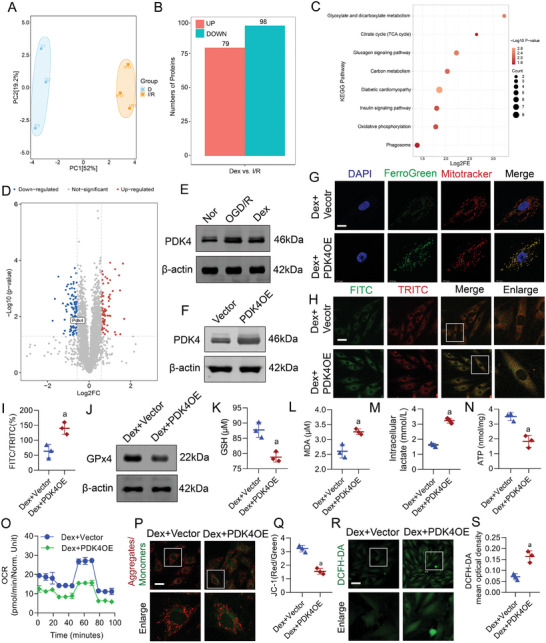
Myocardial ischemia-reperfusion injury (MIRI) significantly worsens the outcomes of patients with cardiovascular diseases. Dexmedetomidine (Dex) is recognized for its cardioprotective properties, but the related mechanisms, especially regarding metabolic reprogramming, have not been fully clarified. A total of 60 patients with heart valve disease are randomly assigned to Dex or control group. Blood samples are collected to analyze cardiac injury biomarkers and metabolomics. In vivo and vitro rat models of MIRI are utilized to assess the effects of Dex on cardiac function, lactate production, and mitochondrial function. It is found that postoperative CK-MB and cTNT levels are significantly lower in the Dex group. Metabolomics reveals that Dex regulates metabolic reprogramming and reduces lactate level. In Dex-treated rats, the myocardial infarction area is reduced, and myocardial contractility is improved. Dex inhibits glycolysis, reduces lactate, and improves mitochondrial function following MIRI. Lactylation proteomics identifies that Dex reduces the lactylation of Malate Dehydrogenase 2(MDH2), thus alleviating myocardial injury. Further studies reveal that MDH2 lactylation induces ferroptosis, leading to MIRI by impairing mitochondrial function. Mechanistic analyses reveal that Dex upregulates Nuclear Receptor Subfamily 3 Group C Member 1(NR3C1) phosphorylation, downregulates Pyruvate Dehydrogenase Kinase 4 (PDK4), and reduces lactate production and MDH2 lactylation. These findings provide new therapeutic targets and mechanisms for the treatment for MIRI.

Keywords: dexmedetomidine; ferroptosis; lactylation; metabolic reprogramming; myocardial ischemia‐reperfusion injury.


Conflict of interest statement

The authors declare no conflict of interest.

Figures

Figure 1
Figure 1
Dex regulated the lactate level of patients undergoing cardiopulmonary bypass surgery by metabolic reprogramming. A) Flowchart for collecting blood samples to measure cardiac injury biomarkers and metabolomics. B) Comparison of CK‐MB in the Con group and Dex group during the preoperative stage (pre) and the post‐operative stage (post) (n = 30 samples each group). C) Comparison of C‐TNT in the Con group and Dex group during the preoperative stage (pre) and the post‐operative stage (post) (n = 30 samples each group). D) Principal Component Analysis (PCA) of the difference in metabolic patterns between the Con‐pre and Con‐post groups. E) PCA of the difference in metabolic patterns between the Dex‐post and Con‐post groups. F,G) KEGG pathway enrichment analysis for differentially expressed (DE) metabolites. H,I) Volcano plot of DE‐metabolites, each dot represented a metabolite, blue indicated down‐regulated DE‐metabolites, red indicated up‐regulated, and gray indicated no significant difference. J,K) Box plots showing changes in levels of L‐lactic acid in different groups. L,M) Box plots showing changes in levels of D‐lactic acid in different groups. N,O) ROC curves evaluating the diagnostic capacity of L‐lactic acid and D‐lactic acid in different groups. a: p < 0.05, as compared with the Con‐pre group; b: p < 0.05, as compared with the Dex‐pre group; c: p < 0.05, as compared with the Con‐post group. Con‐pre: Con‐pre group; Con‐post: Con‐post group; Dex‐pre: Dex‐pre group; Dex‐post: Dex‐post group.
Figure 2
Figure 2
Dex enhanced mitochondrial function and mitigated MIRI by reducing lactate level. A,B) Evans Blue‐TTC staining was used to detect the impact of I/R and Dex on the myocardial infarction area in rats (n = 6 rats each group). The left ventricular area (LV), area at risk (AAR), and infarct area (IA) were calculated. AAR/LV (%) indicated ischemic region size, while IA/AAR (%) indicated infarcted region size. C) Cardiomyocyte contraction curves were used to reflect the impact of Dex on myocardial contractility in rats (n = 6 rats each group). D,E) Echocardiography was used to detect rats LVEF (n = 6 rats each group). F) ECAR was used to reflect the glycolysis rate (n = 3 independent experiments). G) Seahorse was used to detect mitochondrial OCR (n = 3 independent experiments). H) Lactate levels were measured in rats (n = 6 rats each group) and cells (n = 3 independent experiments). I) Transmission electron microscopy was used to observe the structure of myocardial mitochondria (bar = 1µm) (n = 6 rats each group). J) Confocal microscopy was used to observe mitochondrial morphology of H9c2 cells (each group randomly selected 30 cells and the mitochondrial morphology was blindly scored and classified into two categories: Long (>6µm), Short (≤3µm) (bar = 15µm) (n = 3 independent experiments)). K,L) JC‐1 and DCFH‐DA were used to detect mitochondrial membrane potential (bar = 15µm) and ROS (bar = 50µm) respectively (n = 3 independent experiments). M) The effect of Dex on ATP levels in OGD/R‐treated cells (n = 3 independent experiments). N,O) Evans Blue‐TTC staining was used to detect the effect of exogenous lactate on myocardial infarction area (n = 6 rats each group). The effect of exogenous lactate on P) cardiomyocytes contractility and Q,R) LVEF (n = 6 rats each group). S,T) The effect of exogenous lactate on mitochondrial morphology (bar = 15µm) (n = 3 independent experiments). U,V) The effect of exogenous lactate on ROS (bar = 50µm) and mitochondrial membrane potential of H9c2 cells (bar = 15µm) (n = 3 independent experiments). The effect of exogenous lactate on W) mitochondrial OCR and X) ATP levels (n = 3 independent experiments) of H9c2 cells. a: p < 0.05, as compared with the Con or Nor group; b: p < 0.05, as compared with the I/R or OGD/R group; c: p < 0.05, as compared with the Dex group. Con: control group; Nor: normal group; I/R: I/R group; OGD/R: OGD/R group; Dex: Dex‐treated I/R or OGD/R group; Dex + Lac: Dex + Lac treated I/R or OGD/R group.
Figure 3
Figure 3
Lactylation proteomics indicated that Dex reduced the lactylation of MDH2. A) Workflow of the strategy for lactylation proteomics analysis. B) Statistical distribution of lactylation sites. C) Icelogo representation displaying flanking sequence preferences for all Kla sites. D) Scatterplot illustrating the quantification of Kla sites in relation to peptide intensities. E) Pathway enrichment analysis via GSEA. F) Protein‐protein interaction network of Kla proteins (Top10) based on the STRING database. G) Crystal structure of MDH2. H) Relative expression of MDH2 K241 lactylation between the Dex and I/R groups. I) MS spectrum of the Kla 241 site. J) Evolutionary conservation of MDH2 K241 site. The sequences of MDH2 in 8 species were aligned with K241 highlighted in red. Dex: Dex group; I/R: I/R group.
Figure 4
Figure 4
Dex reduced myocardial I/R injury by enhancing mitochondrial function via downregulating MDH2 K241 lactylation. A) The effect of Dex on the myocardial lactylation level in I/R rats was detected by WB (n = 3 independent experiments). B) The lactylation level of MDH2 was detected by immunoprecipitation (n = 3 independent experiments). C,D) Echocardiography was used to detect the impact of the MDH2 lactylation regulation on the LVEF in rats (n = 6 rats each group). E) Cardiomyocyte contraction curves was used to reflect the impact of the MDH2 lactylation regulation on the myocardial contractility in rats (n = 6 rats each group). F–H) Evans blue‐TTC staining was used to detect the impact of the MDH2 lactylation regulation on the myocardial infarction area in rats (n = 6 rats each group). I,J) Changes in mitochondrial morphology in cells with the MDH2 K241 mutation were observed, 30 cells were randomly selected in each group and the mitochondrial morphology was blindly scored and classified into two categories: Long (>6µm) and Short (≤3µm) (bar = 10µm) (n = 3 independent experiments). K,L) Changes in mitochondrial membrane potential in cells with the MDH2 K241 mutation were observed, with membrane potential levels reflected by calculating the red/green fluorescence intensity via ImageJ (bar = 40µm) (n = 3 independent experiments). M,N) Changes in ROS levels in cells with the MDH2 K241 mutation were observed, with ROS levels reflected by calculating the green fluorescence intensity (bar = 150µm) (n = 3 independent experiments). O) Changes in mitochondrial OCR and P) ATP levels in cells with the MDH2 K241 mutation were observed (n = 3 independent experiments). Q) Effects of MDH2 K241T on mitochondrial OCR and R) ATP levels in Dex‐treated OGD/R cells were observed (n = 3 independent experiments). a: p < 0.05, as compared with the Con + MDH2WT or Nor + MDH2WT group; b: p < 0.05, as compared with the I/R + MDH2WT or OGD/R + MDH2WT group. Con: control group; I/R: I/R group; Dex: Dex‐treated I/R group; Con + MDH2WT: Control + MDH2WT group; Con + MDH2K241T: Control + MDH2K241T group; I/R + MDH2WT: I/R + MDH2WT group; I/R + MDH2K241R: I/R + MDH2K241R group; Nor + MDH2WT: Normal + MDH2WT group; Nor + MDH2K241T: Normal + MDH2K241T group; OGD/R + MDH2WT: OGD/R + MDH2WT group; OGD/R + MDH2K241R: OGD/R + MDH2K241R group; Dex + MDH2WT: Dex + MDH2WT + OGD/R group: Dex + MDH2K241T: Dex + MDH2K241T + OGD/R group.
Figure 5
Figure 5
Dex enhanced mitochondrial function by modulating MDH2 K241 lactylation to prevent ferroptosis. A) The effect of different inhibitors on the viability of OGD/R‐treated cells was detected using a CCK8 assay (n = 3 independent experiments). B) The effect of OGD/R on oxylipin levels was detected using lipidomics analysis (n = 6 independent experiments). C) The effect of Dex on OGD/R‐treated cell viability was detected (n = 3 independent experiments). D) The effect of Dex on GSH levels in OGD/R‐treated cells was analyzed (n = 3 independent experiments). E) The effect of Dex on GPX4 and ACSL4 levels in OGD/R‐treated cells was detected using WB (n = 3 independent experiments). F) The effect of Dex on mitochondrial ferrous ion levels in OGD/R‐treated cells was measured (bar = 15µm) (n = 3 independent experiments). G) The effect of Dex on MDA levels in OGD/R‐treated cells was examined (n = 3 independent experiments). H) The effect of ferroptosis inducers Erastin and RSL3 on the viability of Dex‐treated H9c2 cells was detected by CCK8 (n = 3 independent experiments). I) The effect of MDH2 K241T mutation on the viability of Dex‐treated H9c2 cells was detected (n = 3 independent experiments). J) The effect of MDH2 K241T mutation on GSH levels in Dex‐treated H9c2 cells was analyzed (n = 3 independent experiments). K) The effect of MDH2 K241T mutation on MDA levels in Dex‐treated H9c2 cells was examined (n = 3 independent experiments). L) The effect of MDH2 K241T mutation on GPX4 levels in Dex‐treated H9c2 cells was detected by WB (n = 3 independent experiments). M) The effect of MDH2 K241T mutation on mitochondrial ferrous ion levels in Dex‐treated H9c2 cells was measured (bar = 15µm) (n = 3 independent experiments). a: p < 0.05, as compared with the Normal group; b: p < 0.05, as compared with the OGD/R group; c: p < 0.05, as compared with the Dex group; d: p < 0.05, as compared with the Dex + MDH2WT group. Nor: normal group; OGD/R: OGD/R group; Dex: Dex‐treated OGD/R group; Dex + Fer‐1: Dex + Fer‐1 + OGD/R group; Dex + Erastin: Dex + Erastin + OGD/R group; Dex + RSL3: Dex + RSL3 + OGD/R group; Dex + MDH2WT: Dex + MDH2WT + OGD/R group: Dex + MDH2K241T: Dex + MDH2K241T + OGD/R group.
Figure 6
Figure 6
Dex downregulated PDK4 to reduce lactate production and alleviate ferroptosis. A) PCA analysis of protein expression differences between the Dex group and the I/R group. B) Differential analysis of Dex vs. I/R showed 98 upregulated proteins and 79 downregulated proteins, with red indicating upregulation and blue indicating downregulation. C) Pathway enrichment analysis of differentially expressed (DE) proteins: circle size represents the number of enriched proteins, and deeper red indicates a more significant P‐value. D) Volcano plot of DE‐proteins (Dex vs I/R), with blue indicating downregulated proteins, red indicating upregulated proteins, and gray indicating not significant. E) Western blot analysis of the effect of Dex on PDK4 in H9c2 cells (n = 3 independent experiments). F) Western blot analysis of PDK4 overexpression (OE) efficiency (n = 3 independent experiments). G) PDK4 OE increased mitochondrial ferrous ion levels in H9c2 cells (bar = 15µm) (n = 3 independent experiments). H) PDK4 OE increased lipid peroxidation in H9c2 cells (bar = 40µm) (n = 3 independent experiments). I) Lipid peroxidation statistical results, reflected by FITC/TRITC calculated with ImageJ (n = 3 independent experiments). J) Western blot analysis of the impact of PDK4 OE on GPX4 levels (n = 3 independent experiments). Impact of PDK4 OE on K) GSH, L) MDA, and M) intracellular lactate levels in H9c2 cells (n = 3 independent experiments). N) Impact of PDK4 OE on ATP levels in H9c2 cells (n = 3 independent experiments). O) Impact of PDK4 OE on OCR in H9c2 cells (n = 3 independent experiments). P,Q) Impact of PDK4 OE on mitochondrial membrane potential in H9c2 cells (bar = 40µm) (n = 3 independent experiments). R,S) Impact of PDK4 OE on ROS generation in H9c2 cells (bar = 60µm) (n = 3 independent experiments). a: p < 0.05, as compared with the Dex + Vector group. Nor: normal group; OGD/R: OGD/R group; Dex: Dex‐treated OGD/R group; Vector: Vector group; PDK4OE: PDK4OE group; Dex + Vector: Dex + Vector + OGD/R group; Dex + PDK4OE: Dex + PDK4OE + OGD/R group.
Figure 7
Figure 7
Dex enhanced NR3C1 phosphorylation leading to PDK4 downregulation. A) Venn analysis was used to screen for transcription factors regulated PDK4 that are affected by Dex. B) WB was used to detect the effects of OGD/R on the phosphorylation of NR3C1 and the expression of NR3C1, AR, and PGR (n = 3 independent experiments). C) WB was used to detect the effect of Dex on the phosphorylation of NR3C1 (n = 3 independent experiments). D) Molecular docking analysis of the binding of Dex to the phosphorylation site Ser226 of NR3C1. E) WB analysis of the effect of Dex on the distribution of NR3C1 in the cytoplasm and nucleus, with Histone H3 and GAPDH as internal references for nuclear and cytoplasmic proteins respectively (n = 3 independent experiments). F) The effect of NR3C1S226A mutation on the distribution of NR3C1 in the cytoplasm and nucleus (n = 3 independent experiments). G) Immunofluorescence analysis of the changes in colocalization of NR3C1 with the nucleus under different treatment conditions (bar = 5µm) (n = 3 independent experiments). H) WB was used to detect the effect of NR3C1S226A mutation on PDK4 expression (n = 3 independent experiments). I) Immunofluorescence was used to detect the effect of NR3C1S226A mutation on the level of mitochondrial iron ions in H9c2 cells (bar = 10µm) (n = 3 independent experiments). J,K) Effect of NR3C1S226A mutation on lipid peroxidation in H9c2 cells (bar = 50µm) (n = 3 independent experiments). L) WB was used to detect the effect of NR3C1S226A mutation on GPX4 expression (n = 3 independent experiments). Effect of NR3C1S226A mutation on M) MDA levels, N) GSH levels, and O) intracellular lactate levels in H9c2 cells (n = 3 independent experiments). P,Q) Evans blue‐TTC staining was used to detect the effect of NR3C1S226A mutation on myocardial I/R injury (n = 6 rats each group). a: p < 0.05, compared with the Dex + NR3C1WT group. Nor: normal group; OGD/R: OGD/R group; Dex: Dex‐treated OGD/R group; Dex + NR3C1WT: Dex + NR3C1WT + OGD/R (I/R) group; Dex + NR3C1S226A: Dex + NR3C1S226A + OGD/R (I/R) group.
Figure 8
Figure 8
Schematic diagram showing the mechanism by which Dex alleviates myocardial ischemia‐reperfusion injury. Dex lowers lactate level and downregulates MDH2 lactylation to improve mitochondrial function and inhibit ferroptosis, thereby alleviating MIRI. This process involves the promotion of the phosphorylation and nuclear export of NR3C1 by Dex, which suppresses PDK4 expression and regulates metabolic reprogramming.

Similar articles

Cited by

References

    1. Tsao C. W., Aday A. W., Almarzooq Z. I., Alonso A., Beaton A. Z., Bittencourt M. S., Boehme A. K., Buxton A. E., Carson A. P., Commodore‐Mensah Y., Elkind M. S. V., Evenson K. R., Eze‐Nliam C., Ferguson J. F., Generoso G., Ho J. E., Kalani R., Khan S. S., Kissela B. M., Knutson K. L., Levine D. A., Lewis T. T., Liu J., Loop M. S., Ma J., Mussolino M. E., Navaneethan S. D., Perak A. M., Poudel R., Rezk‐Hanna M., et al., Circulation 2022, 145, e153. - PubMed
    1. Bulluck H., Hausenloy D. J., Heart 2015, 101, 1067. - PubMed
    1. Wu T., Shi G., Ji Z., Wang S., Geng L., Guo Z., Cell. Mol. Biol. Lett. 2022, 27, 95. - PMC - PubMed
    1. Heusch G., Nat. Rev. Cardiol. 2020, 17, 773. - PubMed
    1. Del Re D. P., Amgalan D., Linkermann A., Liu Q., Kitsis R. N., Physiol. Rev. 2019, 99, 1765. - PMC - PubMed

LinkOut - more resources