. 2024 Oct;38(20):e70135.
doi: 10.1096/fj.202401160RR.

Retinal G-protein-coupled receptor deletion exacerbates AMD-like changes via the PINK1-parkin pathway under oxidative stress

Affiliations

Retinal G-protein-coupled receptor deletion exacerbates AMD-like changes via the PINK1-parkin pathway under oxidative stress

Yue Guo et al. FASEB J. 2024 Oct.

Abstract

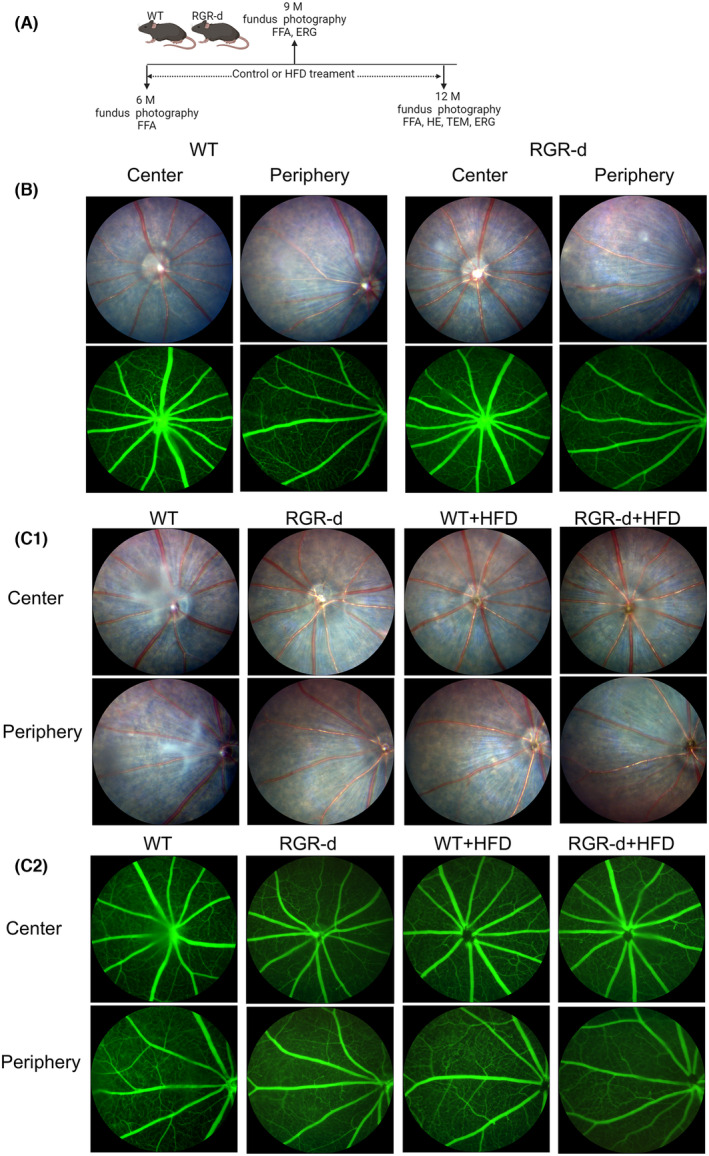
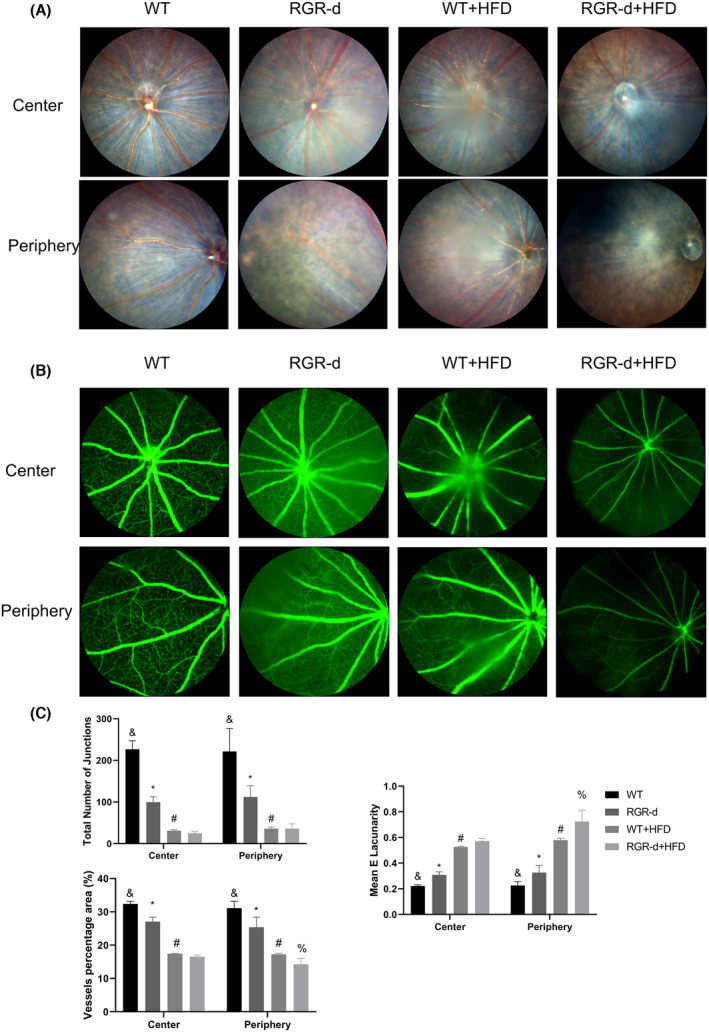
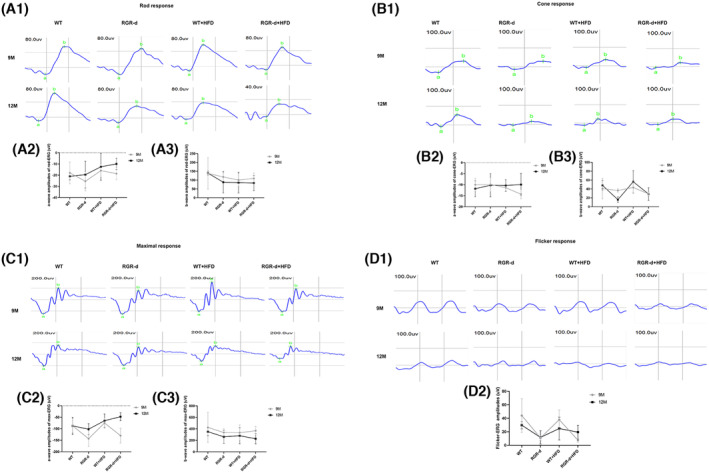
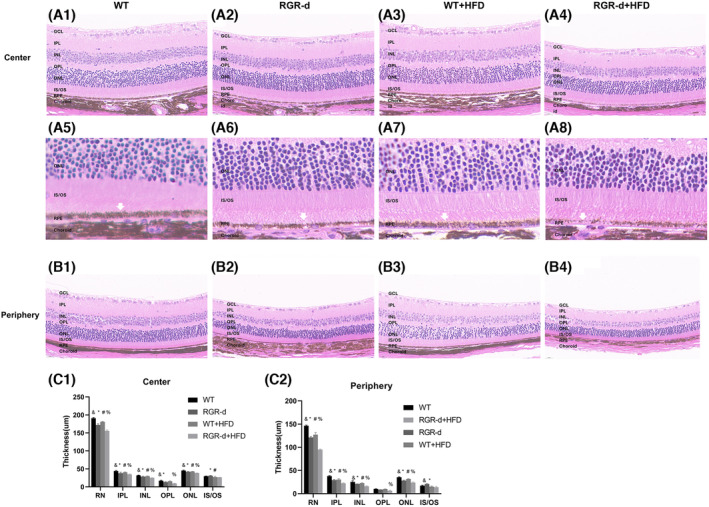
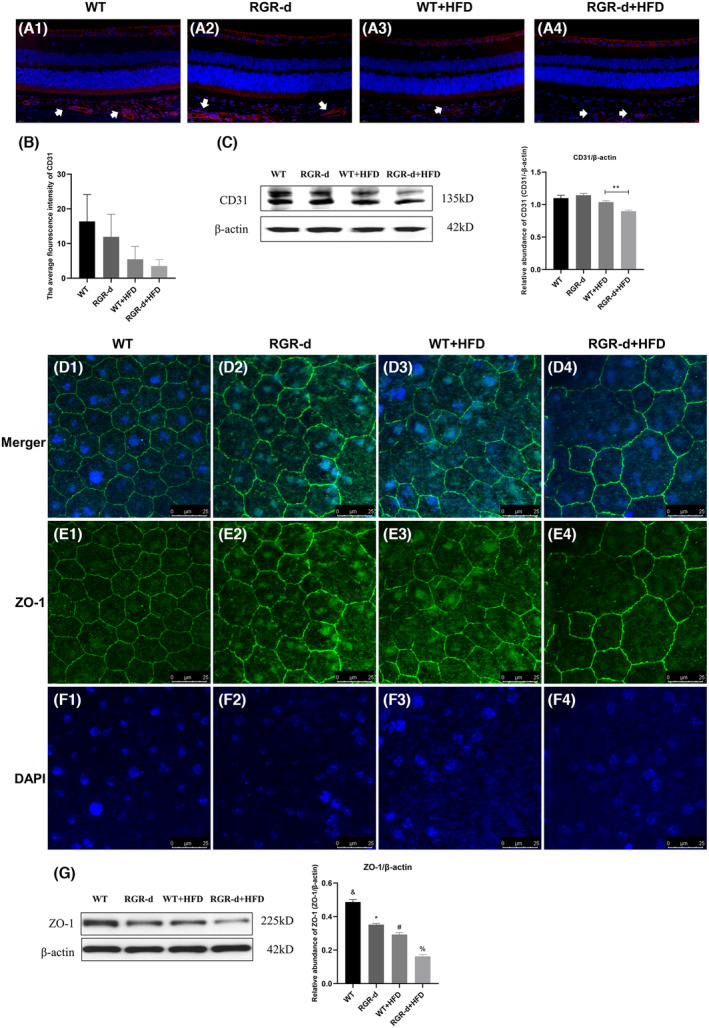
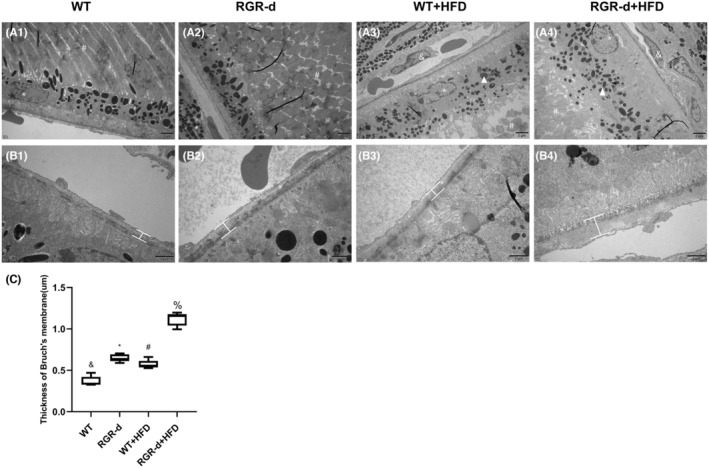
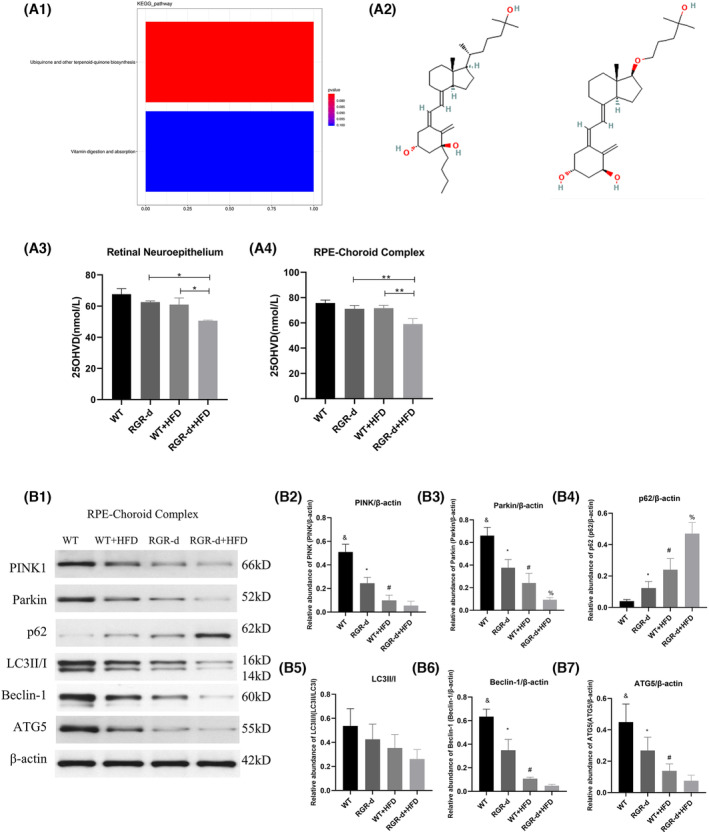
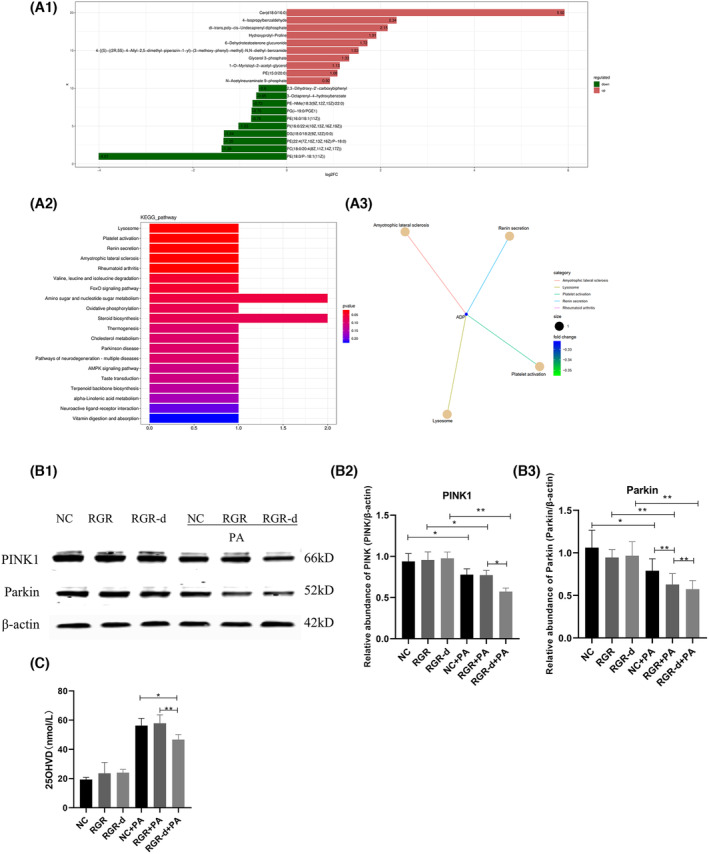
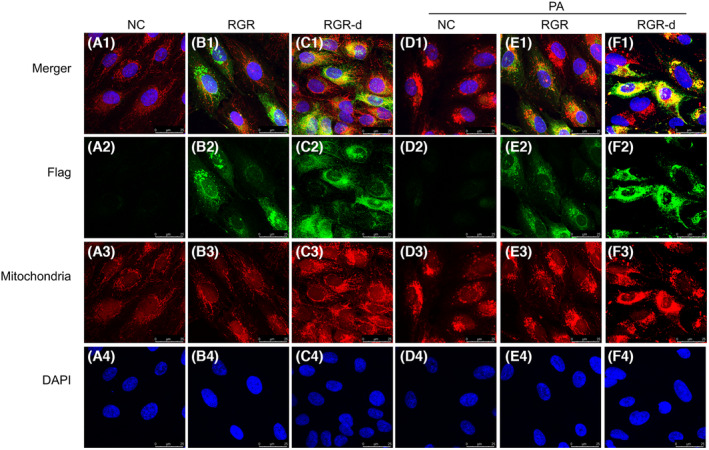
The intake of high dietary fat has been correlated with the progression of age-related macular degeneration (AMD), affecting the function of the retinal pigment epithelium through oxidative stress. A high-fat diet (HFD) can lead to lipid metabolism disorders, excessive production of circulating free fatty acids, and systemic inflammation by aggravating the degree of oxidative stress. Deletion of the retinal G-protein-coupled receptor (RGR-d) has been identified in drusen. In this study, we investigated how the RGR-d exacerbates AMD-like changes under oxidative stress, both in vivo and in vitro. Fundus atrophy became evident, at 12 months old, particularly in the RGR-d + HFD group, and fluorescence angiography revealed narrower retinal vessels and a reduced perfusion area in the peripheral retina. Although rod electroretinography revealed decreasing trends in the a- and b-wave amplitudes in the RGR-d + HFD group at 12 months, the changes were not statistically significant. Mice in the RGR-d + HFD group showed a significantly thinner and more fragile retinal morphology than those in the WT + HFD group, with disordered and discontinuous pigment distribution in the RGR-d + HFD mice. Transmission electron microscopy revealed a thickened Bruch's membrane along the choriocapillaris endothelial cell wall in the RGR-d + HFD mice, and the outer nuclear layer structure appeared disorganized, with reduced nuclear density. Kyoto Encyclopedia of Genes and Genomes pathway analysis indicated significantly lower levels of 25(OH)-vitamin D3 metabolites in the RGR-d + HFD group. Under oxidative stress, RGR-d localized to the mitochondria and reduced the levels of the PINK1-parkin pathway. RGR-d mice fed an HFD were used as a new animal model of dry AMD. Under high-fat-induced oxidative stress, RGR-d accumulated in the mitochondria, disrupting normal mitophagy and causing cellular damage, thus exacerbating AMD-like changes both in vivo and in vitro.

Keywords: AMD; RGR‐d; metabolomic; mitochondria; mitophagy.


Conflict of interest statement

The authors declare no conflicts of interest.

Figures

FIGURE 1
FIGURE 1
Summary of treatment and fundus examination in the animal groups. (A) Summary of the animal groups and treatment procedures. (B) Representative fundus imaging and fluorescein angiography of the central and peripheral regions in WT and RGR‐d mice at 6 months of age. (C) Representative fundus imaging (C1) and fluorescein angiography (C2) of the central and peripheral regions in the WT, RGR‐d, WT + HFD, and RGR‐d + HFD groups at 9 months of age.
FIGURE 2
FIGURE 2
Fundus examination in each group at 12 months of age. (A) Representative fundus imaging of the central and peripheral regions in the WT, RGR‐d, WT + HFD, and RGR‐d + HFD groups at 12 months of age. Fundus atrophy became evident in the RGR‐d + HFD group, particularly at the periphery. (B) Representative fluorescein angiography of the central and peripheral regions in the WT, RGR‐d, WT + HFD, and RGR‐d + HFD groups at 12 months of age. (C) AngioTool analysis of retinal vasculature in central and peripheral regions. & p < .05 for RGR‐d versus WT; *p < .05 for RGR‐d versus RGR‐d + HFD; # p < .05 for WT + HFD versus WT; % p < .05 for WT + HFD versus RGR‐d + HFD. n = 3 biological repeats in each group.
FIGURE 3
FIGURE 3
Retinal function assessment by full‐field ERG at 9 and 12 months of age. (A1–D1) Representative images of rod‐ERG, cone‐ERG, max‐ERG, and flicker‐ERG in each group at 9 and 12 months of age. (A2–C2) Statistical analysis of a‐wave amplitudes on rod ERG, cone ERG, and max ERG. (A3–C3) Statistical analysis of b‐wave amplitudes on rod ERG, cone ERG, and max ERG. (D2) Statistical analysis of the flicker ERG amplitudes. Data are means ± SD, n = 6 biological repeats in each group.
FIGURE 4
FIGURE 4
Characterization of the H&E staining. (A, B) H&E staining to visualize the progression of retinal degeneration in the retinal center (A1–A4) and periphery (B1–B4) at 12 months. The RGR‐d + HFD group showed significant thinning of the retinal structure, particularly in the IPL, INL, OPL, and ONL, compared with the WT + HFD group. (A5–A8) Partial enlarged detail of the retina in each group. White arrow: RPE layer. (C) Analysis of the thickness of each retinal layer in each group. GCL, Ganglion cell layer; INL, inner nuclear layer; IPL, inner plexiform layer; IS/OS, inner and outer segment; ONL, outer nuclear layer; OPL, outer plexiform layer. & p < .05 for RGR‐d versus WT; *p < .05 for RGR‐d versus RGR‐d + HFD; # p < .05 for WT + HFD versus WT; % p < .05 for WT + HFD versus RGR‐d + HFD.
FIGURE 5
FIGURE 5
Detection of CD31 and ZO‐1. (A–C) Detection of CD31 protein in each group at 12 months of age. (A1–A4) Representative retinal sections from each group stained for CD31. Red: CD31; blue: 4′,6‐diamidino‐2‐phenylindole (DAPI); white arrow: Choroidal vessels. (B) Statistical analysis of the average fluorescence intensity of CD31 in each group. The intensity was reduced in the RGR‐d + HFD group, but not statistically significantly. (C) Western blotting analysis of CD31 protein levels in the RPE–Bruch's membrane–choriocapillaris complex in each group; **p < .01. (D–G) Immunofluorescent staining of ZO‐1 on RPE flat mounts from each group. ZO‐1 hexagonal grids were well organized in the RPE–choroid flat mounts of the WT mice (D1–F1). In those from the RGR‐d (D2–F2) and WT + HFD mice (D3–F3), they were mildly disordered, whereas irregular disorganization was observed in the RGR‐d + HFD mice (D4–F4). Green: ZO‐1; blue: DAPI. (G) Western blotting analysis of ZO‐1 protein levels in the RPE–Bruch's membrane–choriocapillaris complex in each group. & p < .05 for RGR‐d versus WT; *p < .05 for RGR‐d versus RGR‐d + HFD; # p < .05 for WT + HFD versus WT; % p < .05 for WT + HFD versus RGR‐d + HFD.
FIGURE 6
FIGURE 6
Characterization of the TME in each group at 12 months of age. (A) Ultrastructural changes in the RPE–Bruch's membrane–choriocapillaris complex in each group of mice at 12 months of age. A reduction in the number of pigment particles and abnormal morphology (white arrowheads) were observed in the WT + HFD (A3) and RGR‐d + HFD (A4) groups. *Nuclei of RPE cells; #Photoreceptor outer segment; &Choroidal capillary cells. (B) Amplified Bruch's membrane in each group. Thickening of Bruch's membrane was identified along the choriocapillaris endothelial cell wall in the RGR‐d + HFD mice (B4). (C) Statistical analysis of the average thickness of Bruch's membrane in each group. & p < .05 for RGR‐d versus WT; *p < .05 for RGR‐d versus RGR‐d + HFD; # p < .05 for WT + HFD versus WT; % p < .05 for WT + HFD versus RGR‐d + HFD.
FIGURE 7
FIGURE 7
Nontargeted lipidomics revealed differential metabolites in the RGR‐d + HFD mice and WB investigated the activation of the PINK1–parkin signaling pathway. (A1) Bar plot shows the two principal pathways that differed between the WT + HFD group and RGR‐d + HFD group in a nontargeted lipidomic analysis of the RPE‐choroid complex, based on a KEGG pathway analysis. The x‐axis shows the names of the subpathways, and the y‐axis indicates the number of metabolites. (A2) Chemical structures of vitamin D3 metabolites: 1β‐butyl‐1α,25‐dihydroxyvitamin D3 (pos_5249) and 1α,25‐dihydroxy‐21‐nor‐20‐oxavitamin D3 (pos_11614). (A3–A4) Levels of 25(OH)‐vitamin D3 in the retinal neuroepithelium (A3), RPE‐Bruch's membrane‐choriocapillaris complex (A4). *p < .05, **p < .01. (B) Protein levels of PINK1 and parkin in the RPE‐choroid complex of each group of mice at 12 months of age. (B1) Representative western blots of PINK1, parkin, P62, LC3II/I, beclin 1, and ATG5. (B2–B7) Western blotting analyses of PINK1, parkin, P62, LC3II/I, beclin 1, and ATG5. & p < .05 for WT versus RGR‐d; *p < .05 for RGR‐d versus RGR‐d + HFD; # p < .05 for WT + HFD versus WT; % p < .05 for WT + HFD versus RGR‐d + HFD. n = 3 biological repeats in each group.
FIGURE 8
FIGURE 8
Nontargeted metabolomic analyses in the RGR‐d‐overexpressing cells stimulated with PA and the WB of the PINK1–parkin signaling pathway in cells. (A1) Summary of the top 20 metabolites altered in cells overexpressing RGR‐d protein compared with cells overexpressing RGR protein under PA stimulation. Labels on each column are the names of metabolites, distinguished by upregulation or downregulation. Upregulated metabolites are shown in red and downregulated metabolites in green. Length of the columns indicates log (fold change) (logFC). The top 10 upregulated and top 10 downregulated metabolites with the highest FC are shown. (A2) Bar plot shows the top 20 pathways that differed between the RGR‐d cells and RGR cells under PA stimulation, based on a KEGG pathway analysis. (A3) KEGG enrichment network diagram of differential metabolites. Pale yellow nodes in the graph represent pathways, and small nodes connected to them are specific metabolites annotated to that pathway. The size of the node indicates the number of differential metabolites annotated to that pathway, and the color depth represents the log2‐transformed FC values. (B) Protein levels of PINK1 and parkin in cells with or without PA stimulation. *p < .05, **p < .01. (C) The level of vitamin D in cells. *p < .05, **p < .01. n = 3 biological repeats in each group.
FIGURE 9
FIGURE 9
Immunofluorescent double‐labeling of Flag and mitochondria in ARPE‐19 cells of each group after treatment with or without PA. Flag (green) immunofluorescence was detected outside the mitochondria (red) in the RGR group. However, the Flag signal (green) was dispersed and localized in the mitochondria (red) in the RGR‐d group. Nuclei were labeled with 4‐,6‐diamidino‐2‐phenylindole (DAPI) (blue). n = 3 biological repeats in each group.

Similar articles

Cited by

References

    1. Guymer RH, Campbell TG. Age‐related macular degeneration. Lancet. 2023;401(10386):1459‐1472. - PubMed
    1. Datta S, Cano M, Ebrahimi K, Wang L, Handa JT. The impact of oxidative stress and inflammation on RPE degeneration in non‐neovascular AMD. Prog Retin Eye Res. 2017;60:201‐218. - PMC - PubMed
    1. Sparrow JR, Boulton M. RPE lipofuscin and its role in retinal pathobiology. Exp Eye Res. 2005;80(5):595‐606. - PubMed
    1. Khan KN, Mahroo OA, Khan RS, et al. Differentiating drusen: drusen and drusen‐like appearances associated with ageing, age‐related macular degeneration, inherited eye disease and other pathological processes. Prog Retin Eye Res. 2016;53:70‐106. - PubMed
    1. Toomey CB, Johnson LV, Bowes RC. Complement factor H in AMD: bridging genetic associations and pathobiology. Prog Retin Eye Res. 2018;62:38‐57. - PMC - PubMed

MeSH terms

LinkOut - more resources