. 2024 Dec;11(47):e2309631.
doi: 10.1002/advs.202309631. Epub 2024 Oct 28.

Deciphering the Multifaceted Immune Landscape of Unresectable Primary Liver Cancer to Predict Immunotherapy Response

Affiliations

Deciphering the Multifaceted Immune Landscape of Unresectable Primary Liver Cancer to Predict Immunotherapy Response

Jun Xue et al. Adv Sci (Weinh). 2024 Dec.

Abstract

Immunotherapies employing PD-1/PD-L1 immune checkpoint inhibitors (ICIs) are vital for primary liver cancer (PLC), but response rates remain unsatisfying. Accurate differentiation of responders from non-responders to immunotherapy is imperative. Here, single-cell-scaled mass cytometry analysis on sequential peripheral blood mononuclear cells (PBMCs) from ICI-treated PLC patients is conducted, and tissue residence of immune subpopulations is assessed via multiplex immunohistochemistry. In the discovery cohort (n = 24), responders have lower baseline B cell and HLA-DR+CD8+T cell, and higher CD14+CD16- classical monocyte (CM) proportions. CMs decrease more in responders PBMCs, while HLA-DR+CD8+T cells conformably amplify after ICI-exposure. Responsive individuals display upregulated exhaustion and activation markers in peripheral immune lineages. In the expanded cohort of 77 patients, the augment of the B cells in non-responders is re-confirmed. Responders demonstrate much higher enrichment of B cells or tertiary lymphoid structures in tumor compared to non-responders. A prospective model that excelled in early discrimination of responders is developed using generalized linear model and achieves a satisfactory AUC over 0.9 in all three independent cohorts. Integratedly, the study unveils dynamic immune landscapes in PLC patients undergoing ICI-based therapy, aiding in PLC patient stratification for ICI-based treatment and fostering new response monitoring strategies.

Keywords: efficacy prediction model; immune‐checkpoint inhibition‐based therapy; peripheral immune landscapes; primary liver cancer.


Conflict of interest statement

The authors declare no conflict of interest.

Figures
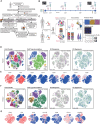
Figure 1
Figure 1
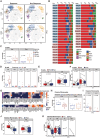
Patient characteristics, clinical information acquisition, and CyTOF analyses of comprehensive immunological features before and during ICI‐based treatment. A) Overview of subject enrollment, experimental design, clinical datasets, and analyses conducted in this study. Pts, abbreviation for patients. B) Schematic diagram illustrating the collection of samples. Immunotherapy using ICI‐based therapy is administered according to the indicated schedule (arrow). Time points for blood samples and radiographic data collection, as well as the CyTOF assays, are highlighted. C1D1, C2D1, C3D1, C4D1: First day of the initial, second, third and fourth treatment cycle, respectively. This panel was created using BioRender with an academic license. C) Graphical abstract presenting the workflow employed in its entirety. D) t‐SNE plots of Panel 1 displayed under different parameter settings. E) Representative examples of t‐SNE plots illustrating the normalized marker expression from all samples in Panel 1. F) t‐SNE plots of Panel 2 displayed under different parameter settings. G) Representative examples of t‐SNE plots depicting the normalized marker expression from all samples in Panel 2.
Figure 2
Figure 2
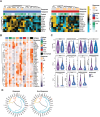
Baseline canonical immune features and their on‐therapy dynamics in PBMCs reflect the clinical response to ICI‐based therapy. A) t‐SNE plots of panel 1 (23 pre‐treatment samples and 17 post‐treatment samples) showed that 9 classic immune cell types were identified in total PBMCs via phenograph clustering method. B) Frequencies of classic immune subsets are depicted for each sample pre‐ and post‐treatment. The analysis comprised samples of 8 responders (Rs) and 15 non‐responders (NRs) in the pre‐treatment cohort and 9 Rs and 8 NRs in the post‐treatment cohort, respectively. C) Cell percentages of B cells are plotted and compared between Rs and NRs both pre‐treatment (left) and post‐treatment (right). D) Cell percentages of subclusters of B cells (C21, C24, C5, C7, and C9) are plotted and compared between Rs and NRs pre‐treatment. E,F) Dynamic changes in the percentage of B cells (E) and its subclusters (F) before (pre) and after (post) ICI‐based therapy are depicted in patient‐matched PBMCs from 8 Rs and 8 NRs. G) Heatmap displaying the mean expression level of all 32 markers in 7 subclusters of B cells and classical monocytes (CMs), respectively. H) Cell percentages of CMs are plotted and compared between Rs and NRs, pre‐and post‐treatment. I) Cell percentages of subclusters of CMs (C1 and C15) are plotted and compared between Rs and NRs pre‐treatment. J,K) Dynamic changes in the percentage of CMs (J) and its subclusters (K) before (pre) and after (post) ICI‐based therapy are depicted in patient‐matched PBMCs from 8 Rs and 8 NRs. The line and box represent the mean and upper and lower quartiles, respectively. Wilcoxon rank‐sum test and paired Wilcoxon signed rank test (for paired data) were used to identify significant differences.
Figure 3
Figure 3
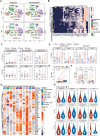
The majority of immune lineages in the ICI‐responsive group exhibit simultaneous high expression levels of cell adhesion, activation, and exhaustion molecules on their surface. A) Heatmap displaying the scaled normalized expression for 10 markers that showed the greatest differential expression between responders (Rs) and non‐responders (NRs) before (left panel) and 12 weeks after (right panel) initiation of therapy. Median expression was calculated on single, live CD45+ cells derived from thawed PBMC samples obtained from patients. Dendrograms for markers (rows) and samples (columns) were generated using hierarchical clustering with Euclidean distance. Bars at the top of the heatmap represent individual samples from Rs (orange) and NRs (grey). Each column represents a patient sample from a specific time point, with a total of 23 patients before treatment and 17 patients after treatment. B) Heatmaps illustrating the normalized median expression of the 32 markers from panel 1 in each patient's indicated immune cell subtypes before treatment. Expression was quantified using Salmon and represented as a fold change relative to the median value of gene expression for each patient. C) Violin plots illustrating the normalized median expression of the differentially expressed markers from panel 1 in each cell of the indicated immune cell subtypes. A comparison of the expression levels of several surface markers (HLA‐DR, PD‐L1, PD‐1, Siglec‐3) between the indicated cell types from the pre‐treatment R and NR groups was performed using a two‐sided Wilcoxon rank‐sum test. *p < 0.05, **p < 0.01, ***p < 0.001. D) Clustering tree for the relationships among all 32 surface markers in Rs and NRs before ICI‐based therapy.
Figure 4
Figure 4
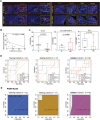
T cell clustering and subtype analysis reveal the diversities of HLA‐DR+CD8+ T subcluster between the responders and non‐responders. A) t‐SNE plots of panel 2 (23 pre‐treatment samples and 17 post‐treatment samples) show the identification of 6 T cell subpopulations and 5 non‐T cell subpopulations in total PBMCs using the phenograph clustering method. B) Heatmap displaying the mean expression level of all 34 markers in 25 clusters and 11 cell subpopulations. C) Cell percentages of the indicated cell subpopulations are plotted and compared between Rs and NRs both pre‐treatment and post‐treatment. D) Cell percentages of the subclusters of HLA‐DRCD8+ T cells (T20 and T21) and CD9+CD4+T cells (T3 and T9) are plotted and compared between Rs and NRs both pre‐treatment and post‐treatment. The line and box represent the mean and upper and lower quartiles, respectively. Wilcoxon rank‐sum test was used to identify significant differences. No significant differences were observed. E,F) Dynamic changes in the percentage of HLA‐DRCD8+ T cells (E) and their subclusters (F) before (pre) and after (post) ICI‐based therapy are depicted in patient‐matched PBMCs from all 16 PLC patients. Paired Wilcoxon signed rank test was used to identify significant differences. G) Heatmaps illustrating the normalized median expression of the 34 markers from panel 2 in each patient's indicated immune cell subtypes before treatment. Expression values were quantified using Salmon and represented as a fold change relative to the median value of gene expression for each patient. H) Violin plots illustrating the normalized median expression of the differentially expressed markers from panel 2 in each cell of the indicated immune cell subtypes. A comparison of the expression levels of several surface markers (CTLA‐4, PD‐1, CCR6, BTLA) between the indicated cell types from the pre‐treatment R and NR groups was performed using a two‐sided Wilcoxon rank‐sum test. *p < 0.05, **p < 0.01, ***p < 0.001.
Figure 5
Figure 5
Correlation between immune profile and clinical characteristics of ICI‐treated PLC patients. A) Pearson correlation analyses depicting the relationship between serum levels of clinical biomarkers and the frequencies of cell subpopulations from panel 1 (right) and panel 2 (left) in the discovery cohort. Distance measurement was performed using Euclidean distance. Statistical significance is indicated by asterisks (*p < 0.05, **p < 0.01, ***p < 0.001). B,C) Comparison of serum levels of clinical biomarkers between Rs and NRs pre‐treatment. B, the analysis included a total of 76 patients for whom blood routine and blood biochemistry were tested in the clinical laboratory. C, the analysis included a total of 68 patients for whom the classical immune lineages from PBMC samples were tested in the clinical laboratory. D) Kaplan–Meier survival analysis for OS and PFS of PLC patients with high or low B cells, median B‐cell percentage was defined as the cutoff value. The analysis comprised 64 patients who were included based on the availability of B‐cell percentage data from laboratory measurements and follow‐up survival data. E) Association between circulating platelet counts (left), proportion of B cells (middle), level of IL‐6 (right), and therapeutic response, respectively. Two‐tailed chi‐square test was used to determine the statistical significance between the groups. F) Association between circulating CRAFITY‐score (left), NLR (middle), levels of AFP (right), and therapeutic response, respectively. Sample size for each analysis was labelled on the histogram. ns, not significantly.
Figure 6
Figure 6
Prediction model PISIR for identifying promising responses in PLC patients based on the peripheral immune signature of PBMCs before ICI‐based therapy. Representative image of mIHC detection in PLC samples, illustrating HLA‐DR+CD8+ T cells, B cells (left panel) and tumor‐infiltrating lymphoid structures (TLS, right panel) from 18 patients with different responses to ICI‐based therapy in the corresponding FFPE tumor samples. B) Pearson correlation analyses between the blood and tumor in situ frequencies of B cells in the 18 patients from mIHC analysis. C) Comparison of the percentages of B cells and HLA‐DR+CD8+ T cells in CD45+ cells in situ, as well as the counts of TLS per square centimeter, between Rs (n = 7) and NRs (n = 11) pre‐treatment. The line and box represent the mean and upper and lower quartiles, respectively. D) Comparison of multiple ROC plots showcasing the performance of single clinical parameters and immune profiles in the training cohort (left), testing cohort (middle), and validation cohort 1(right). E) ROC plot depicting the performance of the PISIR model in the training cohort (left), testing cohort (middle), and validation cohort 1 (right).

References

    1. Yang J. D., Hainaut P., Gores G. J., Amadou A., Plymoth A., Roberts L. R., Nat. Rev. Gastroenterol. Hepatol. 2019, 16, 589. - PMC - PubMed
    1. Baretti M., Kim A. K., Anders R. A., Cancer Cell 2022, 40, 252. - PMC - PubMed
    1. Finn R. S., Ikeda M., Zhu A. X., Sung M. W., Baron A. D., Kudo M., Okusaka T., Kobayashi M., Kumada H., Kaneko S., Pracht M., Mamontov K., Meyer T., Kubota T., Dutcus C. E., Saito K., Siegel A. B., Dubrovsky L., Mody K., Llovet J. M., J. Clin. Oncol. 2020, 38, 2960. - PMC - PubMed
    1. Zhu A. X., Abbas A. R., de Galarreta M. R., Guan Y., Lu S., Koeppen H., Zhang W., Hsu C. H., He A. R., Ryoo B. Y., Yau T., Kaseb A. O., Burgoyne A. M., Dayyani F., Spahn J., Verret W., Finn R. S., Toh H. C., Lujambio A., Wang Y., Nat. Med. 2022, 28, 1599. - PubMed
    1. Oh D.‐Y., He A. R., Qin S., Chen L.‐T., Okusaka T., Vogel A., Kim J. W., Suksombooncharoen T., Lee M. A., Kitano M., Burris Iii H. A., Bouattour M., Tanasanvimon S., Zaucha R., Avallone A., Cundom J., Rokutanda N., Xiong J., Cohen G., Valle J. W., J. Clin. Oncol. 2022, 40, 378.

Substances

LinkOut - more resources