. 2024 Dec;636(8043):705-710.
doi: 10.1038/s41586-024-08246-7. Epub 2024 Oct 28.

Transmission of a human isolate of clade 2.3.4.4b A(H5N1) virus in ferrets

Affiliations

Transmission of a human isolate of clade 2.3.4.4b A(H5N1) virus in ferrets

Joanna A Pulit-Penaloza et al. Nature. 2024 Dec.

Abstract

Since 2020, there has been unprecedented global spread of highly pathogenic avian influenza A(H5N1) in wild bird populations with spillover into a variety of mammalian species and sporadically humans1. In March 2024, clade 2.3.4.4b A(H5N1) virus was first detected in dairy cattle in the USA, with subsequent detection in numerous states2, leading to more than a dozen confirmed human cases3,4. In this study, we used the ferret, a well-characterized animal model that permits concurrent investigation of viral pathogenicity and transmissibility5, in the evaluation of A/Texas/37/2024 (TX/37) A(H5N1) virus isolated from a dairy farm worker in Texas6. Here we show that the virus has a remarkable ability for robust systemic infection in ferrets, leading to high levels of virus shedding and spread to naive contacts. Ferrets inoculated with TX/37 rapidly exhibited a severe and fatal infection, characterized by viraemia and extrapulmonary spread. The virus efficiently transmitted in a direct contact setting and was capable of indirect transmission through fomites. Airborne transmission was corroborated by the detection of infectious virus shed into the air by infected animals, albeit at lower levels compared to those of the highly transmissible human seasonal and swine-origin H1 subtype strains. Our results show that despite maintaining an avian-like receptor-binding specificity, TX/37 exhibits heightened virulence, transmissibility and airborne shedding relative to other clade 2.3.4.4b virus isolated before the 2024 cattle outbreaks7, underscoring the need for continued public health vigilance.


Conflict of interest statement

Competing interests: The authors declare no competing interests.

Figures

Extended Data Fig. 1 |
Extended Data Fig. 1 |. Comparison of receptor binding site residues in diverse H5 HAs.
(A) Sequence residues that comprise the TX/37 HA receptor binding site (RBS) aligned with HA sequences from this and a previous study, as well as with a recent bovine A(H5N1) virus sequence that reported both human and avian receptor binding. Alignments with amino acid positions (H3 and H5 numbering) are indicated above the alignment. Conserved residues are indicated as dots. The position of the RBS on the HA is illustrated on the TX/37 structural model. The HA is illustrated as a cartoon, while the receptor binding site residues listed in the alignment are shown as a surface representation. Figure was generated using PyMol 2.5.5. *Current data. HAs with published glycan array binding results. #Isolates associated with dairy farm outbreaks including dairy cow isolate consensus sequence. (B) Full alignment of the HA for all viruses associated with dairy farm outbreaks included in A.
Extended Data Fig. 2 |
Extended Data Fig. 2 |. Glycan microarray analysis of the TX/37 recHA.
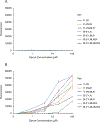
A second glycan array containing only a limited set of linear and biantennary (A) α2–6 and (B) α2–3 linked sialosides of different lengths (from 1 to 4 LacNAc repeats), printed onto the array at different concentrations, were used to assess both HA binding specificity and avidity of the TX/37 recHA. Error bars are standard deviations from six independent replicates on the array. Each of the glycans’ structures are listed in Supplemental Table 2.
Extended Data Fig. 3 |
Extended Data Fig. 3 |. Changes in body weight, temperature, and lethargy in ferrets inoculated intranasally with 6 log10[PFUs] of TX/37.
(A) Percent weight loss from pre-inoculation baseline body weight. (B) Body temperature change from pre-inoculation baseline temperature. Time courses for individual ferrets are shown up to the day of euthanasia (days 2–3), n = 12. (C) Lethargy was evaluated based on a scoring system of 0 to 3.
Extended Data Fig. 4 |
Extended Data Fig. 4 |. Viral titers in rectal swabs collected from inoculated and contact ferrets.
Twelve ferrets were inoculated intranasally with 6 log10 [PFUs] of TX/37 virus. Transmission to naive contacts in (A) direct contact transmission (DC), (B) fomite transmission (FC), and (C) respiratory droplet transmission (RD) settings were established, and rectal swabs were collected every other day post-inoculation or contact, or on the day of euthanasia (day 2 or day 4 indicated on top of the bar). Rectal swab titers for the inoculated animals are shown on the left side of each graph, and rectal swab titers for contact animals are shown on the right side of each graph. Red asterisks denote animals that succumbed to infection prior to sample collection. The limit of detection is 10 PFU/ml, dashed line. Each bar represents an individual ferret.
Extended Data Fig. 5 |
Extended Data Fig. 5 |. Viral titers in conjunctival wash samples from ferrets inoculated with 6 log10 [PFUs] of TX/37 A(H5N1) virus.
Conjunctival washes collected from inoculated ferrets (n = 6). The samples were titered in MDCK cells. The limit of detection is 10 PFU/ml, dashed line. Each symbol represents an individual ferret.
Extended Data Fig. 6 |
Extended Data Fig. 6 |. Transmission of H1 subtype viruses in the ferret fomite model.
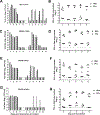
Three ferrets per group were inoculated with 6 log10 [PFUs] of (A, B) human seasonal NE/14 A(H1N1), (C, D) swine-origin MN/45 A(H1N2)v, (E, F) swine-origin OH/09 A(H1N1)v, (G, H) or swine-origin OH/02 A(H1N1)v viruses. The transmission experiment was conducted for 5 days (5 cage swaps). (A, C, E, G). Titers in nasal washes collected from inoculated animals (left graph side), and contact (right graph side) are expressed as log10 [PFU/ml]. The limit of detection is 10 PFU (dashed line). (B, D, F, H) Each cage was swabbed prior to cage swap. Infectious virus titers and RNA copy number titers in cage swabs are expressed as log10 [PFU or RNA/swab]. Limit of detection is 1 PFU (dashed line), and 2.9 log10 [RNA copies]. Each bar and symbol represent an individual ferret.
Extended Data Fig. 7 |
Extended Data Fig. 7 |. Detection of infectious TX/37 A(H5N1) on fomites.
(A) Experimental design (n = 3). A ferret inoculated with 6 log10 of TX/37 A(H5N1) was placed in cage 1 (grey), and a naive ferret was placed in cage 2 (blue). Twenty-four hours post inoculation a cage swab was collected from the cage housing each of the inoculated ferrets (cage 1). An air sample was collected (1 h using BC 251 samplers) from each cage housing the naive ferret [cage 2, air sample 1 (AS1)]. Following cage swap, air sample was collected from cage 1 which now housed the respective contact ferret [air sample 2 (AS2)]. The process was repeated the next day [cage swab 2, air sample 3 (AS3), and air sample 4 (AS4)]. (B) Infectious virus titers and RNA copy number titers in cage swabs are expressed as log10 [PFU or RNA copies/swab]. Limit of detection is 1 PFU, and 2.9 log10 [RNA copies]. (C) Infectious virus titers in air samples are expressed as log10 [PFU/hour] (red symbols; limit of detection 1 PFU/hour; the data represents infectious virus recovered in the >4 μm fraction of the BC 251 sampler, no infectious virus was recovered from the fractions containing particles of 1–4 μm, or <1 μm). Viral RNA copy titers in air samples are expressed as log10 RNA copies/ hour (bars; limit of detection 2.5 log10 RNA copies/hour; data represents the sum from the three sampler fractions). Each ferret is represented by a different symbol and the order of ferrets corresponds to the order of ferrets in Figure 2b.
Extended Data Fig. 8 |
Extended Data Fig. 8 |. Tissue distribution of TX/37 H5N1 in infected contact ferrets.
Virus dissemination to tissues collected from contacts in the (A) direct contact (DC) and fomite (FC), and (B) respiratory droplet transmission (RDC) set-ups. Viral titers were obtained using standard plaque assay and are reported at log10 [PFU/ml] [blood, soft palate (soft pal), nasal turbinates (nasal tur), ethmoid turbinates (ethmoid tur), eye, conjunctiva(conj)] or log10 [PFU/gram of tissue] [kidney, spleen, liver, intestines, olfactory bulb (olfact bulb), brain, lungs, trachea]. The red asterisk indicate a sample that was not collected. Days post contact on which the samples were collected are shown in parentheses. The limit of detection is 10 PFU/ml or g, dashed line. Colors correspond to the contact ferrets in Figure 2a–c. Each bar represents an individual ferret.
Fig. 1 |
Fig. 1 |. Glycan microarray analyses of recent clade 2.3.4.4b H5 recombinant HAs.
a–e, Glycan microarray results for HA of clade 2.3.4.4b TX/37 A(H5N1) (a), clade 2.3.4.4b A/Sichuan/06681/2021 A(H5N1) (b), clade 2.3.4.4b A/Astrakhan/3212/2020 A(H5N1) (c), clade 1 A/Vietnam/1203/2004 A(H5N1) (d) and seasonal A/Switzerland/9715293/2013 A(H3N2) (e). Coloured bars distinguish different glycan structures represented on the array. Error bars are standard deviations from six independent replicates on the array. RFU, relative fluorescent units. Each of the numbered glycans’ structures is listed in Supplementary Table 1.
Fig. 2 |
Fig. 2 |. Transmission and pathogenesis of TX/37 A(H5N1) in the ferret model.
Ferrets were inoculated with 6 log10[PFUs] of TX/37. Contact was established 24 h after inoculation of the donor ferrets, resulting in 30–48 h of total contact time (until euthanasia of the inoculated ferrets on day 2–3 p.i.). ac, Transmission settings: direct contact (one inoculated and one naive ferret co-housed in one cage; three pairs; a), indirect (fomite) contact (one inoculated and one naive ferret housed in alternating cages; cage swaps performed once daily; three pairs; b) and respiratory droplet contact (one inoculated and one naive ferret housed in adjacent cages; six pairs; c). Transmission to naive contacts was evaluated by the detection of virus in NWs. Samples were collected every other day post inoculation or contact, or on the day of euthanasia (day 2 or day 4 indicated on top of the bar). Bars with no colour denote animals that succumbed to infection before sample collection. d, Virus dissemination in tissues was evaluated in samples from four inoculated animals (I1–4) on day 3 p.i. Viral titres are reported at log10[PFUs ml−1] (blood, soft palate, nasal turbinates, ethmoid turbinates, eye, conjunctiva) or log10[PFUs g−1] (of tissue; kidney, spleen, liver, intestines, olfactory bulb, brain, lung, trachea). The limit of detection is 10 PFUs ml−1 or g−1; dashed line. Each bar represents an individual ferret.
Fig. 3 |
Fig. 3 |. Detection of airborne influenza virus released from inoculated ferrets.
ad, Ferrets were inoculated intranasally with 6 log10[PFUs] of clade 2.3.4.4b TX/37 A(H5N1) (a), clade 2.3.4.4b Chile/25945 A(H5N1) (b), human seasonal A/Nebraska/14/2019 A(H1N1) (c) and swine-origin A/Minnesota/45/2016 A(H1N2)v (d). Virus titres in NW samples collected from individual inoculated ferrets are shown on the left side of each graph. Virus titres in NWs were evaluated using standard plaque assay to determine infectious virus load (pink circles; limit of detection 10 PFUs ml−1) and real-time quantitative PCR with reverse transcription to determine viral RNA load (black circles; limit of detection 2.9 log10[RNA copies ml−1]). Aerosol samples were collected from each inoculated animal (n = 3–5 per virus) daily for 3 days p.i. (or until euthanasia; day 2 (d2) for TX/37) for 1 h using a BC 251 sampler (3.5 l min−1) and a SPOT sampler (1.5 l min−1), sequentially. Infectious virus was analysed by plaque assay (limit of detection 1 PFU h−1, dashed pink line with negative samples shown below the line; the BC 251 data represent infectious virus recovered in the >4-μm sampler fraction, no infectious virus was recovered from the fractions containing aerosol particles of 1–4 μm, or <1 μm) and viral RNA in each sample was quantified using real-time quantitative PCR with reverse transcription (limit of detection 2.5 log10[RNA copies h−1], dashed black line with negative samples shown below the line; the BC 251 data represent the sum from all three sampler fractions). Statistical analysis is reported in Supplementary Table 4.

References

    1. Gilbertson B & Subbarao K Mammalian infections with highly pathogenic avian influenza viruses renew concerns of pandemic potential. J. Exp. Med. 220, e20230447 (2023). - PMC - PubMed
    1. Nguyen T-Q et al. Emergence and interstate spread of highly pathogenic avian influenza A(H5N1) in dairy cattle. Preprint at bioRxiv 10.1101/2024.05.01.591751 (2024). - DOI
    1. Garg S et al. Outbreak of highly pathogenic avian influenza A(H5N1) viruses in U.S. dairy cattle and detection of two human cases - United States, 2024. MMWR Morb. Mortal. Wkly Rep. 73, 501–505 (2024). - PMC - PubMed
    1. Avian Influenza (Bird Flu) (Centers for Disease Control and Prevention, accessed 7 November 2024); https://www.cdc.gov/bird-flu/situation-summary/index.html.
    1. Belser JA, Eckert AM, Tumpey TM & Maines TR Complexities in ferret influenza virus pathogenesis and transmission models. Microbiol. Mol. Biol. Rev. 80, 733–744 (2016). - PMC - PubMed

MeSH terms

Substances

LinkOut - more resources