. 2024 Nov-Dec;21(6):622-629.
doi: 10.21873/cgp.20478.

SF3B4 Regulates Cellular Senescence and Suppresses Therapy-induced Senescence of Cancer Cells

Affiliations

SF3B4 Regulates Cellular Senescence and Suppresses Therapy-induced Senescence of Cancer Cells

Seungyeon Yang et al. Cancer Genomics Proteomics. 2024 Nov-Dec.

Abstract

Background/aim: Cellular senescence is a state in which cells permanently exit the cell cycle, preventing tumor growth, but it can also contribute to aging and chronic inflammation. Senescence induced by cancer therapies, known as therapy-induced senescence (TIS), halts cancer cell proliferation and prevents metastasis. TIS has been investigated as an important therapeutic approach that could minimize cytotoxicity effects. This study aimed to elucidate the role of splicing factor 3B subunit 4 (SF3B4) in cellular senescence and TIS in cancer cells.

Materials and methods: β-galactosidase staining was used to examine senescence induction. SF3B4 and p21 expression were determined by RT-qPCR and western blot. Cell proliferation and cell death were evaluated.

Results: SF3B4 expression decreases in replicative senescent human fibroblasts and its knockdown induces senescence via a p21-dependent pathway. In A549 non-small cell lung cancer (NSCLC) cells, SF3B4 knockdown also increased senescence markers. Notably, SF3B4 overexpression mitigated doxorubicin-induced senescence in A549 cells.

Conclusion: SF3B4 regulates senescence, and this study highlights its potential as a therapeutic target for developing better cancer treatment strategies by leveraging TIS to suppress tumor growth and enhance treatment efficacy.

Keywords: NSCLC; SF3B4; Senescence; p21; therapy-induced senescence.


Conflict of interest statement

The Authors declare no conflicts of interest regarding this study.

Figures

Figure 1
Figure 1
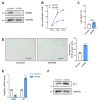
SF3B4 is decreased in replicative senescent human fibroblasts. (A) Representative images of SA-β-gal staining (left) and quantification (right) in proliferating (P) and replicative senescent (RS) IMR-90 cells. Scale bar represents 300 μm. (B) Protein levels of p21 in proliferating and RS cells (IMR-90 cells or human fibroblasts). (C and D) SF3B4 mRNA (C) and protein (D) levels in proliferating and RS cells (IMR-90 cells or human fibroblasts). GAPDH served as a loading control. Statistical analysis was based on two-tailed Student’s t-test. Error bars show standard deviation (SD); *p<0.1, ***p<0.001 and ****p<0.0001.
Figure 2
Figure 2
Knockdown of SF3B4 induces senescence in human fibroblasts. (A) Protein levels of SF3B4 in human fibroblasts transfected with non-targeting siRNA (siControl) or siRNA against SF3B4. GAPDH served as a loading control. (B) Growth curves of SF3B4 knockdown cells. Statistical significance was calculated using a two-way ANOVA with Sidak’s multiple comparison test. (C) Percentage of cell death in SF3B4 knockdown cells, measured using PI staining. Statistical analysis was based on two-tailed Student’s t-test. (D) Representative images of SA-β-gal staining for control and SF3B4 knockdown cells (left) and the percentage of SA-β-gal positive cells (right). Scale bar represents 300 μm. Statistical analysis was based on two-tailed Student’s t-test. (E) Relative mRNA levels of indicated genes in control and SF3B4 knockdown cells. Statistical analysis was performed using two-way ANOVA with Sidak’s multiple comparisons test. (F) Protein levels of p21 in control and SF3B4 knockdown cells. GAPDH serves as a loading control. Error bars show standard deviation (SD); ns, not significant, ****p<0.0001.
Figure 3
Figure 3
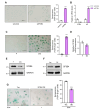
Knockdown of SF3B4 promotes p21-dependent cellular senescence. (A) Protein levels of p21 and SF3B4 in human fibroblasts transfected with non-targeting siRNA (siControl) or siRNAs against p21 or SF3B4. (B) Representative images of SA-β-gal staining for cells transfected with control, SF3B4 and/or p21 siRNAs as indicated (left) and the percentage of SA-β-gal positive cells (right). Scale bar represents 300 μm. Statistical analysis was performed using one-way ANOVA with Dunnett’s multiple comparisons test. Error bars show standard deviation (SD). ****p<0.0001.
Figure 4
Figure 4
SF3B4 inhibits senescence induction in A549 cancer cells following chemotherapy. (A) Representative images of SA-β-gal staining for A549 cells transfected with non-targeting siRNA (siControl) or siRNA against SF3B4 (left) and the percentage of SA-β-gal positive cells (right). Scale bar represents 300 μm. Statistical analysis was based on two-tailed Student’s t-test. (B) Relative mRNA levels of indicated genes in control and SF3B4 knockdown cells. Statistical analysis was performed using two-way ANOVA with Sidak’s multiple comparisons test. (C) Representative images of SA-β-gal staining for proliferating and DOX-induced senescence (DIS) A549 cells (left) and the percentage of SA-β-gal positive cells (right). Scale bar represents 100 μm. Statistical analysis was based on two-tailed Student’s t-test. (D and E) SF3B4 mRNA (D) and protein (E) levels in proliferating and DIS A549 cells. Statistical analysis was based on two-tailed Student’s t-test. (F) Protein levels of SF3B4 in A549 cells stably expressing empty vector or SF3B4. GAPDH served as a loading control. (G) Representative images of SA-β-gal staining for control and SF3B4-overexpressing A549 cells following DOX treatment (left) and the percentage of SA-β-gal positive cells (right). Scale bar represents 300 μm. Statistical analysis was based on two-tailed Student’s t-test. Error bars show standard deviation (SD); **p<0.01 and ****p<0.0001.

References

    1. Campisi J, d’Adda di Fagagna F. Cellular senescence: when bad things happen to good cells. Nat Rev Mol Cell Biol. 2007;8(9):729–740. doi: 10.1038/nrm2233. - DOI - PubMed
    1. Coppé JP, Desprez PY, Krtolica A, Campisi J. The senescence-associated secretory phenotype: the dark side of tumor suppression. Annu Rev Pathol. 2010;5:99–118. doi: 10.1146/annurev-pathol-121808-102144. - DOI - PMC - PubMed
    1. Collado M, Serrano M. Senescence in tumours: evidence from mice and humans. Nat Rev Cancer. 2010;10(1):51–57. doi: 10.1038/nrc2772. - DOI - PMC - PubMed
    1. McHugh D, Gil J. Senescence and aging: Causes, consequences, and therapeutic avenues. J Cell Biol. 2018;217(1):65–77. doi: 10.1083/jcb.201708092. - DOI - PMC - PubMed
    1. Huang W, Hickson LJ, Eirin A, Kirkland JL, Lerman LO. Cellular senescence: the good, the bad and the unknown. Nat Rev Nephrol. 2022;18(10):611–627. doi: 10.1038/s41581-022-00601-z. - DOI - PMC - PubMed

MeSH terms

LinkOut - more resources