. 2024 Oct 28;31(10-11):a054018.
doi: 10.1101/lm.054018.124. Print 2024 Oct-Nov.

Dysregulating mTORC1-4E-BP2 signaling in GABAergic interneurons impairs hippocampus-dependent learning and memory

Affiliations

Dysregulating mTORC1-4E-BP2 signaling in GABAergic interneurons impairs hippocampus-dependent learning and memory

Ziying Huang et al. Learn Mem. .

Abstract

Memory formation is contingent on molecular and structural changes in neurons in response to learning stimuli-a process known as neuronal plasticity. The initiation step of mRNA translation is a gatekeeper of long-term memory by controlling the production of plasticity-related proteins in the brain. The mechanistic target of rapamycin complex 1 (mTORC1) controls mRNA translation, mainly through phosphorylation of the eukaryotic initiation factor 4E (eIF4E)-binding proteins (4E-BPs) and ribosomal protein S6 kinases (S6Ks). mTORC1 signaling decreases throughout brain development, starting from the early postnatal period. Here, we discovered that in mice, the age-dependent decrease in mTORC1 signaling occurs selectively in excitatory but not inhibitory neurons. Using a gene conditional knockout (cKO) strategy, we demonstrate that either up- or downregulating the mTORC1-4E-BP2 axis in GAD65 inhibitory interneurons, but not excitatory neurons, results in long-term object recognition and object location memory deficits. Our data indicate that the mTORC1 pathway in inhibitory but not excitatory neurons plays a key role in memory formation.


Figures

Figure 1.
Figure 1.
mTORC1 activity in excitatory neurons versus inhibitory neurons during postnatal development to adulthood. (A) Representative immunoblots of hippocampus lysates taken from early postnatal (P10–15) and adult (P84–88) mice. (BD) Quantification of (a). Number of mice, n = 8 per group, (**) P < 0.01, (****) P < 0.0001, calculated with an unpaired t-test. (E) Confocal microscopy images (scale bar, 50 μm, magnification 20×) of mouse hippocampus immunostained for GAD67 (red) and p-S6 (Ser240/244) (green) at P12 and P86. (F) Quantification (integrated density) of p-S6 (240/244) (green) from the CA1 pyramidal neuron layer of P12 and P86 mice, (**) P < 0.01, unpaired t-test. Data are presented as mean ± SEM. Number of mice, n = 4 per group. (G) Quantification (integrated density) of p-S6 (240/244) (green) from GAD67-positive neurons (red) of P12 and P86 mice; (ns) not significant. Data are presented as mean ± SEM. Number of mice, n = 4 per group.
Figure 2.
Figure 2.
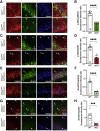
Validation of Raptor and 4E-BP2 deletion in CaMK2A and GAD67 positive neurons. (A) Immunofluorescence analysis of p-S6 (S240/244) (green) in CaMK2A+ cells (red) in Rptorflx/flx:Camk2a-Cre versus Rptor+/+:Camk2a-Cre (n = 5). (B) Quantification (mean integrated density) of p-S6 (240/244)/CaMK2A ratio from Rptorflx/flx:Camk2a-Cre versus Rptor+/+:Camk2a-Cre mice (cell number = 10). (C) Immunofluorescence analysis of p-S6 (240/244) (green) in GAD67-positive cells (red) in Rptorflx/flx:Gad2-Cre versus Rptor+/+:Gad2-Cre (mice = 5). (D) Quantification (mean integrated density) of p-S6 (240/244)/Gad67 ratio from Rptorflx/flx:Gad2-Cre versus Rptor+/+:Gad2-Cre mice (cell number = 9,10, respectively). (E) Immunofluorescence analysis of 4E-BP2 (green) in CaMK2A+ cells (red) in Eif4ebp2flx/flx:Camk2a-Cre versus Eif4ebp2+/+:Camk2a-Cre. (F) Quantification (mean integrated density) of 4E-BP2 protein/CaMK2A ratio from Eif4ebp2flx/flx:Camk2a-Cre versus Eif4ebp2+/+:Camk2a-Cre (cell number = 7). (G) Immunofluorescence analysis of 4E-BP2 (green) in GAD67-positive cells (red) in Eif4ebp2flx/flx:Gad2-Cre versus Eif4ebp2+/+:Gad2-Cre. (Η) Quantification (mean integrated density) of 4E-BP2 protein/GAD67 ratio from Eif4ebp2flx/flx:Gad2-Cre versus Eif4ebp2+/+:Gad2-Cre (cell number = 7). Confocal microscopy images: scale bar, 20 µm; magnification 60×. Cell nuclei are stained with Hoechst (blue). Statistical significance: (***) P < 0.001, (****) P < 0.0001 calculated with an unpaired t-test. Data are presented as mean ± SEM.
Figure 3.
Figure 3.
Inhibitory neurons require optimal mTORC1 activity to promote memory formation. (A) Schematics of the hippocampus-dependent memory tests used for the study. (Left panel) Novel object location (NOL). (Middle panel) OPL. (Right panel) NOR. (BD) Memory measured by DI of NOL, OPL, and NOR, respectively, during testing in Rptorflx/flx:Gad2-Cre (NOL n = 10; OPL n = 12; NOR n = 13) versus Rptor+/+:Gad2-Cre (NOL n = 12; OPL n = 11; NOR n = 13). (EG) Memory measured by DI of NOL, OPL, and NOR, respectively, during testing in Eif4ebp2flx/flx:Gad2-Cre (NOL n = 15; OPL n = 15; NOR n = 15) versus Eif4ebp2+/+:Gad2-Cre (NOL n = 16; OPL n = 16; NOR n = 16). Statistical significance: (*) P < 0.05, (**) P < 0.01; (ns) not significant, calculated by an unpaired t-test. (###) P < 0.001; (ns) not significant, calculated by a one-sample t-test. Data are presented with box and whisker plots where “+” indicates the mean. Dashed line indicates no discrimination of objects (i.e., memory impairment).
Figure 4.
Figure 4.
mTORC1-4E-BP2 signaling in excitatory neurons is dispensable for memory formation. (A) Schematics of the hippocampus-dependent memory tests used for the study. (Left panel) NOL. (Middle panel) OPL. (Right panel) NOR. (BD) Memory measured by DI of NOL, OPL, and NOR, respectively, during testing in Rptorflx/flx:Camk2a-Cre (NOL n = 14; OPL n = 13; NOR n = 13) versus Rptor +/+:Camk2a-Cre (NOL n = 13; OPL n = 14; NOR n = 14). (EG) Memory measured by DI of NOL, OPL, and NOR, respectively, during testing in Eif4ebp2flx/flx:Camk2a-Cre (NOL n = 11; OPL n = 10; NOR n = 11) versus Eif4ebp2+/+:Camk2a-Cre (NOL n = 10; OPL n = 10; NOR n = 10), (**) P < 0.01; (ns) not significant, calculated by an unpaired t-test. Statistical significance: (##) P < 0.01, (###) P < 0.001; (ns) not significant, calculated by a one-sample t-test. Data are presented with box and whisker plots where “+” indicates the mean. Dashed line indicates no discrimination of objects (i.e., memory impairment).
Figure 5.
Figure 5.
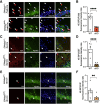
Confirmation of 4E-BP2 cKO in inhibitory neuron subclasses. (A) Immunofluorescence analysis of 4E-BP2 (green) in PValb-positive cells (red) in Eif4ebp2flx/flx:Pvalb-Cre versus Eif4ebp2+/+:Pvalb-Cre mice (n = 5). (B) Quantification (mean integrated density) of 4E-BP2 protein/PValb ratio from Eif4ebp2flx/flx:Pvalb-Cre versus Eif4ebp2+/+:Pvalb-Cre (cell number = 7). (C) Immunofluorescence analysis of 4E-BP2 (green) in SST-positive cells (red) in Eif4ebp2flx/flx:Sst-Cre versus Eif4ebp2+/+:Sst-Cre. (D) Quantification (mean integrated density) of 4E-BP2 protein/SST ratio from Eif4ebp2flx/flx:Sst-Cre versus Eif4ebp2+/+:Sst-Cre (cell number = 7). (E) Immunofluorescence analysis of 4E-BP2 (green) in VIP-positive cells (red) in Eif4ebp2flx/flx:Vip-Cre versus Eif4ebp2+/+:Vip-Cre. (F) Quantification (mean integrated density) of 4E-BP2 protein/VIP ratio from Eif4ebp2flx/flx:Vip2-Cre versus Eif4ebp2+/+:Vip-Cre (cell number = 7). Statistical significance: (**) P < 0.01, (****) P < 0.0001, calculated using an unpaired t-test. Confocal microscopy images: scale bar, 20 µm, magnification 60×. Cell nuclei were stained with Hoechst (blue).
Figure 6.
Figure 6.
Analysis of NOL and NOR memory in inhibitory neuron subclass-specific 4E-BP2 knockout mice. (A) Schematics of the hippocampus-dependent memory tests used for the study. (Left panel) NOL. (Right panel) NOR. (B) DI and total exploration time for Eif4ebp2flx/flx:Pvalb-Cre (n = 12) versus Eif4ebp2+/+:Pvalb-Cre (n = 12) in the NOL task (left panel) and NOR task (right panel). (C) DI and total exploration time for Eif4ebp2flx/flx:Sst-Cre (n = 14) versus Eif4ebp2+/+:Sst-Cre (n = 14) in the NOL task (left panel) and NOR task (right panel). (D) DI and total exploration time for Eif4ebp2flx/flx:Vip-Cre (n = 11) versus Eif4ebp2+/+:Vip-Cre (n = 9) in the NOL task (left panel) and NOR task (right panel). Statistical significance: (*) P < 0.05, (**) P < 0.01, (***) P < 0.001; (ns) not significant, calculated with an unpaired t-test. Data are presented as mean ± SEM. (#) P < 0.05, (##) P < 0.01, (###) P < 0.001; (ns) not significant, calculated by a one-sample t-test. Data are presented with box and whisker plots where “+” indicates the mean. Dashed line indicates no discrimination of objects (i.e., memory impairment).

References

    1. Aguilar-Valles A, De Gregorio D, Matta-Camacho E, Eslamizade MJ, Khlaifia A, Skaleka A, Lopez-Canul M, Torres-Berrio A, Bermudez S, Rurak GM, et al. 2021. Antidepressant actions of ketamine engage cell-specific translation via eIF4E. Nature 590: 315–319. 10.1038/s41586-020-03047-0 - DOI - PubMed
    1. Amegandjin CA, Choudhury M, Jadhav V, Carriço JN, Quintal A, Berryer M, Snapyan M, Chattopadhyaya B, Saghatelyan A, Di Cristo G. 2021. Sensitive period for rescuing parvalbumin interneurons connectivity and social behavior deficits caused by TSC1 loss. Nat Commun 12: 3653. 10.1038/s41467-021-23939-7 - DOI - PMC - PubMed
    1. Antion MD, Merhav M, Hoeffer CA, Reis G, Kozma SC, Thomas G, Schuman EM, Rosenblum K, Klann E. 2008. Removal of S6K1 and S6K2 leads to divergent alterations in learning, memory, and synaptic plasticity. Learn Mem 15: 29–38. 10.1101/lm.661908 - DOI - PMC - PubMed
    1. Antonoudiou P, Tan YL, Kontou G, Upton AL, Mann EO. 2020. Parvalbumin and somatostatin interneurons contribute to the generation of hippocampal gamma oscillations. J Neurosci 40: 7668–7687. 10.1523/JNEUROSCI.0261-20.2020 - DOI - PMC - PubMed
    1. Artinian J, Jordan A, Khlaifia A, Honoré E, La Fontaine A, Racine AS, Laplante I, Lacaille JC. 2019. Regulation of hippocampal memory by mTORC1 in somatostatin interneurons. J Neurosci 39: 8439–8456. 10.1523/JNEUROSCI.0728-19.2019 - DOI - PMC - PubMed

MeSH terms

Substances

LinkOut - more resources