Comparative Study
. 2024 Nov 4;11(11):ENEURO.0391-24.2024.
doi: 10.1523/ENEURO.0391-24.2024. Print 2024 Nov.

Comparative Analysis of Six Adeno-Associated Viral Vector Serotypes in Mouse Inferior Colliculus and Cerebellum

Affiliations
Comparative Study

Comparative Analysis of Six Adeno-Associated Viral Vector Serotypes in Mouse Inferior Colliculus and Cerebellum

Isabelle Witteveen et al. eNeuro. .

Abstract

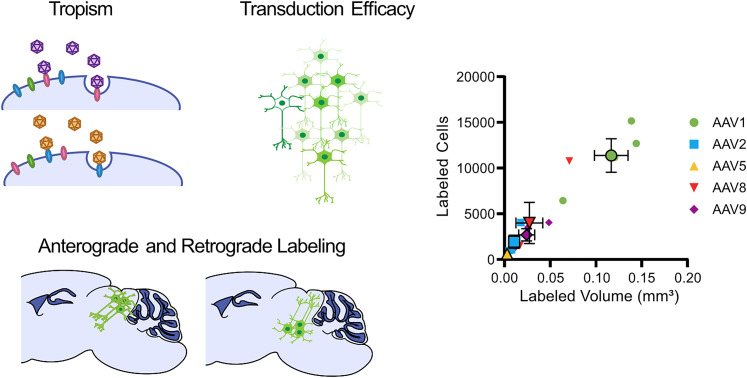
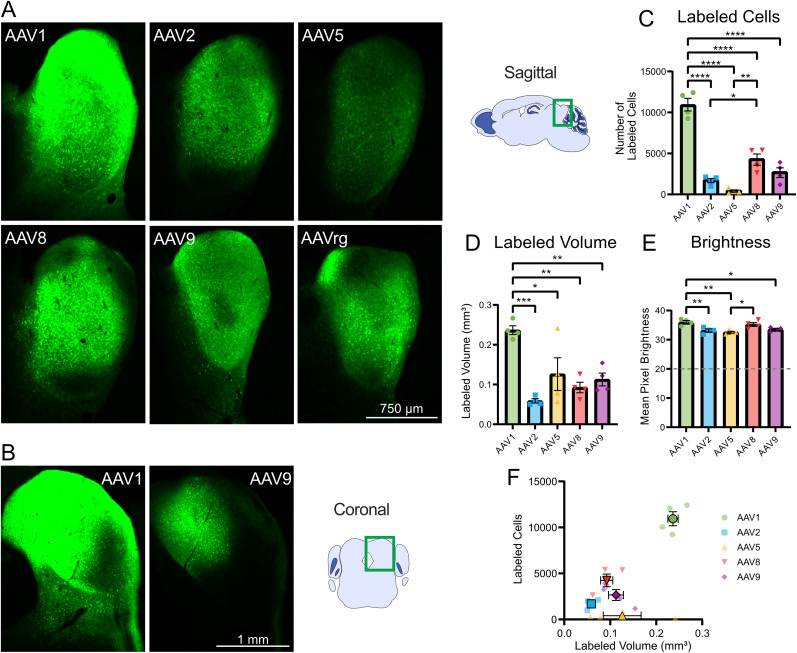
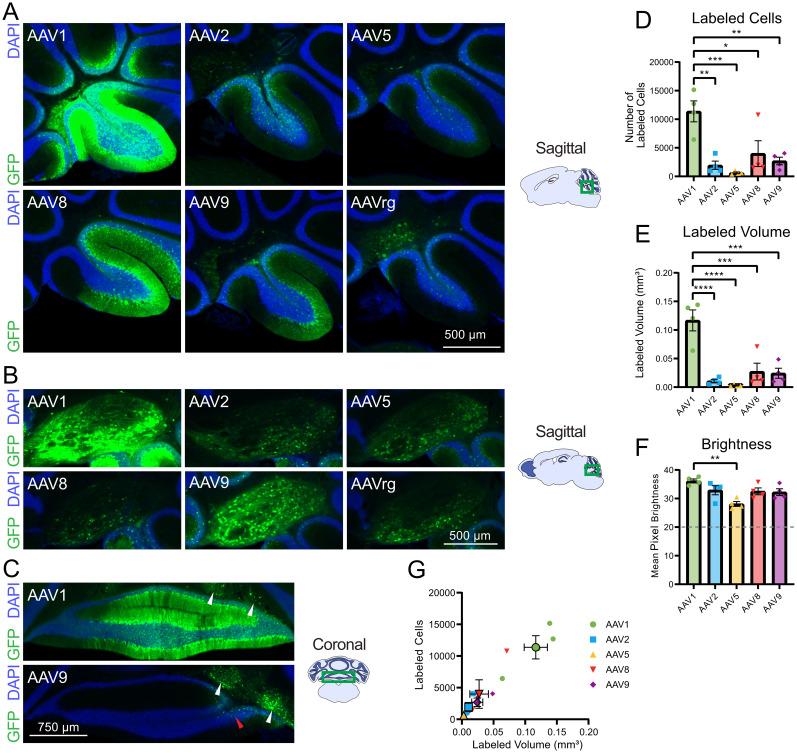
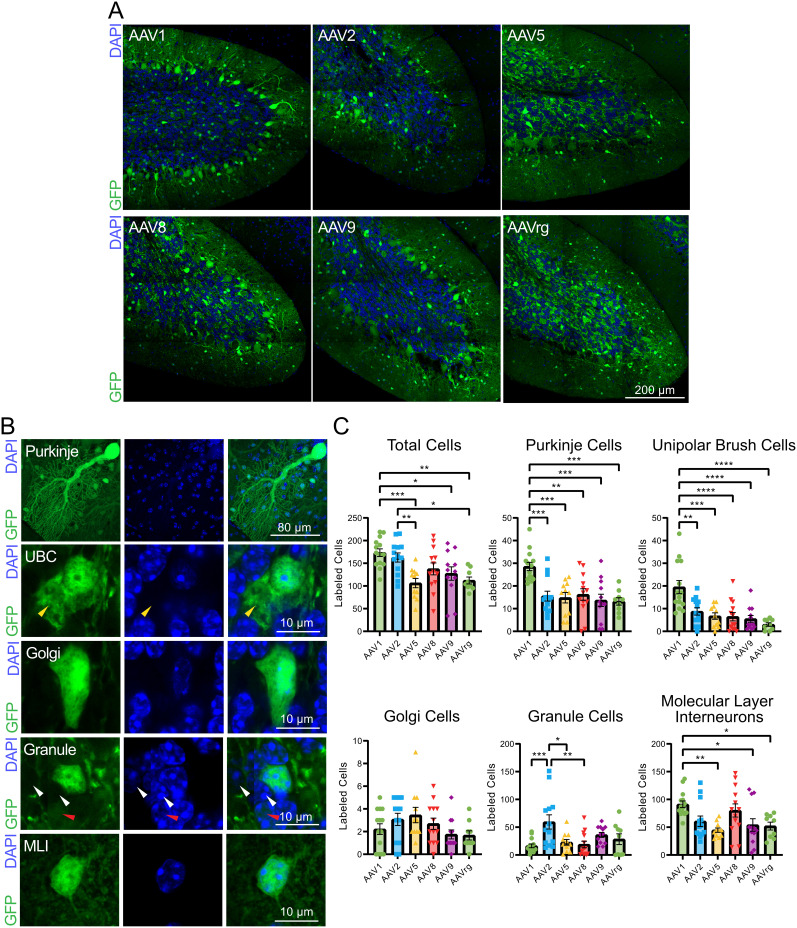
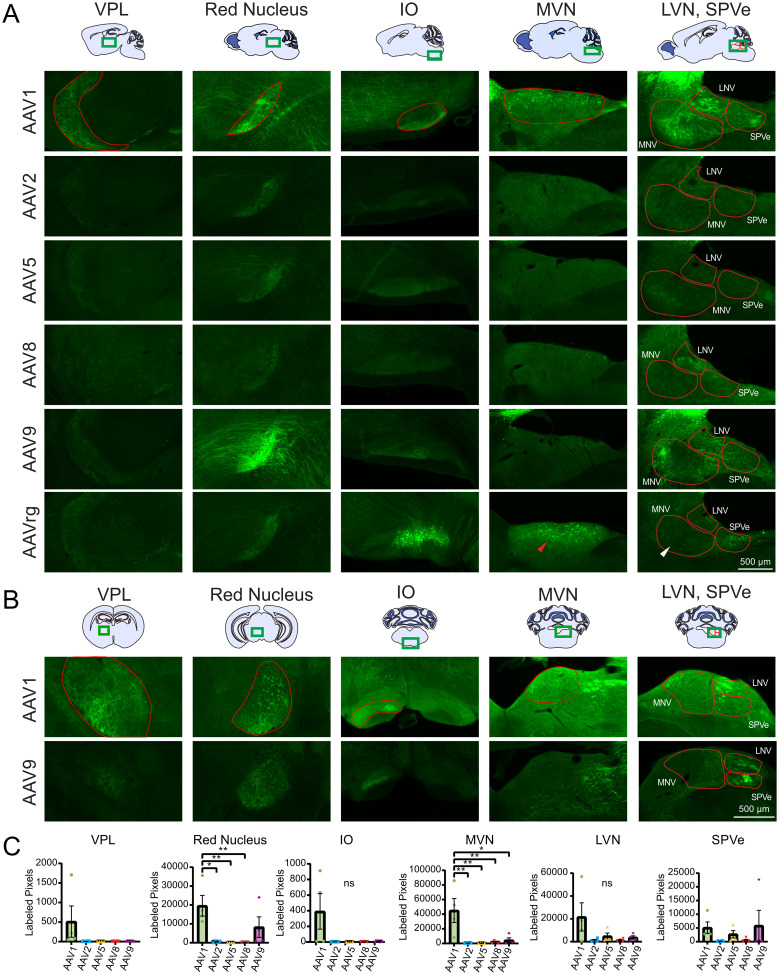
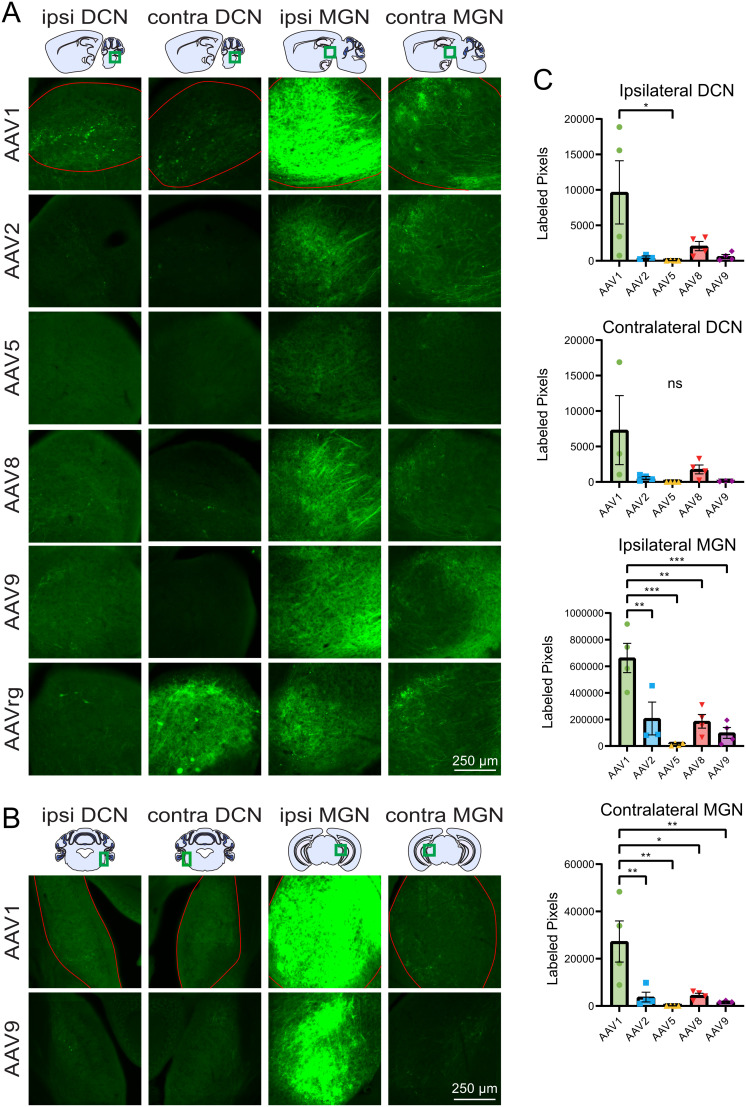
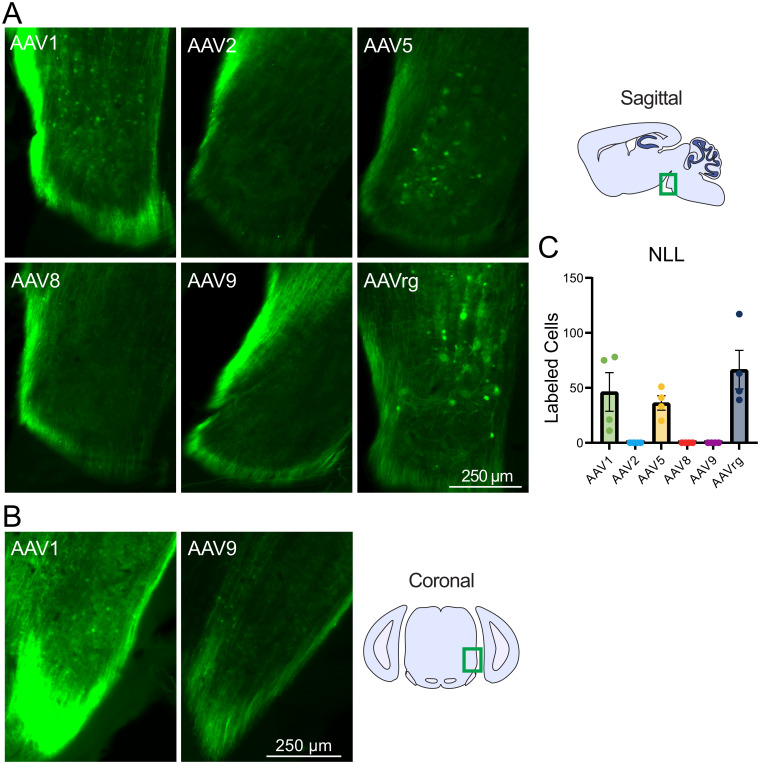
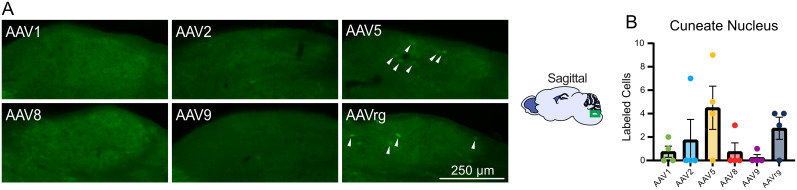
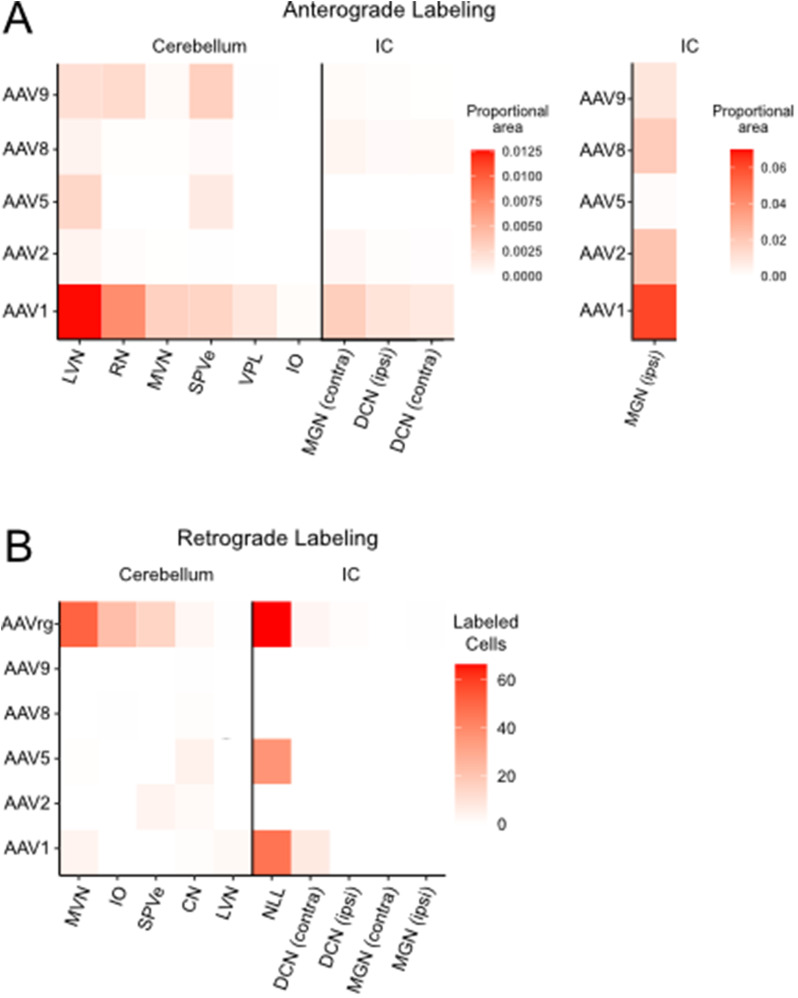
Adeno-associated viral vector (AAV) serotypes vary in how effectively they express genes across different cell types and brain regions. Here we report a systematic comparison of the AAV serotypes 1, 2, 5, 8, 9, and the directed evolution derived AAVrg, in the inferior colliculus (IC) and cerebellum. The AAVs were identical apart from their different serotypes, each having a synapsin promotor and expressing GFP (AAV-hSyn-GFP). Identical titers and volumes were injected into the IC and cerebellum of adult male and female mice, and brains were sectioned and imaged 2 weeks later. Transduction efficacy, anterograde labeling of axonal projections, and retrograde labeling of somata were characterized and compared across serotypes. Cell-type tropism was assessed by analyzing the morphology of the GFP-labeled neurons in the cerebellar cortex. In both the cerebellum and IC, AAV1 expressed GFP in more cells, labeled a larger volume, and produced significantly brighter labeling than all other serotypes, indicating superior transgene expression. AAV1 labeled more Purkinje cells, unipolar brush cells, and molecular layer interneurons than the other serotypes, while AAV2 labeled a greater number of granule cells. These results provide guidelines for the use of AAVs as gene delivery tools in these regions.

Keywords: adeno-associated virus; cerebellum; inferior colliculus.


Conflict of interest statement

The authors declare no competing financial interests.

Figures

None
Visual Abstract
Figure 1.
Figure 1.
AAV1 produced the highest transgene expression and the largest labeled volume in the IC. A, Intracranial injection of the AAV1, 2, 5, 8, 9, and rg serotypes led to GFP expression in the IC. Representative sagittal sections of the injection site in the IC for each serotype. B, Additional representative coronal sections of AAV1 and AAV9 injected IC. C, Bar graph showing mean number of labeled cells across serotypes. AAV1 labeled significantly more cells than AAV2, 5, 8, and 9, indicating superior transduction efficacy. D, Bar graph showing mean volume of labeling across serotypes. The volume of AAV1 labeling also was significantly greater than that of AAV2, 5, 8, and 9. Horizontal line indicates the brightness threshold over which pixels were considered labeled and were included in the mean brightness calculation. E, Bar graph showing mean pixel brightness across serotypes. AAV1 produced significantly greater mean pixel brightness than AAV2, 5, and 9. F, Comparison of number of labeled cells with labeled volume. Identical imaging parameters and brightness and contrast adjustments were applied to all images in the same panel. Statistical comparisons were made using one-way ANOVAs followed by Tukey's HSD tests. Error bars are SEM. * indicates p < 0.05, ** indicates p < 0.01, *** indicates p < 0.001, **** indicates p < 0.0001.
Figure 2.
Figure 2.
AAV1 produced the highest transgene expression and largest labeled volume in the cerebellum. A, Representative sagittal sections of injected cerebellar cortex for each serotype. B, Representative sagittal sections of the interposed nucleus. C, Additional representative coronal sections of AAV1 and AAV9 injected cerebellum. White arrows indicate transfected cells in the deep cerebellar nuclei, and the red arrow indicates the minimal spread to the cerebellar cortex by AAV9. D, Bar graph showing mean number of labeled cells across serotypes. AAV1 labeled significantly more cells than AAV2, 5, 8, and 9, indicating superior transduction efficacy. E, Bar graph showing mean volume of labeling across serotypes. The labeled volume of AAV1 also was significantly greater than that of AAV2, 5, 8, and 9. F, Bar graph showing mean pixel brightness across serotypes. AAV1 produced significantly greater mean pixel brightness compared with AAV2, 5, 8, and 9. Horizontal line indicates the brightness threshold over which pixels were considered labeled and were included in the mean brightness calculation. G, Comparison of number of cells labeled by labeled volume. Identical imaging parameters and brightness and contrast adjustments were applied to all images in the same panel. Statistical comparisons were made using one-way ANOVAs followed by Tukey's HSD tests. Error bars are SEM. * indicates p < 0.05, ** indicates p < 0.01, *** indicates p < 0.001, **** indicates p < 0.0001.
Figure 3.
Figure 3.
AAV serotype tropism in the cerebellum. A, Representative sagittal sections of lobule X of the cerebellum. B, Representative images of cerebellar cell types. Fluorescent cells were characterized utilizing the unique morphology of cerebellar cortex cell types. The yellow arrow indicates the dendritic brush unique to unipolar brush cells. White arrows indicate DAPI-positive cells devoid of GFP expression and the red arrow indicates a DAPI-positive cell with dim GFP expression. C, Bar graphs showing the number of GFP-positive cerebellar cell types across AAV serotypes. Images magnified to 63× of lobule X of the cerebellum were analyzed to determine tropism of AAV1, 2, 5, 8, 9, and rg. The AAV1 serotype labeled significantly more total cells compared with AAV5, 9, and rg. AAV1 labeled significantly more Purkinje and unipolar brush cells compared with all the other serotypes and significantly more molecular layer interneurons than AAV5, 9, and rg. AAV2 transfected significantly more granule cells compared with AAV1, 5, and 8. Identical imaging parameters and brightness and contrast adjustments were applied to all images in the same panel. Statistical comparisons were made using one-way ANOVAs followed by Tukey's HSD tests. Error bars are SEM. * indicates p < 0.05, ** indicates p < 0.01, *** indicates p < 0.001, **** indicates p < 0.0001.
Figure 4.
Figure 4.
Labeled axonal projections from the cerebellum to the ventral posterolateral nucleus of the thalamus, the red nucleus, the inferior olive, the vestibular nuclei. A, Representative images of the VPL, RN, IO, MVN, SPVe, and LVN by serotype. Differences in the degree of retrograde labeling within the MVN were present for slices infected with AAVrg (red arrow vs white arrow). B, Representative coronal images of contralateral VPL, RN, IO, and the ipsilateral MVN, SPVe, and LVN. C, Bar graphs showing serotype brightness quantification for each region. Labeled projections in all regions could be seen in slices infected AAV1 and AAV9, projections in the contralateral IO, ipsilateral MVN, LVN, and SPVe could be seen in slices infected with AAVrg, and projections in the MVN, LVN, and SPVe could be seen with slices infected with AAV8. Statistical comparisons were made using one-way ANOVAs followed by Tukey's HSD tests. VPL and SPVe were not statistically tested. Error bars are SEM. * indicates p < 0.05, ** indicates p < 0.01, ns indicates p > 0.05.
Figure 5.
Figure 5.
Labeled IC projections to the dorsal cochlear nucleus and medial geniculate nucleus. A, Representative images of the DCN and MGN both ipsilateral and contralateral to the injection site. B, Additional coronal images of the ipsilateral and contralateral DCN and MGN. C, Bar graphs showing the mean serotype brightness quantification for each region. Statistical comparisons were made using one-way ANOVAs followed by Tukey's HSD tests. Error bars are SEM. * indicates p < 0.05, ** indicates p < 0.01, *** indicates p < 0.001, ns indicates p > 0.05.
Figure 6.
Figure 6.
Retrograde labeling of the nucleus of the lateral lemniscus from the IC. A, Representative sagittal images of the ipsilateral nucleus of the lateral lemniscus by serotype. B, Representative coronal images of the nucleus of the lateral lemniscus following AAV1 and 9 injection to the IC. C, Bar graph showing mean number of labeled cells by serotype. Labeled cell bodies were present in the nucleus of the lateral lemniscus in brains injected with AAV1, 5, and rg, but completely absent AAV2, 8, or 9. Identical imaging parameters and brightness and contrast adjustments were applied to all images in the same panel. No statistical tests were performed.
Figure 7.
Figure 7.
Retrograde labeling of the cuneate nucleus from the cerebellum. A, Representative images of the ipsilateral cuneate nucleus by serotype. B, Bar graph showing mean number of labeled cells by serotype. Labeled cell bodies were present in the cuneate nucleus in brains injected with AAV5 or rg (white arrows). Identical imaging parameters and brightness and contrast adjustments were applied to all images in the same panel. No statistical tests were performed.
Figure 8.
Figure 8.
Summary of anterograde and retrograde labeling by serotype across regions of the midbrain and brainstem. Data from the previous figures were normalized to the total area of the nucleus and combined to create heatmaps of (A) anterograde and (B) retrograde labeling across serotypes and brain areas. Projections from IC to ipsilateral MGN labeled a much larger area than the other projections and are therefore plotted separately using a different color scale. AAV1 produced superior anterograde labeling compared with the other serotypes. As expected, AAVrg produced superior retrograde labeling. Overall, AAV8 and AAV9 had the lowest level of retrograde labeling, while AAV2 and 8 had the lowest anterograde labeling from the cerebellum and AAV5 had the lowest anterograde labeling from the IC.

Update of

Similar articles

Cited by

References

    1. Alisky JM, Hughes SM, Sauter SL, Jolly D, Dubensky TWJ, Staber PD, Chiorini JA, Davidson BL (2000) Transduction of murine cerebellar neurons with recombinant FIV and AAV5 vectors. Neuroreport 11:2669–2673. 10.1097/00001756-200008210-00013 - DOI - PubMed
    1. Apps R, Garwicz M (2005) Anatomical and physiological foundations of cerebellar information processing. Nat Rev Neurosci 6:297–311. 10.1038/nrn1646 - DOI - PubMed
    1. Asanuma C, Thach WT, Jones EG (1983) Distribution of cerebellar terminations and their relation to other afferent terminations in the ventral lateral thalamic region of the monkey. Brain Res Rev 5:237–265. 10.1016/0165-0173(83)90015-2 - DOI - PubMed
    1. Aschauer DF, Kreuz S, Rumpel S (2013) Analysis of transduction efficiency, tropism and axonal transport of AAV serotypes 1, 2, 5, 6, 8 and 9 in the mouse brain (Qiu J, ed). PLoS One 8:e76310. 10.1371/journal.pone.0076310 - DOI - PMC - PubMed
    1. Atchison RW, Casto BC, Hammon WM (1965) Adenovirus-associated defective virus particles. Science 149:754–756. 10.1126/science.149.3685.754 - DOI - PubMed

Publication types

Substances

LinkOut - more resources