. 2024 Oct 28;9(1):50.
doi: 10.1038/s41525-024-00442-8.

SLC16A8 is a causal contributor to age-related macular degeneration risk

Affiliations

SLC16A8 is a causal contributor to age-related macular degeneration risk

Navid Nouri et al. NPJ Genom Med. .

Abstract

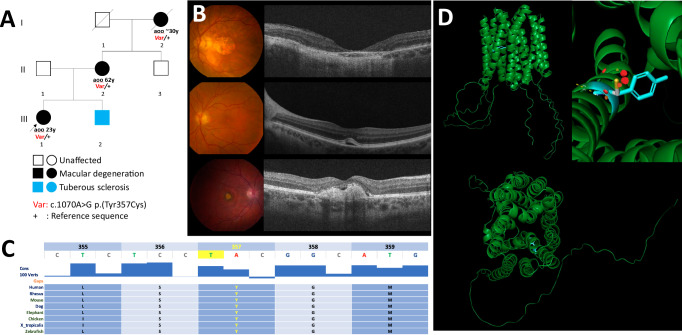
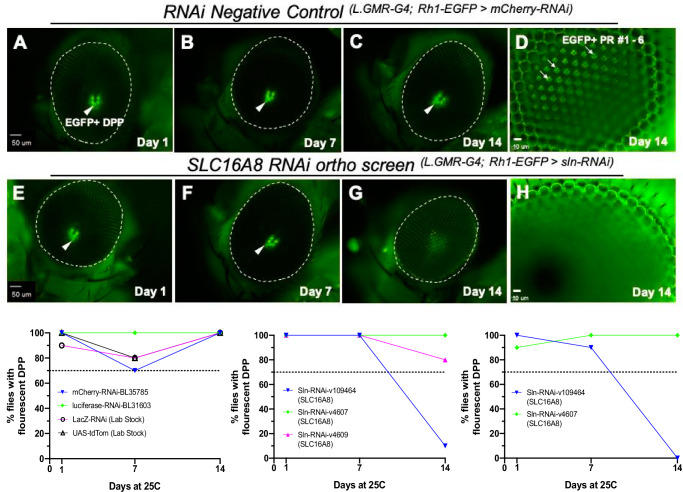
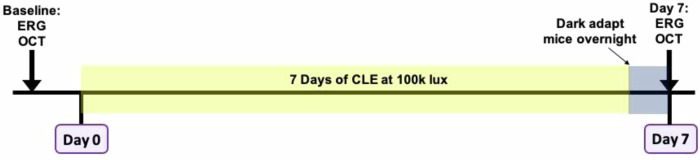
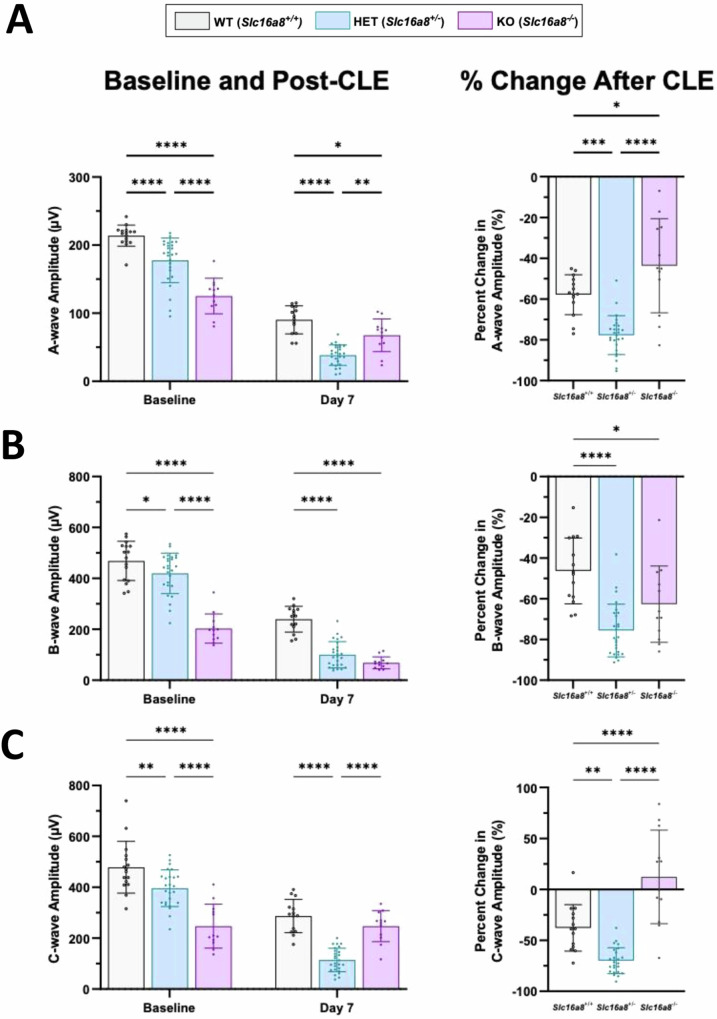
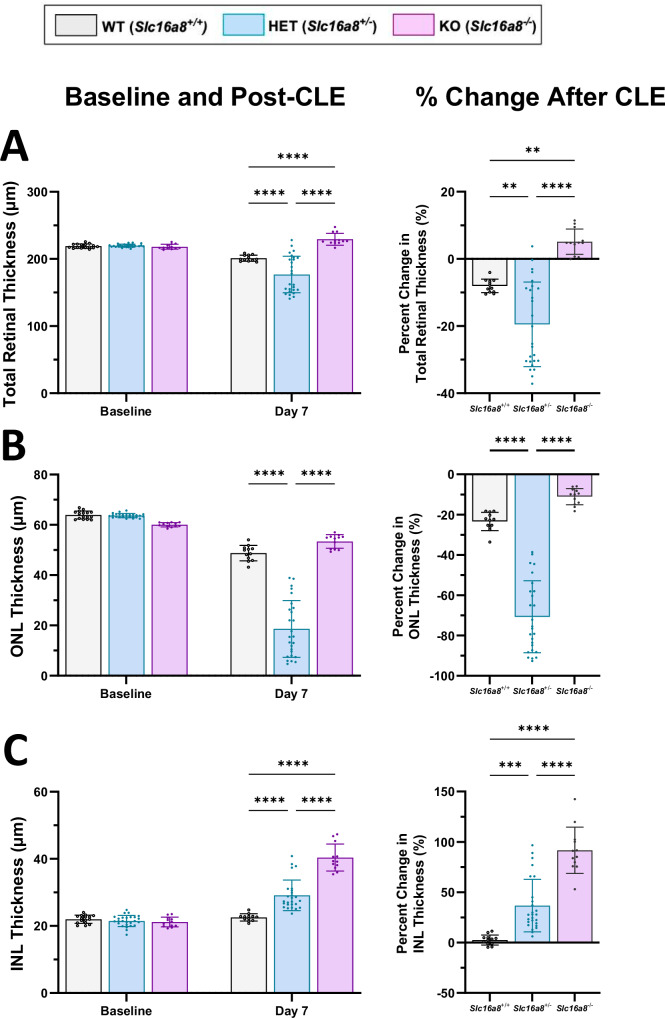
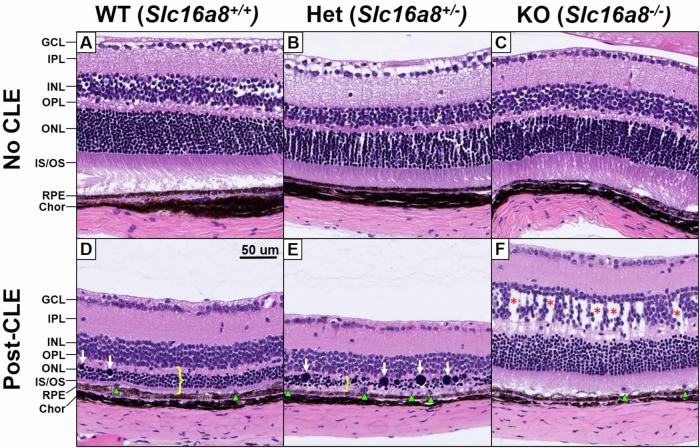
Age-related macular degeneration (AMD), a complex neurodegenerative disease, is a leading cause of visual impairment worldwide with a strong genetic component. Genetic studies have identified several loci, but few causal genes with functional characterization. Here we highlight multiple lines of evidence which show a causal role in AMD for SLC16A8, which encodes MCT3, a retinal pigment epithelium (RPE) specific lactate transporter. First, in an unbiased, genome-wide analysis of rare coding variants we show multiple SLC16A8 rare variants are associated with AMD risk, corroborating previous borderline significant reports from AMD rare variant studies. Second, we report a novel SLC16A8 mutation in a three-generation family with early onset macular degeneration. Finally, mis-expression in multiple model organisms shows functional and anatomic retinal consequences. This study highlights the important role for SLC16A8 and lactate regulation towards outer retina/RPE health and highlights a potential new therapeutic opportunity for the treatment of AMD.


Conflict of interest statement

N.N., B.H.G., A.S., T.T., G.J.K., K.C.B., Y.M., A.S., S.V.E., MIMcC, J.W.H., S.Y.C., H.J., B.L.Y. are (or were at the time of contribution) employees of Genentech/Roche with stock and stock options in Roche. N.N., H.J., B.L.Y. are listed inventors on the Genentech Inc. patent application WO2023212273A, published November 2, 2023 covering the human genetics, Drosophila melanogaster and murine model portions of the text. All other authors declare no competing interest.

Figures

Fig. 1
Fig. 1. A family affected by vitelliform macular dystrophy.
A Pedigree. Aoo, Age of onset. All three affected harbors the c.1070 A > G p.(Tyr357Cys) variant in SLC16A8. B Fundus images and OCT of proband (top, 35 yrs), mother (middle, 62 yrs) and grandmother (bottom, 94 yrs). C Tyr357 and neighboring residues are well conserved among vertebrates. Image adapted from the UCSC Genome Browser http://genome.ucsc.edu. D Structural modeling of MCT3 encoded by SLC16A8 as predicted by AlphaFold (AlphaFold DB version 2022-11-01 created with the AlphaFold Monomer v2.0 pipeline) and visualized in PyMOL. The Tyrosine 357 residue is highlighted in blue. The protein is displayed with its 12 transmembrane domains forming a pore seeing from the cytoplasm view (bottom). Top right panel illustrates the substitution of Tyr357 (blue) by cysteine (pink and yellow stick). The red round fragments represent disruption of the protein structure as predicted by PyMOL.
Fig. 2
Fig. 2. Loss of Drosophila photoreceptor EGFP expression patterning in sln RNAi-knockdown eyes by Day 14.
Rhodopsin 1 EGFP labeling of photoreceptor rhabdomeres visualized by fluorescent deep pseudopupil (DPP) and optic neutralization imaging of the cornea (ONC) at days 1, 7, and 14 for negative controls (AC) Low magnification DPP (4×) and (D) high magnification ONC (40×) imaging of RNAi knockdowns for mCherry (RNAi-BL35785). EG RNAi knockdown for sln (VDRC#: 109464). D, H Only a subset of EGFP + PR are in focus under the microscope due to the curvature of the compound eye. Bottom panel graphs showing percentage of flies with intact fluorescent DPP. In all negative controls tested (left graph), 70–100% of flies had intact DPP by day 14 depending on the RNAi line and therefore a 70% threshold was set for phenotypes. Two separate knockdown experiments using silnoon (sln) RNAi-VDRC#109464 lines revealed 10% and 0% of flies had intact DPP by day 14 (Bottom: middle and right graphs). For each RNAi line tested n = 10 for each days 1, 7, and 14 timepoints. Scale bars: AC, EG = 50 µm; D and H = 10 µm.
Fig. 3
Fig. 3. Schematic of constant light exposure (CLE) experimental design for retinal damage in mouse models.
At baseline, measurements were taken using optical coherence tomography (OCT) and electroretinogram (ERG) recordings. Mice were placed in double-housed light boxes at Day 0 and exposed to constant light exposure (CLE) at 100 K lux. On the evening of Day 6, were dark adapted for day 7 ERG and OCT measurements.
Fig. 4
Fig. 4. ERG measurements before and after CLE-induced retinal damage.
A-, b-, and c-wave (AC; left panels) ERG amplitudes (µV) were measured at baseline and Day 7 for Slc16a8-WT, Het, and KO mice. Data is plotted as peak amplitudes (Mean ± SD), all n ≥ 12 eyes. AC; right panels: Percent change following CLE are shown for A-, b- and c-waves (Mean ± SD). A For a-wave amplitudes (µV) at baseline: Slc16a8 WT (213.87 ± 15.5), Het (177.63 ± 32.8), and KO (125.15 ± 26.14). A-wave baseline all P < 0.0001. A-wave amplitudes (µV) day 7: WT (90.30 ± 20.6), Het (38.39 ± 15.1), and KO (67.56 ± 23.96). At day 7 for WT vs. Het (P < 0.0001), WT vs. KO (P = 0.0474), and Het vs. KO (P = 0.0018). A-wave % change WT (-57.84 ± 9.8), Het (-77.70 ± 9.5), and KO (-43.68 ± 23.0). A-wave % change WT vs. Het (P < 0.005), WT vs. KO (P < 0.05), and Het vs. KO (P < 0.0001). B B-wave baseline amplitudes (µV): WT (468.66 ± 77.3), Het (419.65 ± 79.1), and KO (202.97 ± 57.5). B-waves baseline: WT vs. Het (P = 0.0443), WT vs. KO (P < 0.0001), and Het vs. KO (P < 0.0001). Day 7 B-wave amplitudes (µV): WT (239.78 ± 50.67), Het (100.15 ± 51.53), and KO (68.60 ± 23.33). Day 7 b-waves: WT vs. Het and WT vs. KO (both P < 0.0001). B-wave % change WT (-46.3 ± 16.2), Het (-75.60 ± 13.0), and KO (-62.67 ± 18.7). B-wave % change WT vs Het (P < 0.0001) and WT vs. KO (P < 0.05). C C-wave amplitudes (µV) at baseline: WT (478.57 ± 101.43), Het (396.01 ± 72.0), and KO (247.3 ± 86.10). C-wave baseline: WT vs. Het (P < 0.01), WT vs. KO (P < 0.0001), and Het vs. KO (P < 0.0001). Day 7 C-wave amplitudes (µV): WT (286.79 ± 65.24), Het (114.41 ± 46.0), and KO (247.24 ± 61.2). Day 7 WT vs. Het (P < 0.0001), WT vs. KO (P < 0.0001). C-wave % change WT (-37.80 ± 22.8), Het (-70.0 ± 12.64), and KO (12.26 ± 45.87). C-wave % change WT vs. Het (P < 0.01), WT vs. KO (P < 0.0001), and Het vs. KO (P < 0.0001). For a, b, and c-wave analysis: (AC; left panels) Mixed-effects analysis: a-wave: F(2, 49) = 25.61, P < 0.0001, b-wave: F(2, 49) = 19.02, P < 0.0001, c-wave: F(2, 99) = 31.41, P < 0.0001); multiple comparisons are between groups within timepoints, Sidak post-hoc., (A-C; right. panels) One-way ANOVA (a-wave: F(2, 49) = 27.13, P < 0.0001, b-wave: F(2, 49) = 16.82, P < 0.0001, c-wave: F(2, 48) = 39.14, P < 0.0001), Sidak post-hoc, % Change computed as (Day 7–Baseline)/Baseline *100.
Fig. 5
Fig. 5. OCT measurements of total, ONL, and INL retinal thickness before and after CLE-induced damage.
Total retinal, ONL and INL thickness were measured (µM) (A-C; left panels) by OCT at baseline and Day 7 of CLE. All data shown as mean ± SD, all n ≥ 12 eyes. Percent change following CLE are shown for Total, ONL and INL thickness in right panels (Mean ± SD). A For total retina thickness (µm) at baseline: Slc16a8 WT (219.11 ± 3.19), Het (219.86 ± 2.24), and KO (218.18 ± 3.6). For total retinal thickness (µm) at day 7: WT (201.11 ± 4.5), Het (176.91 ± 27.3), and KO (229.32 ± 8.9). For total retinal thickness at day 7 all P < 0.0001. For % change total retinal thickness (µm) WT (-8.07 ± 2.0), Het (-19.50 ± 12.59), and KO (5.11 ± 3.77). For % change total retinal thickness (µm) WT vs. Het (P < 0.01), WT vs. KO (p val<0.01), and Het vs. KO (p val<0.0001). B For ONL thickness at baseline: WT (63.93 ± 1.57), Het (63.93 ± 0.82), and KO (60.03 ± 0.85). For ONL thickness (µm) at day 7: WT (48.79 ± 3.06), Het (18.61 ± 11.3), and KO (53.40 ± 2.73). For ONL thickness (µm) at day 7: WT vs Het and Het vs. KO (p val<0.0001). For % change ONL thickness (µm) ONL WT (-23.39 ± 4.54), Het (-70.72 ± 17.84), and KO (-11.07 ± 4.03). C For INL thickness (µm) at baseline: WT (21.98 ± 1.22), Het (21.48 ± 1.65), and KO (21.15 ± 1.45). For INL thickness (µm) at day 7: WT (22.55 ± 1.05), Het (29.13 ± 4.56), and KO (40.38 ± 4.03). For INL thickness all p val<0.0001. For % change INL thickness (µm) WT (2.60 ± 5.02), Het (36.86 ± 26.11), and KO (91.70 ± 23.0). For % change INL thickness (µm) WT vs. Het (p val<0.001), WT vs. KO p val<0.0001), Het vs. KO (p val<0.0001). For total, ONL, and INL thickness comparisons: (AC; left panels). Mixed-effects analysis (interaction between genotype and timepoint as follows TRT: F(2, 98) = 29.97, P < 0.0001, ONL: F(2, 98) = 102.9, P < 0.0001, INL: F(2, 98) = 67.21, P < 0.0001), multiple comparisons reported are between groups within timepoints, Sidak post-hoc., (AC; right.panels) One-way ANOVA (TRT: F(2, 47) = 28.75, P < 0.0001, ONL: F(2, 47) = 102.9, P < 0.0001, INL: F(2, 47) = 49.78, P < 0.0001), Sidak post-hoc % Change computed as (Day 7 – Baseline)/Baseline *100.
Fig. 6
Fig. 6. Histologic evaluation of Slc16a8 loss of function mouse retinae at baseline and post-CLE.
Representative sections of hematoxylin and eosin (H&E) stained retina, photographed at the areas with greatest pathology (approximately 0.5–1 mm from the optic disc). At baseline, 10-week-old non-CLE samples demonstrate normal cellularity and architecture across all retinal layers in Slc16a8 WT, Het, and, KO genotypes (AC). Total retinal thinning following CLE was exacerbated in Slc16a8 Het retinas compared to WT, attributable entirely to degeneration of the photoreceptors, manifesting as thinning of the OPL, ONL, and OS/IS layers (D, E; yellow bracket). This was accompanied by and proportional to swollen and hyperchromatic photoreceptor nuclei (white arrows) subretinal phagocytic cells (green arrowheads), and dysmorphic RPE cells. Edema of the INL was present in all Slc16a8 KO retinas after CLE (F; red asterisks), but not observed in any WT or Het retinas. GCL ganglion cell layer, INL/ONL inner/outer nuclear layers, IPL/OPL inner/outer plexiform layers, IS/OS inner/outer segmented layers, RPE retinal pigment epithelium, Chor choroid.

References

    1. Wong, W. L. et al. Global prevalence of age-related macular degeneration and disease burden projection for 2020 and 2040: a systematic review and meta-analysis. Lancet Glob. Health2, e106–e116 (2014). - PubMed
    1. Lambert, N. G. et al. Risk factors and biomarkers of age-related macular degeneration. Prog. Retin Eye Res.54, 64–102 (2016). - PMC - PubMed
    1. van Lookeren Campagne, M., LeCouter, J., Yaspan, B. L. & Ye, W. Mechanisms of age-related macular degeneration and therapeutic opportunities. J. Pathol.232, 151–164 (2014). - PubMed
    1. Gorin, M. B. Genetic insights into age-related macular degeneration: controversies addressing risk, causality, and therapeutics. Mol. Asp. Med.33, 467–486 (2012). - PMC - PubMed
    1. Fritsche, L. G. et al. Seven new loci associated with age-related macular degeneration. Nat. Genet.45, 433–439 (2013). - PMC - PubMed

LinkOut - more resources