. 2024 Oct 28;15(1):9282.
doi: 10.1038/s41467-024-53395-y.

Phospho-signaling couples polar asymmetry and proteolysis within a membraneless microdomain in Caulobacter crescentus

Affiliations

Phospho-signaling couples polar asymmetry and proteolysis within a membraneless microdomain in Caulobacter crescentus

Yasin M Ahmed et al. Nat Commun. .

Abstract

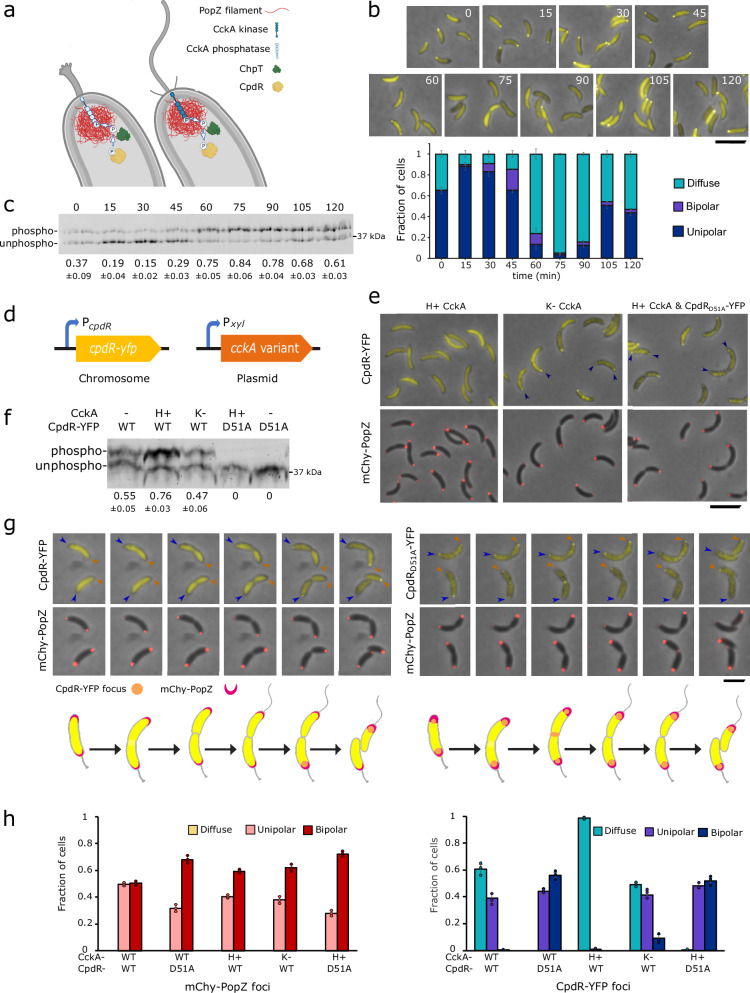
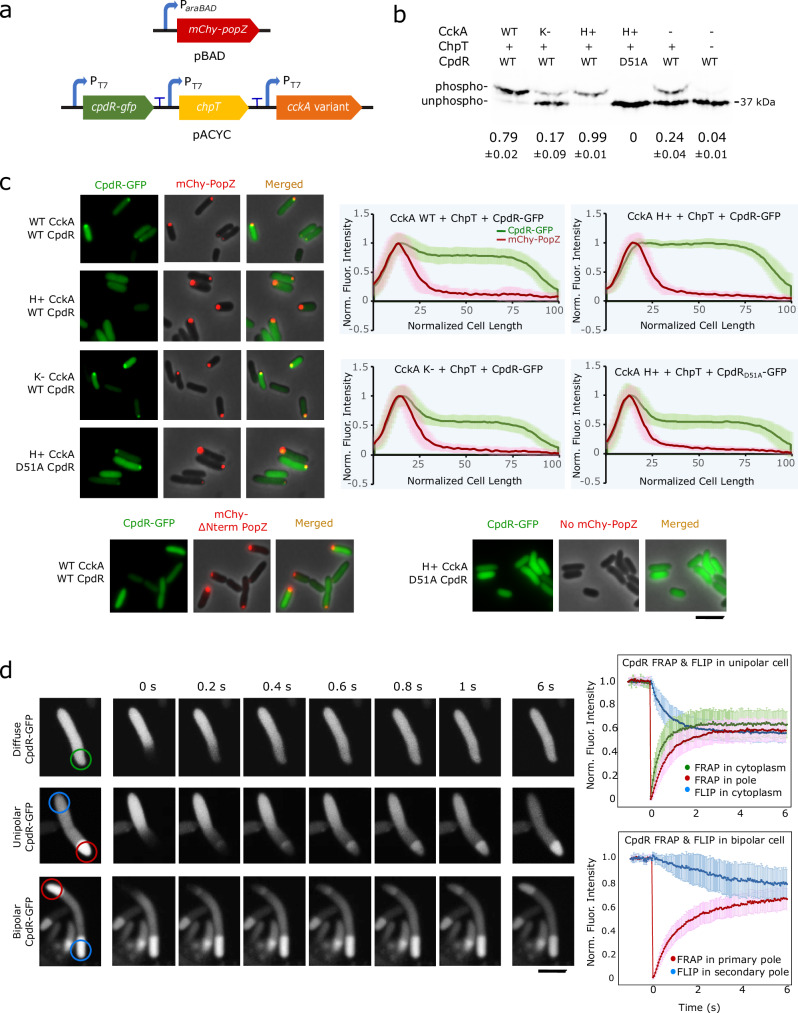
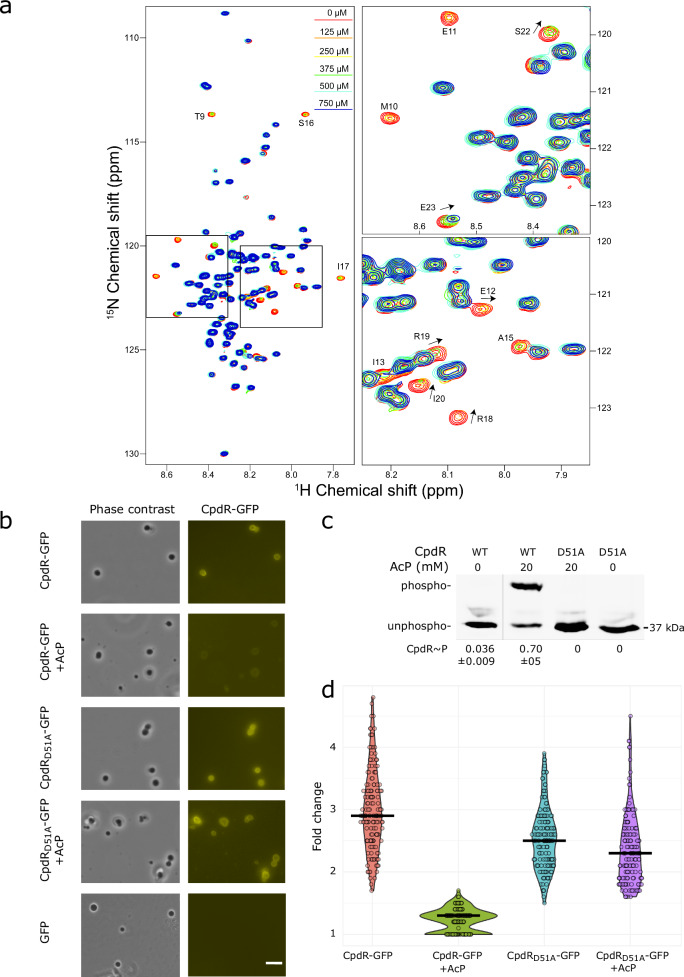
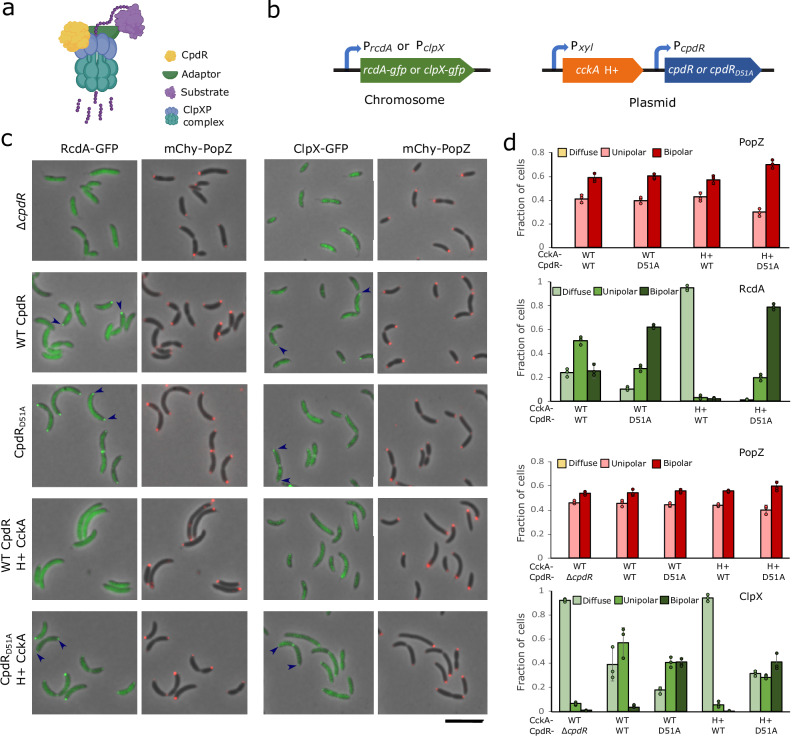
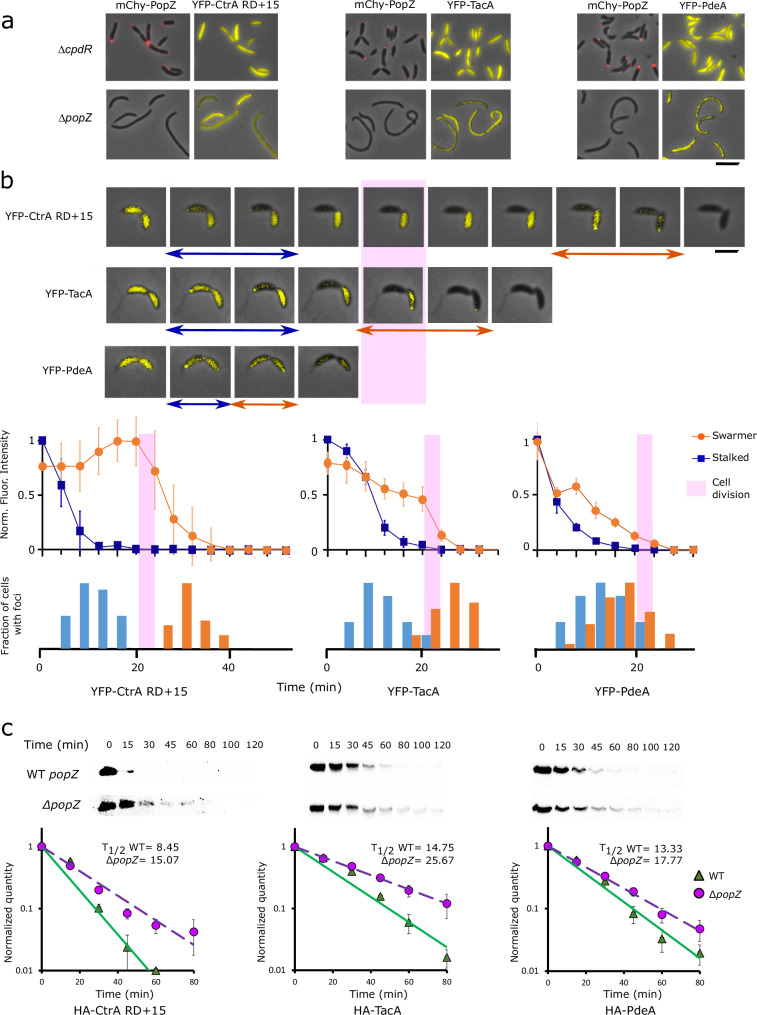
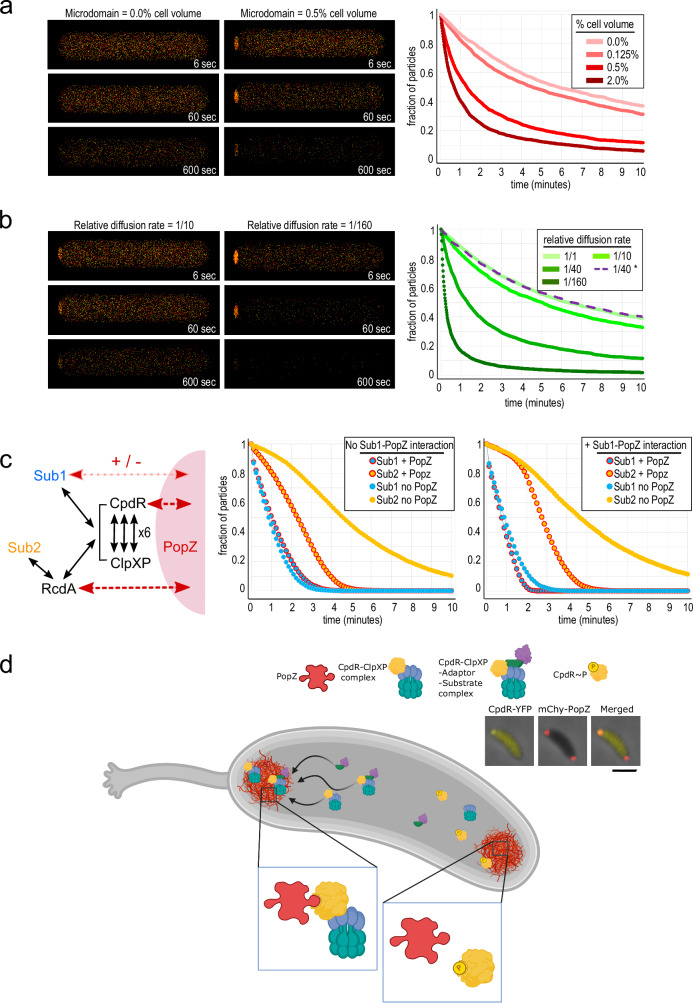
Asymmetric cell division in bacteria is achieved through cell polarization, where regulatory proteins are directed to specific cell poles. In Caulobacter crescentus, both poles contain a membraneless microdomain, established by the polar assembly hub PopZ, through most of the cell cycle, yet many PopZ clients are unipolar and transiently localized. We find that PopZ's interaction with the response regulator CpdR is controlled by phosphorylation, via the histidine kinase CckA. Phosphorylated CpdR does not interact with PopZ and is not localized to cell poles. At poles where CckA acts as a phosphatase, dephosphorylated CpdR binds directly with PopZ and subsequently recruits ClpX, substrates, and other members of a protease complex to the cell pole. We also find that co-recruitment of protease components and substrates to polar microdomains enhances their coordinated activity. This study connects phospho-signaling with polar assembly and the activity of a protease that triggers cell cycle progression and cell differentiation.


Conflict of interest statement

The authors declare no competing interests.

Figures

Fig. 1
Fig. 1. Correlations between CpdR’s phosphorylation state, polar localization, and co-localization with PopZ.
a CpdR phospho-signaling at stalked (left) and swarmer (right) cell poles, where CckA acts as a phosphatase or kinase, respectively. Graphics: BioRender. b C. crescentus cells expressing CpdR-YFP were synchronized and, at indicated time points over a cell cycle time course, aliquots were removed for observation. The plot shows the average frequencies of cells exhibiting zero, one, or two polar foci, and the error bar shows the range between the two biological replicates (n > 300/replicate/time point, scale bar = 5 μm). c CpdR-YFP phosphorylation levels in lysates from (b), observed by Phos-tag gel electrophoresis. The average intensities of the phosphorylated bands as a fraction of the sum of band intensities from both biological replicates are provided, along with the range between replicates. The replicate gel is provided in Supplementary Fig. 1a. d Genetic modifications for controlling CpdR-YFP phosphorylation. Single-copy cpdR-yfp is expressed from the native promoter, multicopy cckA variants are expressed from Pxyl without xylose induction. e Localization of CpdR-YFP or CpdRD51A-YFP and mChy-PopZ in different CckA signaling contexts. H+ and K− signify hyperactive kinase and kinase-deficient forms of CckA expressed from a multicopy plasmid, in addition to CckA expressed from the unmodified cckA locus. Arrowheads mark polar localization; scale bar = 5 μm. f CpdR-YFP phosphorylation levels in lysates from (e), observed using Phos-tag gel electrophoresis. The dash mark indicates no extrachromosomal copies of cckA. The average intensities of the phosphorylated bands as a fraction of the sum of band intensities from three biological replicates are provided, along with the standard deviation between replicates. Replicate gels are provided in Supplementary Fig. 1b. g Cells expressing CpdR-YFP or CpdRD51A-YFP and mChy-PopZ were observed during cell division, using time-lapse microscopy at 15 min intervals. The fluorescence levels of individual panels were adjusted differently to aid visualization. Scale bar = 2 μm; Graphics: BioRender. h Average frequencies of cells with diffuse, monopolar, and bipolar fluorescent foci, from strains imaged in (e, g) (n > 100/replicate, bar = standard deviation of three biological replicates). Source data and n values for (b, h) are provided as a Source Data file.
Fig. 2
Fig. 2. CpdR phosphorylation state influences CpdR-PopZ interactions in E. coli.
a Genes for reconstituting CpdR phosphorylation and PopZ interaction in E. coli. b CpdR-GFP phosphorylation levels in E. coli lysates, observed using Phos-tag gel electrophoresis. The average intensities of the phosphorylated bands as a fraction of the sum of band intensities from three biological replicates are provided, along with the standard deviation between replicates. Replicate gels are provided in Supplementary Fig. 2a. For CckA variants, WT = wildtype; H+ = hyperactive-kinase; K− = kinase-deficient. c mChy-PopZ and CpdR-GFP localization in E. coli cells. Normalized fluorescence intensities were plotted against cell length (n = 60, with 20 cells from 3 biological replicates. Lines trace mean value, shaded regions = SD). Scale bar = 5 μm. d FRAP and FLIP assay for CpdR-GFP in E. coli cells expressing PopZ. Recovery and loss of fluorescence were plotted against time in seconds (n = 20, Lines trace mean value, bar = standard deviation). Scale bar = 2 μm. Source data are provided as a Source Data file.
Fig. 3
Fig. 3. Direct interaction between CpdR and PopZ is inhibited by phosphorylation.
a Left: 1H-15N TROSY-HSQC NMR spectra overlay of 50 μM 15N-enriched PopZΔ134–177 with varying concentrations of CpdR-GFP: 0 μM (red), 125 μM (orange), 250 μM (yellow), 375 μM (green), 500 μM (cyan), and 750 μM (blue). Right: Enlarged regions highlight the changes observed with increasing CpdR-GFP concentration. Residues with the most significant perturbations are labeled, with arrows indicating the direction of the peak shift. b CpdR-GFP, CpdRD51A-GFP, or GFP alone was incubated with PopZ condensates. Phase contrast and YFP fluorescence channels are shown. +AcP = pre-incubation with acetyl phosphate. Scale bar = 10 μm. c CpdR-GFP phosphorylation levels in samples from (b), observed using Phos-tag gel electrophoresis. Figure panel shows a single gel from which irrelevant lanes are removed. The average intensities of the phosphorylated bands as a fraction of the sum of band intensities from 3 biological replicates are provided, along with the standard deviation between replicates. Replicate gels are provided in Supplementary Fig. 3a. d Ratios of the CpdR-GFP and CpdRD51A-GFP fluorescence intensities within condensates to outside condensates, imaged in YFP channel. Violin plot widths are proportional to the number of data points, bar shows population average. n = 150 condensates per sample (50 per biological replicate). Source data are provided as a Source Data file.
Fig. 4
Fig. 4. Correlations between CpdR phosphorylation state and the localization of protease components.
a Diagram of CpdR-mediated substrate degradation by ClpXP. Depending on the substrate, an additional adaptor (green) could be RcdA and/or PopA. Graphics: BioRender. b Genetic modifications for observing RcdA -GFP or ClpXP -GFP in different CpdR phosphorylation contexts, built in a ∆cpdR; popZ::mChy-popZ C. crescentus strain background. c Localization of RcdA-GFP or ClpX-GFP and mChy-PopZ in different CpdR phosphorylation contexts. Arrowheads mark polar localization; scale bar = 5 μm. d The average frequencies of cells with diffuse, monopolar, and bipolar fluorescent foci in (c) (n > 100/replicate, bar = standard deviation of 3 biological replicates). Source data and n values for (d) is provided as a Source Data file.
Fig. 5
Fig. 5. Polar localization of CpdR substrates is correlated with increased rate of degradation.
a Localization of YFP-tagged substrates in ∆cpdR; popZ::mChy-popZ and ∆popZ C. crescentus strain backgrounds. Scale bar = 5 μm. b Time-lapse images of YFP-tagged substrate localization in a WT C. crescentus background, at 4 min intervals. Blue arrows mark frames with foci in stalked cell, orange arrows mark frames with foci in swarmer cell. Pink bar idicates the time of cell separation. After accounting for photobleaching and temporally alignging the cells with respect to the time of cell separation, average fluorescence intensities for stalked and swarmer cell bodies, normalized to maximum fluorescence intensity, were plotted against time (line graphs, with error bars showing standard deviation, n = 20 cells). The fractions of cells ehxhibiting a polar focus, normalized to the highest value observed, were plotted on the same time axis (bar charts). Scale bar = 2 μm. c Degradation of HA-tagged proteolysis substrates following inducer wash-out, observed by western blotting with α-HA antibody. Average band intensities from three separate experiments were plotted against time (graphs, bar = standard deviation). Source data are provided as a Source Data file.
Fig. 6
Fig. 6. Conceptual models of substrate proteolysis in membraneless polar microdomains.
a, b Three-dimensional reaction-diffusion simulations with two types of particles, colored red and yellow, that disappear after colliding. Snapshots of cells from the indicated time during simulation are shown at left, and the number of particles remaining over time under different parameter conditions are shown at right. a Effect of varying the size of the polar microdomain while holding the particle diffusion rate at 1/40th the rate in bulk cytoplasm. b Effect of varying particle diffusion rates within polar microdomains while holding polar microdomain size at 0.5% of total cell volume, or of limiting polar concentration to only one reactant (dotted line). c A model of C. crescentus proteolysis that includes low-affinity interactions (black arrows) between substrates (Sub1 and Sub2), adaptors, and ClpXP protease, in which some proteins interact directly with PopZ (red arrows) and become concentrated in polar microdomains. Charts show the fractions of substrate particles remaining in simulations run with or without PopZ, either without (left) or with (right) a direct interaction between Sub1 and PopZ. d Localization of CpdR and associated ClpXP complexes as a consequence of asymmetric CckA signaling activity. Inset panels show fluorescence images of a C. crescentus stalked cell, where mChy-PopZ is localized to both poles and CpdR-YFP is localized to only the stalked pole. Scale bar = 10 μm. Source data are provided as a Source Data file. Graphics: BioRender.

Update of

References

    1. Poindexter, J. S. Biological properties and classification of the Caulobacter group. Bacteriol. Rev.28, 231–295 (1964). - DOI - PMC - PubMed
    1. Van Teeseling, M. C. F. & Thanbichler, M. Generating asymmetry in a changing environment: Cell cycle regulation in dimorphic alphaproteobacteria. Biol. Chem. 401, 1349–1363 (2020). - PubMed
    1. Aldridge, B. B. et al. Asymmetry and aging of mycobacterial cells lead to variable growth and antibiotic susceptibility. Science335, 100–104 (2012). - DOI - PMC - PubMed
    1. Lyons, N. A. & Kolter, R. On the evolution of bacterial multicellularity. Curr. Opin. Microbiol.24, 21–28 (2015). - PMC - PubMed
    1. Shapiro, L. & Losick, R. Protein localization and cell fate in bacteria. Science274, 712–718 (1997). - DOI - PubMed

Publication types

LinkOut - more resources