. 2024 Oct 28;15(1):9301.
doi: 10.1038/s41467-024-53590-x.

Conserved autism-associated genes tune social feeding behavior in C. elegans

Affiliations

Conserved autism-associated genes tune social feeding behavior in C. elegans

Mara H Cowen et al. Nat Commun. .

Abstract

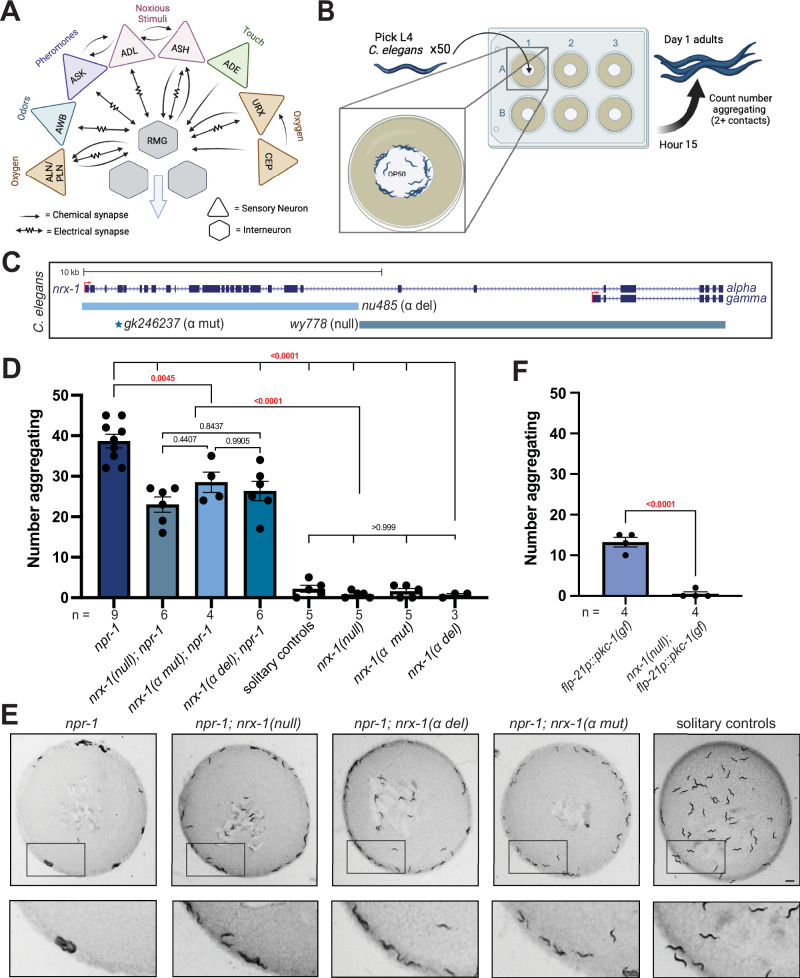
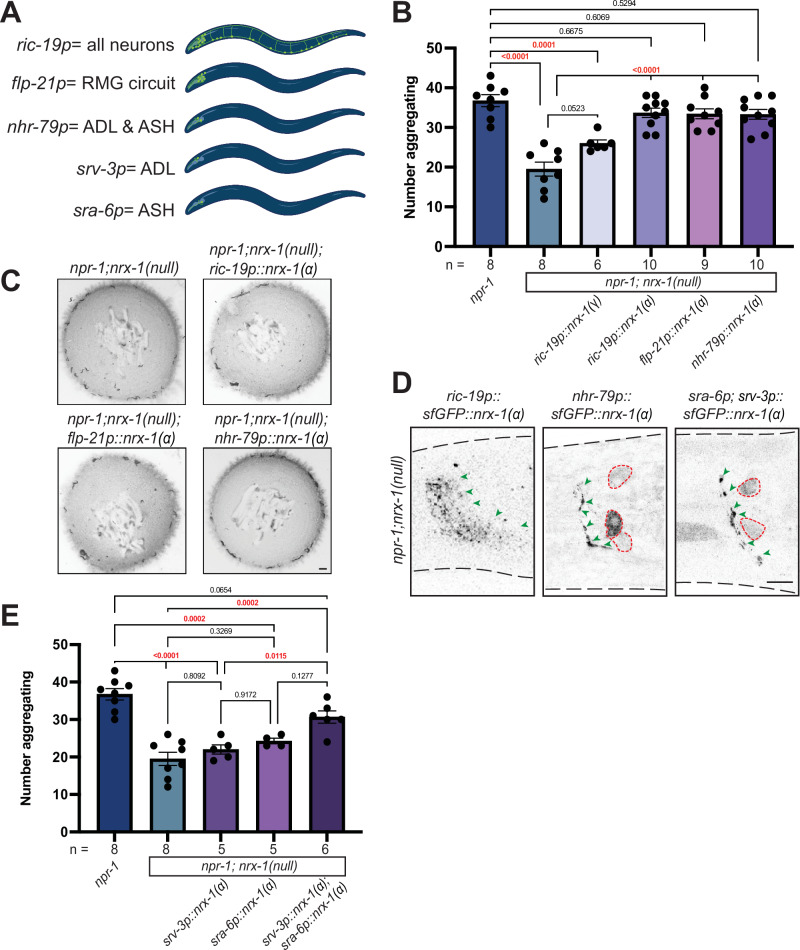
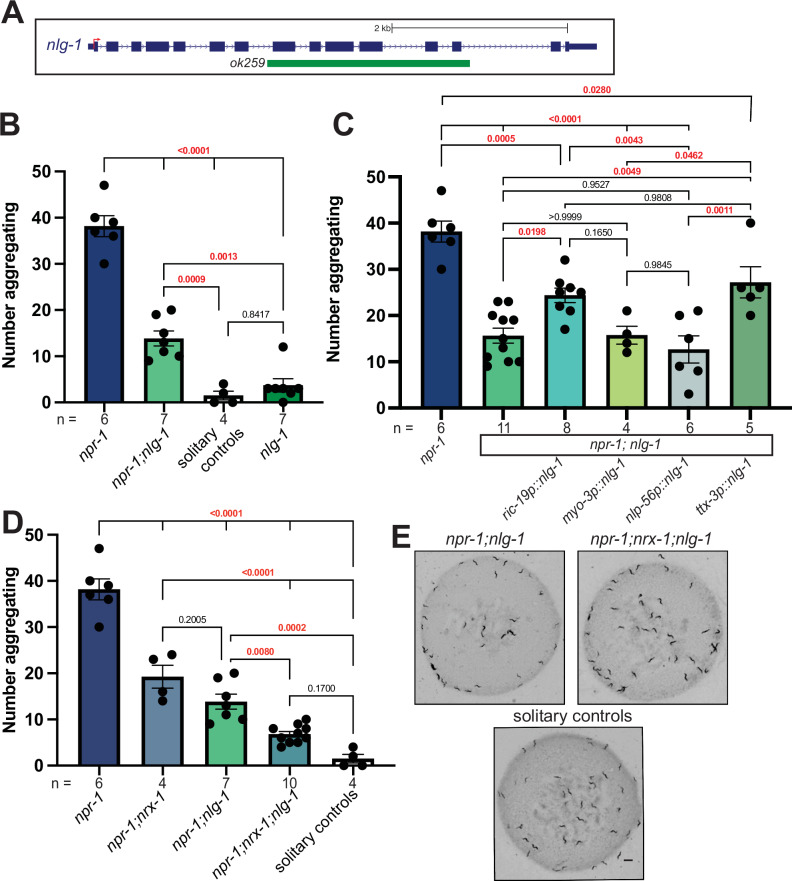
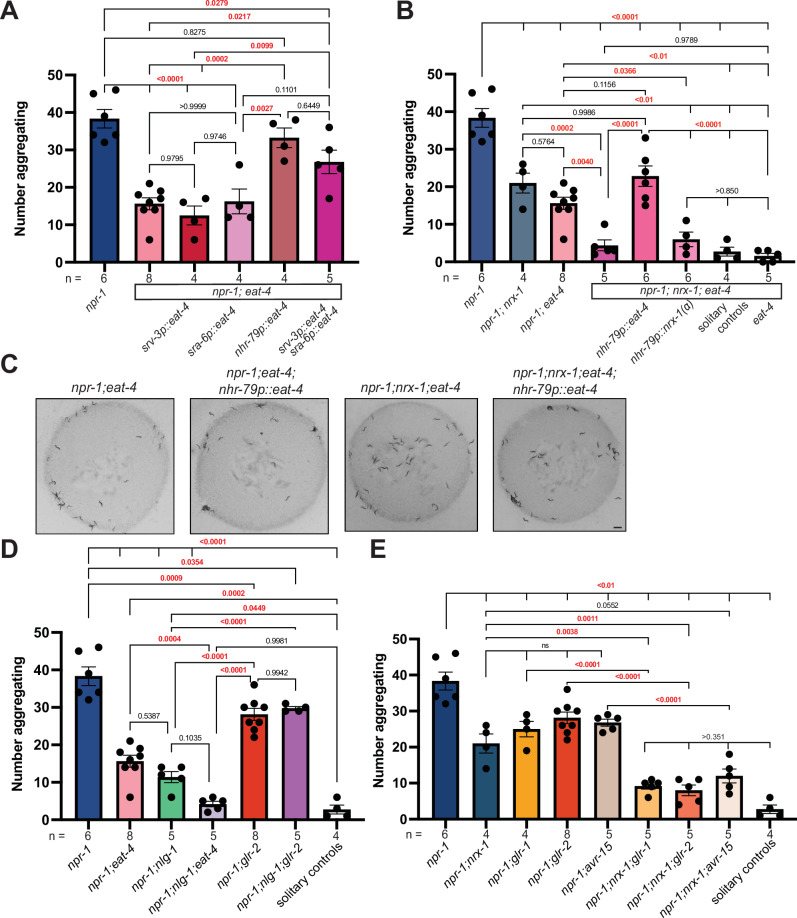
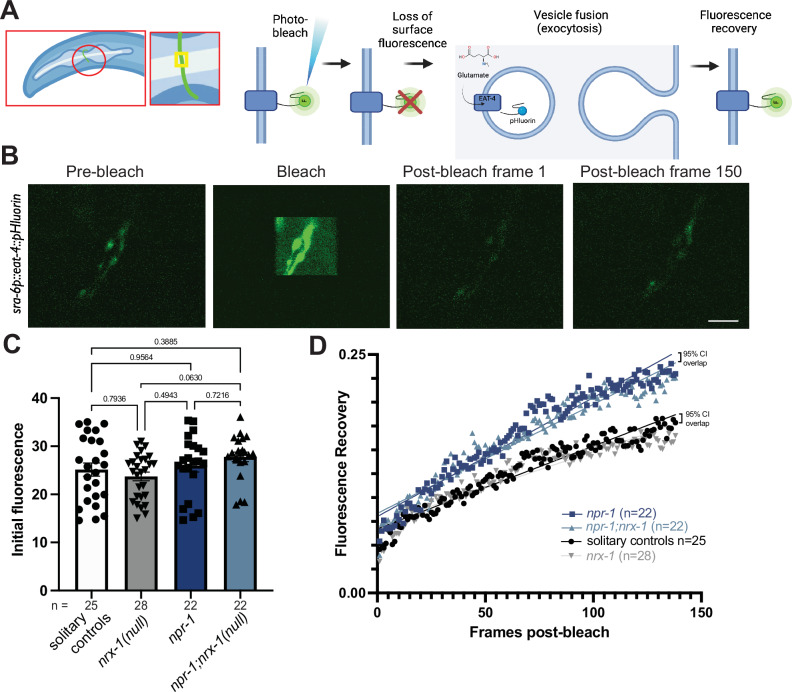
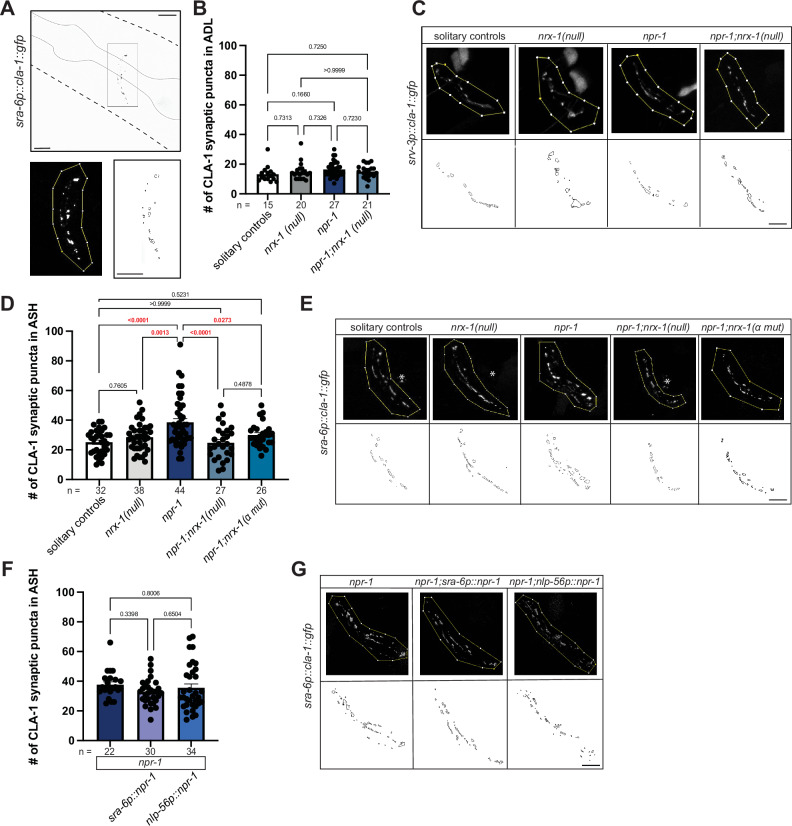
Animal foraging is an essential and evolutionarily conserved behavior that occurs in social and solitary contexts, but the underlying molecular pathways are not well defined. We discover that conserved autism-associated genes (NRXN1(nrx-1), NLGN3(nlg-1), GRIA1,2,3(glr-1), GRIA2(glr-2), and GLRA2,GABRA3(avr-15)) regulate aggregate feeding in C. elegans, a simple social behavior. NRX-1 functions in chemosensory neurons (ADL and ASH) independently of its postsynaptic partner NLG-1 to regulate social feeding. Glutamate from these neurons is also crucial for aggregate feeding, acting independently of NRX-1 and NLG-1. Compared to solitary counterparts, social animals show faster presynaptic release and more presynaptic release sites in ASH neurons, with only the latter requiring nrx-1. Disruption of these distinct signaling components additively converts behavior from social to solitary. Collectively, we find that aggregate feeding is tuned by conserved autism-associated genes through complementary synaptic mechanisms, revealing molecular principles driving social feeding.


Conflict of interest statement

The authors declare no competing interest.

Figures

Fig. 1
Fig. 1. NRX-1 is essential for aggregation behavior.
A Circuit diagram of sensory integration circuit. Connectome based on NemaNode and WormWiring data (Created in BioRender. Cowen, M. (2020) BioRender.com/g12s038). B Schematic of medium throughput aggregation behavior assay with 50 day 1 adult worms per well of a 6-well WormCamp imaged using WormWatcher platforms and scored for aggregation behavior defined as two or more animals in direct contact (Created in BioRender. Hart, M. (2023) BioRender.com/b48j541). C Schematic of C. elegans nrx-1 gene showing mutant alleles used and isoforms removed by functional null and α-isoform specific mutants. D Graph showing the number of aggregating animals in various genetic backgrounds. All mutant nrx-1 alleles (wy778=nrx-1 null, gk246237=nrx-1 α mut, nu485=nrx-1 α del) show decreased aggregation behavior. E Representative images of aggregation behavior in npr-1(ad609), npr-1(ad609);nrx-1(wy778), npr-1(ad609);nrx-1(nu485), npr-1(ad609);nrx-1(gk246237) mutants, and solitary controls (Scale bar = 1 mm). F Graph showing the number of aggregating animals in flp-21p::pkc-1(gf) strain compared to flp-21p::pkc-1(gf);nrx-1(wy778). The number of biological replicates (n) are displayed in the figure, bars show the mean number of aggregating C. elegans, error bars indicate SEM. One-way ANOVA with Tukey’s post-hoc test was used for comparisons (t test for panel F), exact p-values are shown on graphs (red indicates significance, black indicates non-significance). Source data are provided in the Source Data file.
Fig. 2
Fig. 2. NRX-1(α) acts in ADL and ASH sensory neurons for aggregate feeding.
A Schematics showing the neurons where each promoter is expressed. ric-19p expresses in all neurons, flp-21p expresses in several sensory neurons and RMG interneurons, nhr-79p expresses in ADL and ASH sensory neurons, srv-3p expresses in ADL neurons, and sra-6p expresses in ASH neurons (Created in BioRender. Hart, M. (2023) BioRender.com/w06b193). Graph showing number of aggregating animals (B) and representative images of aggregation behavior assay plates (C) in npr-1(ad609);nrx-1(null) mutants with NRX-1(α) driven by ric-19, flp-21, and nhr-79 promoters, and NRX-1(γ) driven by the ric-19 promoter, and controls (Scale bar = 1 mm). D Confocal image of NRX-1(α) expression in all neurons (ric-19p::sfGFP::nrx-1), ADL and ASH neurons (nhr-79p::sfGFP::nrx-1), and ADL and ASH neurons (sra-6p::sfGFP::nrx-1 & srv-3p::sfGFP::nrx-1). Green arrows indicate NRX-1 axonal expression. Red dashed lines show cell bodies. ric-19p::sfGFP::nrx-1(α) imaging performed in nrx-1(wy778) (Scale bar = 10 μm). E Graph showing the number of aggregating animals in various genetic backgrounds. Data for npr-1 and npr-1;nrx-1 are plotted in both 2B and 2E. The number of biological replicates (n) are displayed in the figure, bars show the mean number of aggregating C. elegans, and error bars indicate SEM. One-way ANOVA with Tukey’s post-hoc test was used for comparisons, exact p-values are shown on graphs (red indicates significance, black indicates non-significance). Source data are provided in the Source Data file.
Fig. 3
Fig. 3. NLG-1 contributes independent of NRX-1 in aggregation behavior.
A Schematic of C. elegans nlg-1 gene showing the deletion allele assessed. B Graph showing number of aggregating animals in npr-1(ad609), npr-1(ad609);nlg-1(ok259), nlg-1(ok529), and solitary controls. nlg-1 deletion decreased aggregation behavior in npr-1 animals. C Graph showing number of aggregating animals in npr-1(ad609);nlg-1(ok259) mutants with NLG-1 driven by ric-19, myo-3, nlp-56, and ttx-3 promoters and controls. ric-19p expresses in all neurons, myo-3p expresses in muscles, nlp-56p expresses in RMG neurons, and ttx-3p expresses in AIY neurons. D Graph showing number of aggregating animals in npr-1(ad609), npr-1(ad609);nrx-1(wy778), npr-1(ad609);nlg-1(ok259), npr-1(ad609);nrx-1(wy778);nlg-1(ok259), and solitary controls. E Representative images of aggregation behavior in npr-1(ad609);nlg-1(ok259), npr-1(ad609);nrx-1(wy778); nlg-1(ok259) and solitary controls (Scale bar = 1 mm). Data for npr-1 and npr-1;nlg-1 are plotted in 3B, 3C, and 3D. Data for solitary controls are plotted in 3B and 3C. The number of biological replicates (n) are displayed in the figure by order and color, bars show the mean number of aggregating C. elegans, and error bars indicate SEM. One-way ANOVA with Tukey’s post-hoc test was used for comparisons, exact p-values are shown on graphs (red indicates significance, black indicates non-significance). Source data are provided in the Source Data file.
Fig. 4
Fig. 4. Aggregation behavior depends on glutamate signaling from ADL and ASH neurons.
A Graph showing number of aggregating animals in npr-1(ad609) compared to npr-1;eat-4(ky5) mutants and number of aggregating animals in npr-1(ad609);eat-4(ky5) mutants with EAT-4 driven by srv-3, sra-6, nhr-79, and srv-3/sra-6 combined promoters. B Graph showing number of aggregating animals in npr-1(ad609), npr-1(ad609);nrx-1(wy778), npr-1(ad609);eat-4(ky5), npr-1(ad609);nrx-1(wy778);eat-4(ky5) mutants. Graph also includes npr-1(ad609);nrx-1(wy778);eat-4(ky5) mutants with EAT-4 driven under the nhr-79 promoter, npr-1(ad609);nrx-1(wy778);eat-4(ky5) mutants with NRX-1(α) driven under the nhr-79 promoter, and solitary controls. C Representative images of aggregation behavior in npr-1(ad609);eat-4(ky5), npr-1(ad609);eat-4(ky5); nhr-79p::eat-4, npr-1(ad609);nrx-1(wy778);eat-4(ky5), and npr-1(ad609);nrx-1(wy778);eat-4(ky5); nhr-79p::eat-4 animals (Scale bar = 1 mm). D Graph showing number of aggregating worms in npr-1(ad609), npr-1(ad609);eat-4(ky5), npr-1(ad609);nlg-1(ok259), npr-1(ad609);nlg-1(ok259);eat-4(ky5), npr-1(ad609);glr-2(ok2342), npr-1(ad609);nlg-1(ok259);glr-2(ok2342) mutants, and solitary controls. E Graph showing number of aggregating animals in npr-1(ad609), npr-1(ad609);nrx-1(wy778), npr-1(ad609);glr-1(n2461), npr-1(ad609);glr-2(ok2342), npr-1(ad609);avr-15(ad1051), npr-1(ad609);nrx-1(wy778);glr-1(n2461), npr-1(ad609);nrx-1(wy778); glr-2(ok2342), and npr-1(ad609);nrx-1(wy778);avr-15(ad1051) mutants. Data for npr-1 and npr-1;eat-4 are plotted in 4 A, 4B, and 4D. Data for npr-1;nrx-1 are plotted in 4B and 4E. Data for solitary controls are plotted in 4B, 4D, and 4E. The number of biological replicates (n) are displayed in the figure, bars show the mean number of aggregating C. elegans, and error bars indicate SEM. One-way ANOVA with Tukey’s post-hoc test was used for comparisons, exact p-values are shown on graphs (red indicates significance, black indicates non-significance). Source data are provided in the Source Data file.
Fig. 5
Fig. 5. Glutamate release is faster in aggregating C. elegans, independent of NRX-1.
A Schematic of sra-6p::eat-4::pHluorin experiment, including a schematic of a small neuron section bleached and EAT-4::pHluorin photobleaching and recovery process (Created in BioRender. Hart, M. (2022) BioRender.com/q97a726). B Representative images of ASH neurons prior to bleaching (pre-bleach), during bleach, immediately following bleach, and after a recovery period of two minutes (Scale bar = 5 μm). C Graph showing initial fluorescence values taken from first 10 pre-bleach frames of FRAP experiments. Bars show the mean initial fluorescence, error bars indicate SEM. One-way ANOVA with Tukey’s post-hoc test was used for comparisons, exact p-values are shown on graphs (red indicates significance, black indicates non-significance). D Graph of post-bleach recovery as a fraction of initial fluorescence by post-bleach frame up to frame 138 (120 s, frame taken every 0.87 s). A straight line is fit with a non-linear regression. Points on the graph are the genotype mean of all replicates at each post-bleach frame. The null hypothesis (slope same for all data sets) was rejected with p < 0.0001. 95% confidence intervals of the slope are not significantly different between npr-1 vs. npr-1;nrx-1 ([0.001175 to 0.001322], [0.001082 to 0.001206]) or solitary control vs. nrx-1 ([0.0008085 to 0.000926], [0.0007136 to 0.0008126]), represented on the graph as 95% confidence intervals (CI) overlap. 95% confidence intervals of the slope are significantly different between solitary control vs. npr-1 ([0.0008085 to 0.000926], [0.001175 to 0.001322]), solitary control vs. npr-1;nrx-1 ([0.0008085 to 0.000926], [0.001082 to 0.001206]), nrx-1 vs. npr-1 ([0.0007136 to 0.0008126], [0.001175 to 0.001322]), and nrx-1 vs. npr-1;nrx-1 ([0.0007136 to 0.0008126], [0.001082 to 0.001206]). The number of biological replicates (n) are displayed in the figure and performed on at least 3 separate days. Source data are provided in the Source Data file.
Fig. 6
Fig. 6. Higher number of ASH pre-synaptic puncta in aggregating C. elegans depends on nrx-1.
A Confocal micrograph of sra-6p::cla-1::gfp construct with pharynx outlined included as method schematic. Region of interests (ROI) in which counts were performed and puncta outlines generated by FIJI. Soma and projections outside of the nerve ring were not included in ROIs (Scale bar = 10 μm). Graph showing number (B) and representative images (Scale bars = 10 μm) (C) of srv-3p::cla-1::gfp puncta in ADL in solitary controls, nrx-1(wy778), npr-1(ad609), and npr-1(ad609);nrx-1(wy778) mutants. Graph showing number (D) and representative images (Scale bar = 10 μm) (E) of sra-6p::cla-1::gfp puncta in ASH in solitary controls, nrx-1(wy778), npr-1(ad609), npr-1(ad609);nrx-1(wy778) mutants, and npr-1(ad609);nrx-1(gk246237) mutants. White asterisks indicate ASH cell body GFP expression and not synaptic puncta. Graph showing number (F) and representative images (Scale bar = 10 μm) (G) of sra-6p::cla-1::gfp puncta in ASH in npr-1(ad609), npr-1(ad609); sra-6p::npr-1 (ASH), and npr-1(ad609); nlp-56p::npr-1 (RMG). The number of biological replicates (n) are displayed in the figure, bars show the mean number of puncta, and error bars indicate SEM. One-way ANOVA with Tukey’s post-hoc test was used for comparisons, exact p-values are shown on graphs (red indicates significance, black indicates non-significance). Source data are provided in the Source Data file.

Update of

References

    1. Hamilton, W. D. The genetical evolution of social behaviour. I. J. Theor. Biol.7, 1–16 (1964). - PubMed
    1. Chen, P. & Hong, W. Neural circuit mechanisms of social behavior. Neuron98, 16–30 (2018). - PMC - PubMed
    1. Davidson, J. D., Arauco-Aliaga, R. P., Crow, S., Gordon, D. M. & Goldman, M. S. Effect of interactions between harvester ants on forager decisions. Front. Ecol. Evol. 4, 115 (2016). - PMC - PubMed
    1. Gordon D. M. Ant Encounters: Interaction Networks and Colony Behavior. In: Ant Encounters. Princeton (University Press, 2010).
    1. Azorsa, F., Muscedere, M. L. & Traniello, J. F. A. Socioecology and evolutionary neurobiology of predatory ants. Front. Ecol. Evol. 9, 10.3389/fevo.2021.804200 (2022).

Publication types

MeSH terms