. 2024 Oct 28;15(1):9300.
doi: 10.1038/s41467-024-53532-7.

Chromatic covalent organic frameworks enabling in-vivo chemical tomography

Affiliations

Chromatic covalent organic frameworks enabling in-vivo chemical tomography

Song Wang et al. Nat Commun. .

Abstract

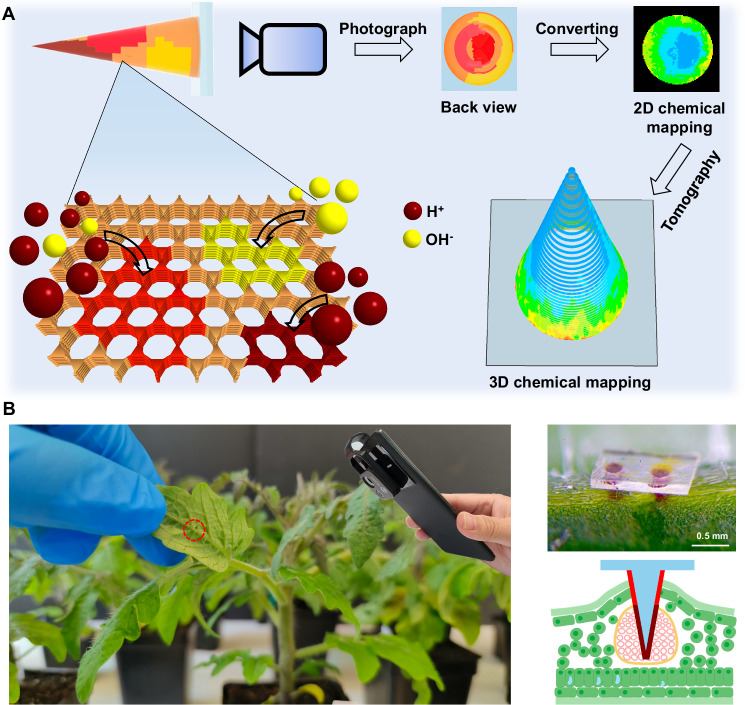
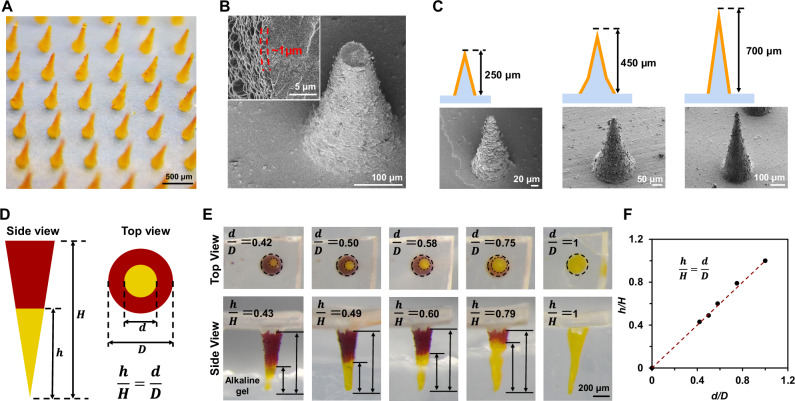
Covalent organic frameworks designed as chromatic sensors offer opportunities to probe biological interfaces, particularly when combined with biocompatible matrices. Particularly compelling is the prospect of chemical tomography - or the 3D spatial mapping of chemical detail within the complex environment of living systems. Herein, we demonstrate a chromic Covalent Organic Framework (COF) integrated within silk fibroin (SF) microneedles that probe plant vasculature, sense the alkalization of vascular fluid as a biomarker for drought stress, and provide a 3D in-vivo mapping of chemical gradients using smartphone technology. A series of Schiff base COFs with tunable pKa ranging from 5.6 to 7.6 enable conical, optically transparent SF microneedles with COF coatings of 120 to 950 nm to probe vascular fluid and the surrounding tissues of tobacco and tomato plants. The conical design allows for 3D mapping of the chemical environment (such as pH) at standoff distances from the plant, enabling in-vivo chemical tomography. Chromatic COF sensors of this type will enable multidimensional chemical mapping of previously inaccessible and complex environments.


Conflict of interest statement

The authors declare no competing interests.

Figures

Fig. 1
Fig. 1. Schematic of the use of chromic covalent organic framework-silk microneedle for microtomographic mapping of physiological chemical.
A The microneedles are designed to reach the bio tissue and the colorimetric COF immobilized on the surface of the microneedles provides a readout of the physiological pH, which can be read with a smartphone camera given the transparency of the silk microneedles. pH distribution in plant tissue can be obtained by converting the color mapping of microneedle to pH mapping, and then to 3D pH mapping via tomography technology. B Photos and illustrations (Created in BioRender. Marelli (2023) BioRender.com/p01y968) of the microneedles injected into the leaf midrib of a 6 week old tomato plant for pH monitoring of vascular sap.
Fig. 2
Fig. 2. Chromatic COF structures and their thickness control.
A Structures of TAPP-TFPA, TAPA-TFPA, TAPB-TFPP and TAPP-DMTA and their monomers. B Photos of TAPP-DMTA, TAPP-TFPA, TAPB-TFPA and TAPA-TFPP powders dispersed in buffers at different pH values. C Reflection spectrum of TAPP-TFPA powders treated by different pH buffers. D ΔE and relative reflection intensity change at 523 nm of TAPP-TFPA powder varies with pH value and relative pKa = 6.6 curve (fitted according to Henderson-Hasselbalch equation). E Experimental and predicated pKa of different COFs. Predicated pKa is obtained according to simulated proton affinity in water medium. F Density functional theory (DFT) optimized molecular structures and highest occupied molecular orbitals (HOMOs) of unprotonated and protonated TAPP-TFPA repeat unit. G Illustrations of homogeneous nucleation limitation strategy. H Relationship of film thickness and particles density for TAPP-TFPA. I Photos and UV-Vis absorption spectrums of TAPP-TFPA films with different thickness on PET substrates treated with pH 5.0 buffer.
Fig. 3
Fig. 3. Fabrication and characterizations of COF-silk microneedles.
A Optical microscope image of TSMN700. B SEM images of tip-broken TSMN700 that depict the TAPP-TFPA outer layer. C Illustrations and SEM images of TSMN250, TSMN450, and TSMN700. D Relative height (defined as the ratio between the length of the segment that depicted a color change (h) and total length (H)) is equal to the relative diameter (defined as the ratio between the diameter of the color changed inner circle (d) and the total diameter (D)) observed from a top view. (E) Top and side views of TSMN700 inserted into a transparent alkaline gel. TSMN700 was pretreated with pH = 4.5 buffer. Alkaline gel has a pH of 9.0. F Relative diameter and relative height of color changed microneedle part presents a linear relationship. In AC, E images are representative of at least three independent experiments.
Fig. 4
Fig. 4. In situ detection of exogenous pH change in plants by microneedles.
A Mechanical behavior of single TSMN700 microneedle under compressive force and its penetration into a tobacco midrib under compressive load. B Digital photo (left) of a tobacco leaf after injecting two TSMN700 microneedles at the end of vein for 4 days. TSMN700 microneedle before and after the injection (top right) and optical microscope image of tobacco vein after removing the TSMN700 (bottom right). C Nitrogen balance index (NBI) measured in tobacco leaves injected by a TSMN700 to monitor its health while carrying the microneedle up to day 15. Five different leaf points were measured. D Illustrations (Created in BioRender. Marelli (2023) BioRender.com/p01y968) of color change of TSMN700, TSMN450 and TSMN250 in the midrib of a tobacco leaf after absorbing alkaline buffer. E Digital photo (top left) and optical microscope images from the top view of TSMN700 injected in the midrib of tobacco leaf, and relative pH mapping images obtained according to the calibration of TAPP-TFPA in different pH buffer. The leaf was cut off and its petiole was submerged into pH = 9.5 buffer at 0 min and pH = 4.5 buffer at 30 min subsequently. F pH mappings obtained from optical microscope images of TSMN450 and TSMN250 injected in the midrib of tobacco leaves. Leaves were cut and their petioles were submerged into pH = 9.5 buffer at 0 min. G Digital photo (top left) and pH mappings obtained from optical microscope images of TSMN700 injected in the midrib of tobacco leaves. The whole plant was kept intact and its roots were first submerged into pH = 8.0 buffer and moved in a pH = 4.5 buffer after 2 h. In B, EG images are representative of three independent experiments.
Fig. 5
Fig. 5. Tomographic chemical imaging of living tomato plants undergoing drought stress.
A Water content of soil (Data are means ± SD from four individual samples). At day 1, regular watering was halted causing a decay in soil water content over 6 days. BD Stress markers of including flavonoid absorption (B) did not show difference during the 6 days (n = 7). And NBI (C) show deflections starting on day 6, confirming the induction of a water stress state (n = 7). Data are means ± SD from seven individual leaf tests. Photographic evidence (D) also corroborates the water stress state at day 6 with slightly yellowing. E The sensing COF microneedle interface is imaged in the tomato leaf midrib stained with toluidine blue showing before (top) and after (down) injection at the abaxial side. The blue circle indicates the vasculature zone and dashed red triangle indicates the point of microneedle injection. Images are representative of three independent experiments. F Data collection from the TSMN700 sensor injected into the midrib of a tomato leaf was from a smartphone camera at periodic time points after day 1. G pH of vascular saps measured by inner circle color difference against outer circle for TSNM700 injected into the midrib of tomato leaves at different time points, after day 1. Data are means ± SD from four individual leaf tests. H In-Vivo chemical tomographic images in the form of depth-orientational angle pH maps. I Alternative depiction of maps onto the 3D conical profile of the COF microneedle sensor interface. In B, C, and G data are shown as boxplots of the number of indicated samples displaying the maximum and minimum, first and third quantiles, and the median. In B, C, and G data are analyzed by one-way ANOVA followed by the Tukey test and the P values were shown. Source data are provided as a Source Data file.

Similar articles

Cited by

References

    1. Cote, A. P. et al. Porous, crystalline, covalent organic frameworks. Science310, 1166–1170 (2005). - PubMed
    1. Feng, X., Ding, X. & Jiang, D. Covalent organic frameworks. Chem. Soc. Rev.41, 6010–6022 (2012). - PubMed
    1. Ding, S.-Y. & Wang, W. Covalent organic frameworks (COFs): from design to applications. Chem. Soc. Rev.42, 548–568 (2013). - PubMed
    1. Guan, X. et al. Chemically stable polyarylether-based covalent organic frameworks. Nat. Chem.11, 587–594 (2019). - PubMed
    1. Wang, S. et al. Single-crystal 2D covalent organic frameworks for plant biotechnology. J. Am. Chem. Soc.145, 12155–12163 (2023). - PubMed

Publication types

LinkOut - more resources