. 2024 Oct 28;9(1):32.
doi: 10.1038/s41536-024-00376-w.

Regeneration-specific promoter switching facilitates Mest expression in the mouse digit tip to modulate neutrophil response

Affiliations

Regeneration-specific promoter switching facilitates Mest expression in the mouse digit tip to modulate neutrophil response

Vivian Jou et al. NPJ Regen Med. .

Abstract

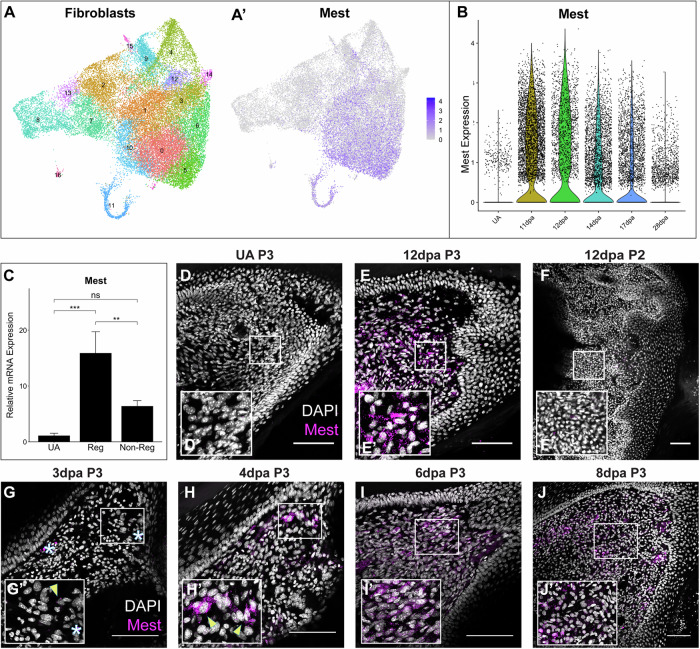
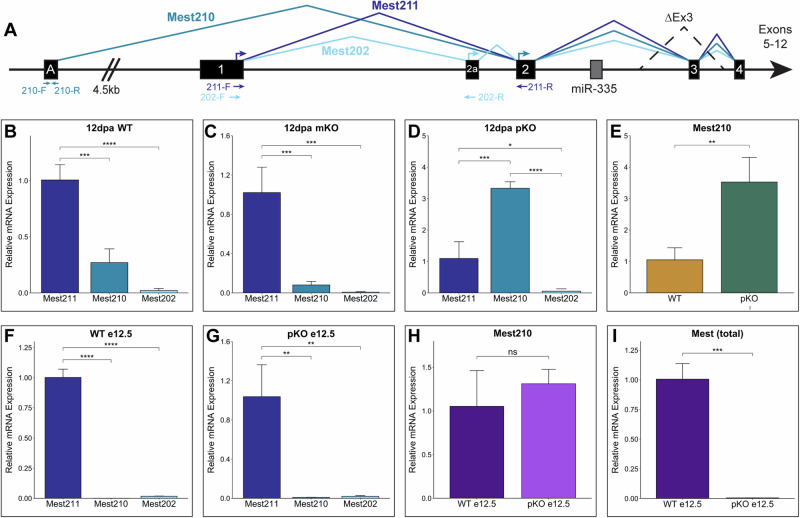
The mouse digit tip regenerates following amputation, a process mediated by a cellularly heterogeneous blastema. We previously found the gene Mest to be highly expressed in mesenchymal cells of the blastema and a strong candidate pro-regenerative gene. We now show Mest digit expression is regeneration-specific and not upregulated in post-amputation fibrosing proximal digits. Mest homozygous knockout mice exhibit delayed bone regeneration though no phenotype is found in paternal knockout mice, inconsistent with the defined maternal genomic imprinting of Mest. We demonstrate that promoter switching, not loss of imprinting, regulates biallelic Mest expression in the blastema and does not occur during embryogenesis, indicating a regeneration-specific mechanism. Requirement for Mest expression is tied to modulating neutrophil response, as revealed by scRNAseq and FACS comparing wildtype and knockout blastemas. Collectively, the imprinted gene Mest is required for proper digit tip regeneration and its blastema expression is facilitated by promoter switching for biallelic expression.


Conflict of interest statement

The authors declare no competing interests.

Figures

Fig. 1
Fig. 1. Mest is a candidate pro-regenerative factor.
A UMAP plots of all-stages-integrated fibroblasts from the P3 digit showing Seurat clustering (A) and Mest expression (A’). B Violin plot of Mest expression in unamputated (UA), 11, 12, 14, 17, and 28 dpa digit tip fibroblasts by scRNAseq. C qPCR analysis of Mest expression in UA distal digit, 12 dpa regenerating P3 digit, and 12 dpa non-regenerating P2 digit. Error bars depict standard deviation; (**) p < 0.01, (***) p < 0.001, ns not significant. DJ Mest RNA expression (magenta) counterstained with DAPI (grayscale) HCR-FISH stains for UA (D) and regenerating P3 digit tip (E, GJ) and non-regenerative P2 proximal digit (F). White boxes show locations of inset panels (D’ - J’); all scale bars = 100 µm. Yellow arrowheads denote example Mest expression; white asterisks denote autofluorescence.
Fig. 2
Fig. 2. No Mest-induced in vitro MSC multipotency.
A SPRING plot of the integrated scRNAseq fibroblasts, (A) colored by Seurat clusters, (A’) time point, and (A”) Mest expression in green; MSK musculoskeletal; CT connective tissue. BD Oil Red O staining of (B) pCAG-GFP C3H10T1/2, (C) pCAG-GFP MC3T3, and (D) pCAG-Mest MC3T3 cells at 12 dpi. E Quantification of extracted Oil Red O from 12 dpi stained MC3T3 cells in (C) and (D). F, G Adipogenesis qPCR analysis of (F) Perilipin-1 and (G) PPARγ genes in GFP (gray) and Mest (black) transfected MC3T3 cells at 1, 7, and 12 dpi. HJ Alcian Blue staining of (H) pCAG-GFP C3H10T1/2, (I) pCAG-GFP MC3T3, and (J) pCAG-Mest MC3T3 cells at 21 dpi. K Quantification of Alcian Blue stain extracted from 21 dpi stained MC3T3 cells in (I) and (J). L, M Chondrogenesis qPCR analysis of (L) Col2a1 and (M) Col10a1 genes in GFP and Mest transfected MC3T3 cells at 7, 14, and 21 dpi. Error bars depict standard deviation. Statistical comparisons are shown for those discussed in text; (**) p < 0.01, (***) p < 0.001, (****) p < 0.0001, ns not significant. Scale bars in images (BD) = 100 µm, scale bars in images (HJ) = 250 µm.
Fig. 3
Fig. 3. Mest promotes osteogenesis.
A, B Alizarin Red staining of (A) pCAG-GFP and (B) pCAG-Mest transfected C3H10T1/2 cells at 28 dpi. C Quantification of Alizarin Red stained C3H10T1/2 cells at 28 dpi in Fiji. D qPCR analysis of osteogenic marker Runx2 in GFP (gray) and Mest (black) transfected cells at 7, 14, and 21 dpi. Statistical comparisons are shown for those discussed in text. EH Representative 12 dpa Masson trichrome stained digit sections of (E) Mest-WT, (F) mKO, (G) pKO, and (H) KO mice. IL Representative whole-mount Alizarin Red staining of (I) Mest-WT, (J) mKO, (K) pKO, and (L) KO 28 dpa digits. M, N Box plots with individual data points shown of the percent area regenerated (M) and percent length regenerated of P3 bone (N) for Mest-WT, mKO, pKO, and KO 28 dpa Alizarin Red stained digits. Percent bone regeneration was calculated as area of each P3 digit/average area of unamputated digits for that respective genotype. OR Representative whole-mount Alizarin Red staining of (O) Mest-WT, (P) mKO, (Q) pKO, and (R) KO 56 dpa digits. S, T Box plots with individual data points shown of (S) the percent area regenerated and (T) percent length regenerated of P3 bone for Mest-WT, mKO, pKO, and KO 56 dpa Alizarin Red stained digits. Error bars depict standard deviation; (*) p < 0.05, (**) p < 0.01, (***) p < 0.001, (****) p < 0.0001, ns not significant. Scale bars in images (A) and (B) = 250 µm, all other scale bars = 100 µm.
Fig. 4
Fig. 4. Genomic imprinting of Mest persists in the blastema.
A Schematic of the Mest genomic locus with exons as black boxes with exon number labeled in white; ΔEx3 denotes Mest-KO deletion. DMR (differentially methylated region) (gray circles); CTCF element (white box); miR335 (microRNA-335) (dark gray box); black bars denote regions of bisulfite sequencing. Location of Mest qPCR primers is shown with black arrows. B microRNA-335-5p qPCR analysis in Mest-WT, mKO, pKO, and KO 12 dpa blastemas. C Mest qPCR in Mest-WT, mKO, pKO, and KO 12 dpa blastemas. DK Dot plots of bisulfite sequencing observed:predicted cytosine ratios for CTCF, ExonA, and Exon1 PCR amplicons shown in (A); each dot represents ratio for one sequenced clone. A ratio of 1 is fully methylated and a ratio of 0 is not methylated. D, F, H, J Bisulfite sequencing clones from embryonic e12.5 hindlimb Mest-WT and pKO DNA. E, G, I, K Bisulfite sequencing clones from 12 dpa blastemas of Mest-WT, mKO, pKO and KO mice. Error bars depict standard deviation; (*) p < 0.05, (**) p < 0.01, (***) p < 0.001, (****) p < 0.0001, ns not significant.
Fig. 5
Fig. 5. Biallelic expression of Mest via promoter switching.
A Schematic of Mest locus with three annotated transcript variants: Mest211 (NM_008590; dark blue), Mest210 (NM_001252293; blue), and Mest202 (NM_001252292; light blue). Position of transcript-specific qPCR primers shown with arrows of their respective colors below the schematic and arrows depicting translation start sites are above the exons. BD Relative expression levels of each variant by qPCR analysis in (B) Mest-WT, (C) mKO, and (D) pKO 12 dpa blastemas. E qPCR analysis of Mest210 expression in Mest-WT and pKO 12 dpa blastemas. F, G qPCR analysis of transcript variant expression in (F) Mest-WT and (G) pKO e12.5 embryos. H qPCR analysis of Mest210 expression in Mest-WT and pKO e12.5 embryos. I Total Mest expression in Mest-WT and pKO e12.5 embryos using primers shown in Fig. 4A. Error bars are reported as standard deviation; (*) p < 0.05, (**) p < 0.01, (***) p < 0.001, (****) p < 0.0001; ns denotes not significant.
Fig. 6
Fig. 6. Single-cell transcriptomic analysis of Mest wildtype and knockout blastemas.
A UMAP plot of Mest-WT and KO 12 dpa integrated blastema fibroblasts colored by Seurat clusters (left) and by genotype (right). B Violin plots of top 4 differentially expressed genes (DEGs) identified between WT (top) and KO fibroblasts (bottom). C Dot plot of gene set enrichment analysis using KEGG pathways derived from Mest-WT DEGs. D Relative population proportions for each genotype in the integrated fibroblast dataset. E Dot plot of KEGG analysis derived from cluster-0 DEGs. F Chord plot for ligand-receptor pairs between fibroblasts (green) and neutrophils (orange) that are downregulated in the Mest-KO blastema compared to WT. G Chord plot for Annexin signaling by cell type in the WT blastema. H Western blot of Mest WT, KO, mKO, and pKO 12 dpa blastemas for ANXA1, FPR2, and β-tubulin. I Mest-WT and KO blastema neutrophils quantified by flow cytometry at 9, 12, and 15 dpa. Percentages were calculated for CD11b+/Ly6g+ cells out of all PI cells. (**) p < 0.01, (****) p < 0.0001.

Update of

Similar articles

References

    1. Illingworth, C. M. Trapped fingers and amputated finger tips in children. J. Pediatr. Surg.9, 853–858 (1974). - PubMed
    1. Borgens, R. B. Mice regrow the tips of their foretoes. Science217, 747–750 (1982). - PubMed
    1. Johnson, G. L., Masias, E. J. & Lehoczky, J. A. Cellular heterogeneity and lineage restriction during mouse digit tip regeneration at single-cell resolution. Dev. Cell52, 525–540.e5 (2020). - PMC - PubMed
    1. Kaneko-Ishino, T. et al. Peg1/Mest imprinted gene on chromosome 6 identified by cDNA subtraction hybridization. Nat. Genet.11, 52–59 (1995). - PubMed
    1. Decker, M. et al. EH3 (ABHD9): the first member of a new epoxide hydrolase family with high activity for fatty acid epoxides. J. Lipid Res.53, 2038–2045 (2012). - PMC - PubMed

LinkOut - more resources