. 2024 Oct 28;9(1):204.
doi: 10.1038/s41541-024-00994-x.

Proteomic approach to identify host cell attachment proteins provides protective Pseudomonas aeruginosa vaccine antigen FtsZ

Affiliations

Proteomic approach to identify host cell attachment proteins provides protective Pseudomonas aeruginosa vaccine antigen FtsZ

Irene Jurado-Martín et al. NPJ Vaccines. .

Abstract

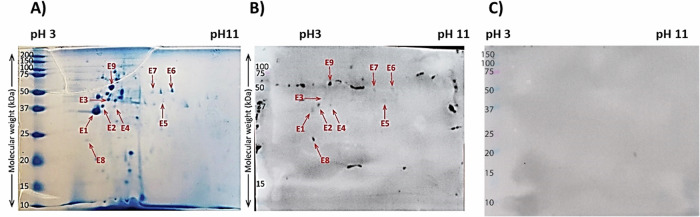
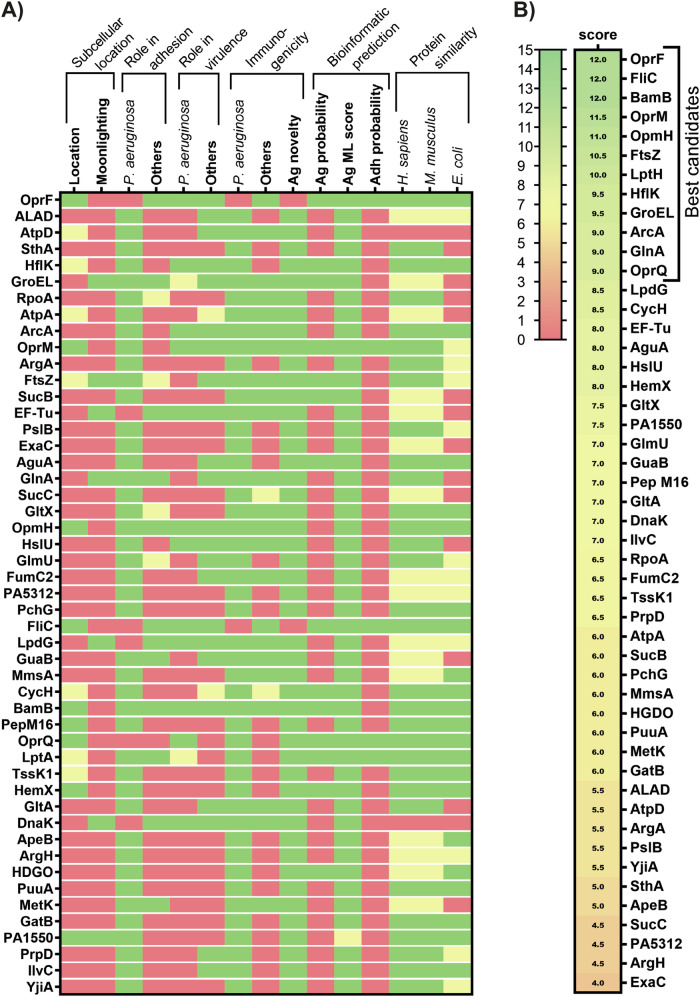
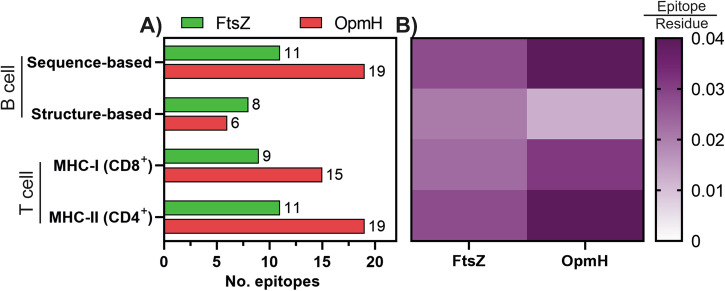
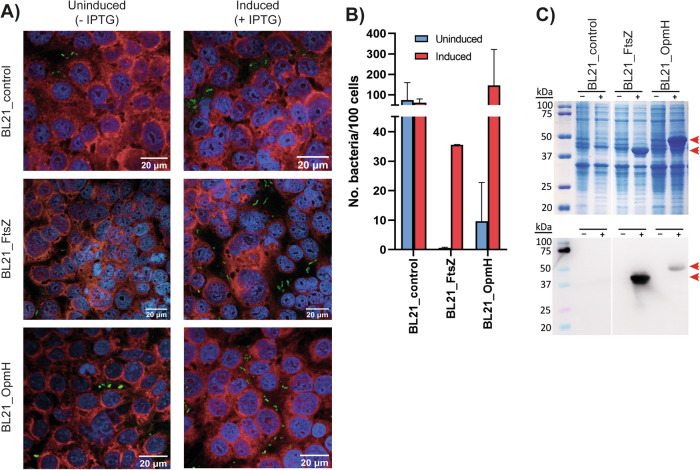
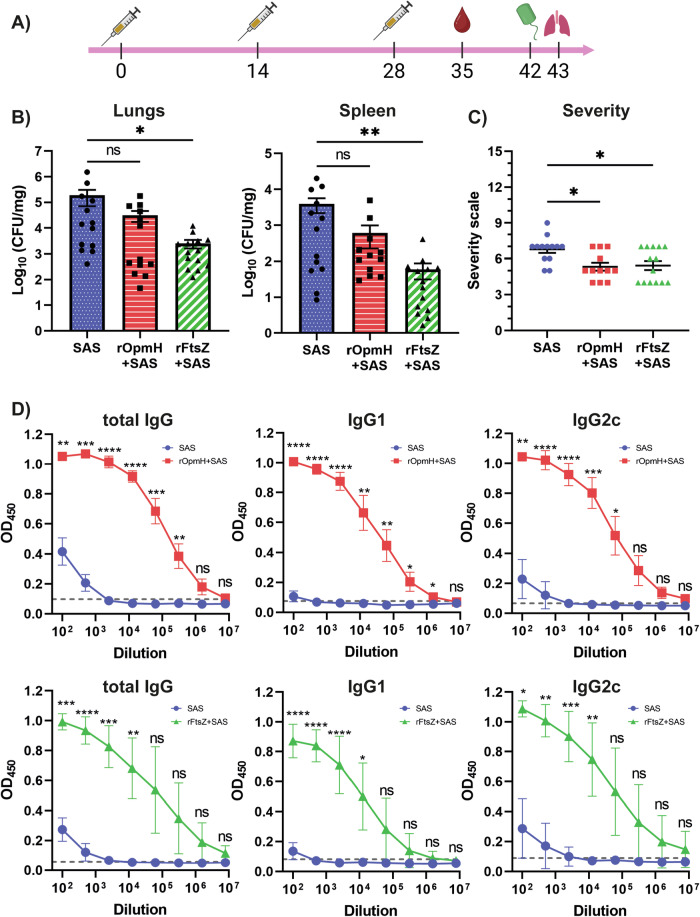
Pseudomonas aeruginosa is an opportunistic Gram-negative pathogen that causes severe nosocomial infections in susceptible individuals due to the emergence of multidrug-resistant strains. There are no approved vaccines against P. aeruginosa infections nor candidates in active clinical development, highlighting the need for novel candidates and strategies. Using a cell-blot proteomic approach, we reproducibly identified 49 proteins involved in interactions with human lung epithelial cells across four P. aeruginosa strains. Among these were cell division protein FtsZ and outer membrane protein OpmH. Escherichia coli BL21 cells overexpressing recombinant FtsZ or rOpmH showed a 66- and 15-fold increased ability to attach to 16HBE14o- cells, further supporting their involvement in host cell attachment. Both antigens led to proliferation of NK and CD8+ cytotoxic T cells, significant increases in the production of IFN-γ, IL-17A, TNF and IL-4 in immunised mice and elicited strong antigen-specific serological IgG1 and IgG2c responses. Immunisation with FtsZ significantly reduced bacterial burden in the lungs by 1.9-log CFU and dissemination to spleen by 1.8-log CFU. The protective antigen candidate, FtsZ, would not have been identified by traditional approaches relying on either virulence mechanisms or sequence-based predictions, opening new avenues in the development of an anti-P. aeruginosa vaccine.


Conflict of interest statement

The authors declare no competing interests. University College Dublin has filed a patent application related to this study with I.J.-M. and S.McC. as inventors; UK IPO application number: 2405503.0. The application covers the identification of FtsZ and other P. aeruginosa antigens as protective vaccine candidates in mice.

Figures

Fig. 1
Fig. 1. P. aeruginosa attachment to 16HBE14o cell line.
A Representative confocal images showing attachment of P. aeruginosa strains to HBE cells, obtained on a Opera Phenix™ High Content Screening automated confocal microscope. Bacteria are shown in green (anti-P. aeruginosa antibody + secondary antibody-Alexa Fluor®488), and HBE cells in red (membranes, CellMask™ Deep Red) and blue (nuclei, DAPI). B Attachment of P. aeruginosa to HBE cells assessed by colony counting and confocal microscopy. Bars represent the mean ± SEM, with each dot representing one independent experiment. Statistically significant differences (p value < 0.05) were calculated using one-way ANOVA and are indicated by letter-based representation of pairwise comparison. The strains were assigned a letter from “a” to “f” from left to right. The letters on top of each bar indicate the strains to which they are compared and showed a statistically significant difference.
Fig. 2
Fig. 2. Representative example of a cell-blot experiment performed on P. aeruginosa strain A5803 strain probed with HBE cells.
A PageBlue™-stained 2D gel image. B Cell-probed blot. The red arrows point at spots that were matched between blot and PageBlue-stained gel and which were excised from the gel and analysed by LC–MS. C Blot probed with antibodies only in the absence of cells as a negative control.
Fig. 3
Fig. 3. Antigen candidate scoring and shortlisting.
A Heat map representing whether the proteins fulfilled (green, score = 1) the desirable criteria for effective vaccine antigens (columns’ names) or not (red, score = 0), or inconclusive (yellow, score = 0.5). Full information is available in the Supplementary Material (Tables S2–5) B Final scores of the potential candidates, arranged from higher (green) to lower (red) scores. The higher the score, the greater the likelihood of being a promising antigen. The numbers indicate the score given to each protein.
Fig. 4
Fig. 4. Epitope prediction in the selected antigen candidates.
A Number of B and T cell epitopes predicted using BepiPred, Ellipro and Tepitool servers. B Comparison between antigen candidates using the number of epitopes normalised to the number of amino acid residues. The higher the epitope/residue ratio, the greater the predicted immunogenicity.
Fig. 5
Fig. 5. Attachment of recombinant E. coli BL21 cells expressing the antigen candidates to HBE cells.
A Representative images taken with the automated Opera Phenix™ confocal HSC microscope, showing the increased attachment of the induced cultures. Bacteria are shown in green (anti-E. coli antibody-FITC), and HBE cells in red (membranes, CellMask™ Deep Red) and blue (nuclei, DAPI). B Number of bacteria attached per 100 HBE cells, counted automatically by the Harmony®4.8 software In99 fields. Bars represent the mean and SD of the duplicates. C Confirmation by 12% SDS–PAGE (upper) and western blot (lower) of protein expression (red arrows) only in the induced cultures (+).
Fig. 6
Fig. 6. Protective effect of immunisation with rFtsZ and rOpmH plus SAS in mice.
A Timeline of the immunisation schedule, indicating days of immunisation, blood collection, challenge, and organ harvest. Mice were immunised three times subcutaneously with 50 µg rFtsZ or rOpmH plus SAS, and then challenged with P. aeruginosa KK1 strain (6.3 × 106–1.8 × 107 CFU/mouse). B Bacterial burden in the lungs and spleens of mice 24 h post-challenge. C Severity score of mice 24 h after challenge. These graphs show data pooled from two independent experiments. Data are represented as mean ± SEM, and each point represents one mouse. Statistically significant differences were calculated using the non-parametric Kruskal–Wallis test or One-way ANOVA test (p value < 0.05). D Serological analysis of antigen-specific total IgG, IgG1 and IgG2c production by immunised mice. Each point represents the mean ± SD of the mice in the group. The grey, dash lines show the cut-off (2 SD + mean) for antibody titration. Significant differences between control and immunised groups were analysed via two-way ANOVA Šidák’s multiple comparison test (p value < 0.05) (*p ≤ 0.05; **p ≤ 0.01; ***p ≤ 0.001; ****p ≤ 0.0001).
Fig. 7
Fig. 7. Cellular profiles of antigen-specific immune response.
Splenocytes from mice immunised (I) with either rFtsZ (green triangles), rOpmH (red squares) or adjuvant only controls (C, blue triangles and squares) were stimulated ex vivo with rFtsZ (triangles) or OpmH (squares) 14 days post immunisation and analysed by flow cytometry. Data represent percentage of cells in response to ex vivo stimulation with rFtsZ or rOpmH adjuvanted with SAS: a total T cells; b regulatory T cells; c γδ T cells; d NK T cells; e NK cells; fj total, activated, naïve, memory or effector helper T cells; ko total, activated, naïve, memory or effector cytotoxic T cells. The graphs represent the mean ± SD data pooled from two independent experiments and each dot represents one mouse. Statistically significant differences (p < 0.05) were evaluated using paired Student’s t-test between antigen and its respective adjuvant only control (*p ≤ 0.05; **p ≤ 0.01; ***p ≤ 0.001; ****p ≤ 0.0001).
Fig. 8
Fig. 8. Cytokine profile of antigen-specific immune response.
Splenocytes from mice immunised (I) with either rFtsZ (green triangles), rOpmH (red squares) or adjuvant only controls (C, blue triangles and squares) were stimulated ex vivo with rFtsZ (triangles) or OpmH (squares) 14 days post immunisation and analysed by flow cytometry. Data represent percentage of cells producing IFN-γ, TNF, IL-4, IL-17A or IL-22 in response to immunisation with rFtsZ + SAS or rOpmH + SAS. ae non-T cells; fj T cells; ko helper T cells; pr NK cells; s, t cytotoxic T cells. C control, I immunised. The graphs show data pooled from two independent experiments, which is represented as the average ± SD, and each dot represents one mouse. Statistically significant differences (p < 0.05) were evaluated using paired Student’s t-test (*p ≤ 0.05; **p ≤ 0.01; ***p ≤ 0.001; ****p ≤ 0.0001).

References

    1. Morin, C. D., Déziel, E., Gauthier, J., Levesque, R. C. & Lau, G. W. An organ system-based synopsis of Pseudomonas aeruginosa virulence. Virulence12, 1469–1507 (2021). - PMC - PubMed
    1. Wood, S. J., Kuzel, T. M. & Shafikhani, S. H. Pseudomonas aeruginosa: infections, animal modeling, and therapeutics. Cells12, 199 (2023). - PMC - PubMed
    1. Collaborators, G. B. D. A. R. Global mortality associated with 33 bacterial pathogens in 2019: a systematic analysis for the Global Burden of Disease Study 2019. Lancet400, 2221–2248 (2022). - PMC - PubMed
    1. Shortridge, D. et al. Geographic and temporal patterns of antimicrobial resistance in Pseudomonas aeruginosa over 20 years from the SENTRY Antimicrobial Surveillance Program: 1997-2016. Open Forum Infect. Dis.6, S63–S68 (2019). - PMC - PubMed
    1. Herkel, T. et al. Epidemiology of hospital-acquired pneumonia: results of a Central European multicenter, prospective, observational study compared with data from the European region. Biomed. Pap.160, 448–455 (2016). - PubMed

LinkOut - more resources