. 2024 Oct 28;15(1):9273.
doi: 10.1038/s41467-024-53624-4.

5'-tRNAGly(GCC) halves generated by IRE1α are linked to the ER stress response

Affiliations

5'-tRNAGly(GCC) halves generated by IRE1α are linked to the ER stress response

Hanyong Jin et al. Nat Commun. .

Abstract

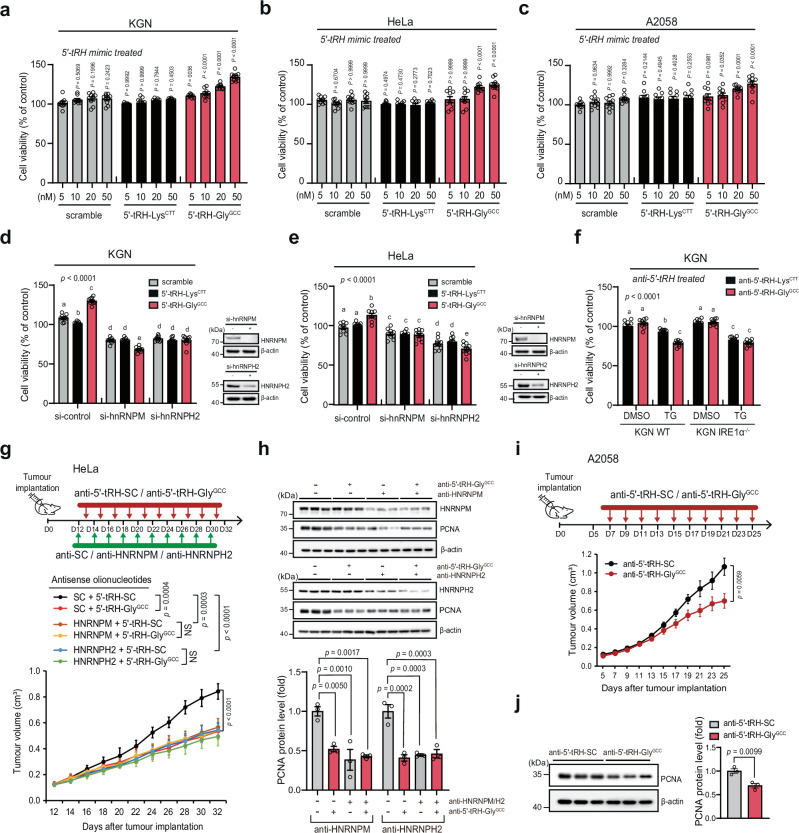
Transfer RNA halves (tRHs) have various biological functions. However, the biogenesis of specific 5'-tRHs under certain conditions remains unknown. Here, we report that inositol-requiring enzyme 1α (IRE1α) cleaves the anticodon stem-loop region of tRNAGly(GCC) to produce 5'-tRHs (5'-tRH-GlyGCC) with highly selective target discrimination upon endoplasmic reticulum (ER) stress. Levels of 5'-tRH-GlyGCC positively affect cancer cell proliferation and modulate mRNA isoform biogenesis both in vitro and in vivo; these effects require co-expression of two nuclear ribonucleoproteins, HNRNPM and HNRNPH2, which we identify as binding proteins of 5'-tRH-GlyGCC. In addition, under ER stress in vivo, we observe simultaneous induction of IRE1α and 5'-tRH-GlyGCC expression in mouse organs and a distantly related organism, Cryptococcus neoformans. Thus, collectively, our findings indicate an evolutionarily conserved function for IRE1α-generated 5'-tRH-GlyGCC in cellular adaptation upon ER stress.


Conflict of interest statement

J.-H.Y., M.J., M.R., and H.-M.K. are employees of NES Biotechnology. J.-H.Y, H.-M.K., M.J., E.S., Y.Ha, M.R., K.L., and J.B. are inventors of KR Patent (Application No. 10-2022-00184521) entitled ‘Anticancer Composition Containing Nanoparticle-tRH Conjugate’. K.L. is an inventor of US Patent (Patent No. US 8871509 B2) entitled “Nanoparticle-based gene delivery systems”. The remaining authors have no conflicts of interest to declare.

Figures

Fig. 1
Fig. 1. Small RNA-seq analysis of IRE1α-induced tRFs in vivo.
a Volcano plot depicting differentially expressed 5’-tRFs in WT and IRE1α-overexpressing KGN cells (KGN-IRE1αoe) (n = 3). tRNA gene annotation: ‘W-X:YZ’ (W: amino-acid; X: anticodon; Y: cleavage site; Z: unique gene identifier). Log2 fold change >1.5 and p < 0.001 was used as cut-off for significance (yellow box). b Based on the small RNA-seq analysis in a, cleavage sites at the anticodon loop in the secondary human tRNAGly(GCC) and tRNACys(GCA) structures (n = 3). Red: acceptor stem at 5′-end; Purple: D loop; light green: anticodon loop; dark green: anticodon; yellow: T loop; blue: CCA tail at 3′-end. Numbering in the anticodon indicates the 3′-end positions of the tRFs; percent indicates the proportion of 5’-tRFs in total 5’-tRFs (log2 fold change >1.5 and p < 0.001). c Northern blot analysis of tRNA fragments in KGN cells following IRE1α overexpression KGN cells were transfected with plasmid encoding myc-tagged IRE1α for 24 h, total RNA was extracted for analysis of 5′-tRNA fragments by northern blotting. The expression of IRE1α and GAPDH (loading control) was analysed by western blotting. Ribonucleolytic activity of IRE1α was confirmed XBP1 splicing assay using RT-PCR analysis of unspliced/spliced (u/s) XBP1. Red arrow: 5′-tRFs from tRNAGly(GCC) generated by IRE1α. M: size marker. Percentage of 5′-tRF compared to full-length tRNA are shown. Data are presented as the mean ± S.E.M (n = 3). P-values were obtained by unpaired two-tailed t-test. d (Left) Primer extension analysis of 5′-end of tRNAGly(GCC) fragment in KGN cells. KGN cells were transfected with a plasmid encoding IRE1α or kinase defected mutant (IRE1α-K599A). (Right) Secondary structure of mature tRNAGly(GCC) and IRE1α cleavage sites at anticodon. Numbering in the anticodon indicates the positions of mature tRNA nucleotides. Red arrow: prominent cleaved products of the tRNAGly(GCC) generated by IRE1α. Source data are provided as a Source Data file.
Fig. 2
Fig. 2. IRE1α-specific cleavage of tRNAGly(GCC) in vitro.
a Northern blot analysis of in vitro cleaved tRNAGly(GCC) and tRNALys(CTT) by recombinant IRE1α (5 nM). Red arrow: prominent cleaved products of the tRNAGly(GCC) generated by IRE1α. The northern blot membranes were then stripped and reprobed with a 32P-5′-end-labelled probe specific for the tRNALys(CTT). Percentage of 5′-tRF compared to full-length tRNA are shown. Values are presented as the mean ± S.E.M (n = 3). P-values were obtained by one-way ANOVA with Dunnett’s multiple comparisons test. b Primer extension assay on tRNAGly(GCC) cleavage products in the presence of IRE1α in vitro. RE1α cleavage sites in the tRNAGly(GCC) are denoted by different letters (a–g). c In vitro cleavage of tRNAGly(GCC) by IRE1α. Purified tRNAGly(GCC) (20 ng) was incubated with recombinant IRE1α (5 nM) at 37 °C for 0.5 or 2 h. Secondary structure of mature tRNAGly(GCC) and IRE1α cleavage sites (a–g from Figs. 2b and 1–7 from Fig. 2c). Black arrows: position of the tRNAGly(GCC) cleavage site generated by IRE1α. Red arrow: major cleavage site by IRE1α. Source data are provided as a Source Data file.
Fig. 3
Fig. 3. ER stress induces 5′-tRHs cleavage by tRNAGly(GCC).
a Northern blot analysis of tRNAGly(GCC) fragments in control KGN (WT) or IRE1α knockout-KGN cells (IRE1α−/−) (n = 3). Cells were treated with 0.1% DMSO, TG (0.1 μM) or TM (1 μg/ml) for 6 h and harvested. Total RNA was isolated and probed with a probe specific for the tRNAGly(GCC). The northern blot membranes were then stripped and reprobed with a 32P-5′-end-labelled probe specific for the tRNALys(CTT). Quantification of 5′-tRH-GlyGCC level is presented in the bottom panel. b (Upper) 5′-end of tRNAGly(GCC) fragment detected in a (KGN WT) determined by primer extension analysis. (Lower) Secondary structure of mature tRNAGly(GCC) and IRE1α cleavage sites at anticodon stem loop. Red arrow: major IRE1α cleavage site. c Validation of 5′-tRH enrichment following treatment of KGN WT and IRE1α−/− cells with 0.1 μM of TG by TaqMan-based real-time PCR. Data are presented as the mean ± S.E.M (n = 3). Northern blot analysis of tRNAGly(GCC) fragments in HeLa (d), A2058 (f), and TPC-1 (h) cells (n = 3). Total RNA was isolated and probed with a probe specific for the tRNAGly(GCC). The northern blot membranes were then stripped and reprobed with a 32P-5′-end-labelled probe specific for the tRNALys(CTT). Quantification of 5′-tRH-GlyGCC level presented in the bottom panel of d. Validation of 5′-tRH enrichment following treatment of HeLa (e), A2058 (g), and TPC-1 (i) cells with DMSO, TG or TM by TaqMan-based real-time PCR (n = 9). TaqMan-based real-time PCR of tRNAGly(GCC) or tRNALys(CTT) fragments in IRE1α knockdown or ANG knockdown HeLa (j), A2058 (k), and TPC-1 (l) cells with TG (0.1 μM), respectively. In a, d, f, and h, the expression of IRE1α and β-actin (loading control) was analysed by western blotting (WB). Ribonucleolytic activity of IRE1α was confirmed XBP1 splicing assay using RT-PCR analysis of unspliced/spliced (u/s) XBP1. P-values were obtained by one-way ANOVA with Turkey’s multiple comparisons. Red arrow: tRHs cleaved by IRE1α. Source data are provided as a Source Data file.
Fig. 4
Fig. 4. Confirmation of specific association of HNRNPM and HNRNPH2 with 5′-tRH-GlyGCC by RIP-seq analysis.
a Experimental design scheme for RIP-seq analysis. A2058 cells were transfected with expression vectors encoding indicated proteins (myc-IRE1α, HA-HNRNPM, FLAG-HNRNPH2), and cell extracts were prepared and immunoprecipitated with anti-HA or anti-FLAG antibodies. Three independent experiments were performed. b The proportion of RIP-seq enriched RNA fragments annotated to the indicated RNAs (n = 3). c Percentage of enriched tRF with HNRNPH2 (upper) or HNRNPM (lower) (n = 3). The pie chart represents the proportion of tRFs in each of the total tRF read counts in RIP-seq data. Mapped read counts from RIP-seq of tRF-GlyGCC (d) or tRF-CysGCA (e) associated with HNRNPH2 (red) and HNRNPH2 (blue) were normalised to the corresponding read counts from the input. Data are presented as the mean ± S.E.M (n = 3). f Quantification of 5′-tRH-GlyGCC enriched with HNRNPM or HNRNPH2 proteins. Co-immunoprecipitated RNAs from the indicated antibodies in A2058 cells were analysed by TaqMan-based qRT-PCR using designed probes on the 33-mer 5’-tRH-GlyGCC. Data are presented as the mean ± S.E.M (n = 3). P-values were obtained by One sample t-test. g Pull-down of HNRNPM and HNRNPH2 using 5′-biotinylated tRH-GlyGCC. TG (0.1 µM)-treated (+) or -untreated (−) KGN cell lysates were combined with 5′-biotinylated tRH-GlyGCC or 5′-biotin-oligo A8 RNA (control). After allowing the binding of protein and RNA, streptavidin-coated beads were used to pull down the RNA. After washing, RNA-bound IRE1α, HNRNPM, or HNRNPH2 proteins were visualised using western blot. Source data are provided as a Source Data file.
Fig. 5
Fig. 5. Functional roles of 5′-tRFs of tRNAGly(GCC).
Cell viability of KGN (a), HeLa (b), and A2058 (c) cells following transfection with increasing amounts of tRH mimics. Data are presented as the mean ± S.E.M (n = 9). P-values were obtained by one-way ANOVA with Dunnett’s multiple comparisons test. Cell viability of KGN (d) and HeLa (e) cells following transfection with siRNAs for HNRNPM or HNRNPH2 and tRH mimics (left). Knockdown efficiency of HNRNPM or HNRNPH2 proteins was determined (right). The expression of HNRNPM or HNRNPH2, and β-actin (loading control) was analysed by western blotting. Data are presented as the mean ± S.E.M (n = 9). f Cell viability of WT and IRE1α−/− KGN cells following transfection with ASOs targeting endogenous 5′-tRHs (anti-5′-tRH-LysCTT or anti-5′-tRH-GlyGCC) in the absence or presence of TG. Data are presented as the mean ± S.E.M (n = 9). In ef, different letters denote statistically significant differences (p < 0.0001; two-way ANOVA with Student–Newman–Keuls multiple comparisons test). gj Antitumor effects of anti-5′-tRH-GlyGCC in HeLa cell- or A2058 cell-derived mice xenograft tumour model. g After HeLa cell-derived subcutaneous xenograft reached about 100 mm3, mice (n = 10 per each group) were treated with AuNPdT loaded with anti-scramble, anti-HNRNPM, or anti-HNRNPH2, followed by alternate injections of AuNPdT loaded with anti-scramble or anti-5′-tRH-GlyGCC every other day. P-values were obtained by two-way ANOVA with Dunnett’s multiple comparisons test. h Representative immunoblots and quantified data for tumours from each group are presented. Data are presented as the mean ± S.E.M (n = 3). P-values were obtained by one-way ANOVA with Dunnett’s multiple comparisons test. i Volumes of A2058 cell-derived subcutaneous xenograft tumours from mice injected with either the AuNPdT-anti-scramble as a control, or AuNPdT-anti-5′-tRH-GlyGCC were measured (n = 12 per each group). P-values were obtained by unpaired two-tailed t-test. j Representative immunoblots and quantified data for tumours from each group are presented. Data are presented as the mean ± S.E.M (n = 3). P-values were obtained by unpaired two-tailed t-test. The images of the mouse model were generated from the stock images of PowerPoint. Source data are provided as a Source Data file.
Fig. 6
Fig. 6. 5′-tRH-GlyGCC mediates alternative splicing events.
a Volcano plot of differentially expressed protein-coding genes in KGN cells transfected with 5′-tRH-GlyGCC mimic and control KGN cells transfected with 5′-tRH-LysCTT mimic (n = 2). Blue dots: significant upregulation of target genes; red dots: significant downregulation of target genes. b DAVID functional analysis of genes with transcript abundance altered by more than 1.5-fold. c Differential isoform usage (left) and major isoforms (right) from the ELOB (upper panel) and PSMB5 (lower panel). Red box: alternative splicing region. d Representative RT-PCR analysis of three experiments of alternative splicing events from ELOB and PSMB5 in KGN cells following transfection with siRNAs for HNRNPH2 or HNRNPM (200 nM) and 5′-tRH-GlyGCC mimics (50 nM). The arrow indicates the positions and directions of the primers used to amplify the relevant fragments. Red boxes indicate alternate exons, and their neighbouring exons are shown as blank boxes. The bar graph represents a densitometric analysis of the assay (short isoform/long isoform ratio). Values are presented as the mean ± S.E.M (n = 3). P-values were obtained by one-way ANOVA with Dunnett’s multiple comparisons test. e Validation of alternative splicing events from ELOB and PSMB5 in KGN cells transfected with 5′-tRH-LysCTT or 5′-tRH-GlyGCC mimics (50 nM) by RT-qPCR. f Validation of alternative splicing events from ELOB and PSMB5 in WT or IRE1α-knockout (IRE1α−/−) KGN cells treated with TM (1 μg/mL). The expression of IRE1α and GAPDH (loading control) was analysed by western blotting (WB). The ribonucleolytic activity of IRE1α was confirmed by XBP1 splicing assay using RT-PCR analysis of unspliced/spliced (u/s) XBP1. g, h Validation of the inhibitory effects of AuNP-conjugated ASOs (anti-5′-tRH-LysCTT or anti-5′-tRH-GlyGCC) on alternative splicing events of ELOB and PSMB5 was performed using tumour samples obtained from xenograft mice in Fig. 5g (g) or Fig. 5i (h). The relative abundances of the mRNAs were normalized to that of control mRNAs (set as 1; dot lines). In eh, values are presented as the mean ± S.E.M (n = 9). P-values were obtained by unpaired two-tailed t-test. Source data are provided as a Source Data file.
Fig. 7
Fig. 7. ER stress induces generation of 5′-tRHs from tRNAGly(GCC) in mouse and C. neoformans.
a Northern blot analysis of tRNAGly(GCC)-derived fragments in the ovary from ER stress-induced mouse. Mice were injected intraperitoneally with control (PBS containing 2% DMSO), TG (1 µg/g body weight) or TM (0.5 µg /g body weight) solution as described in the Methods section. 5.8S rRNA was used as the loading control. b (Upper) 5′-end of tRNAGly(GCC) fragment as determined by primer extension assay using total RNA isolated from ovaries after treatment with 0.1% DMSO or TG (0.1 uM) for 6 h. (Lower) Secondary structure of mouse mature tRNAGly(GCC) and IRE1α cleavage sites at anticodon stem loop. Red arrow: TG-induced IRE1α cleavage sites. c Northern blot analysis of tRNAGly(GCC) fragments in control B16-BL6 mouse cell (WT) or IRE1α knockdown-B16-BL6 mouse cell (si-Ire1α). Total RNA was isolated and probed with a probe specific for the tRNAGly(GCC). In a and c, the expression of IRE1α and β-actin (loading control) was analysed by western blotting (WB). Ribonucleolytic activity of IRE1α was confirmed XBP1 splicing assay using RT-PCR analysis of unspliced/spliced (u/s) XBP1. Red arrow: tRHs from tRNAGly(GCC) cleaved by IRE1α. d Northern blot analysis of tRNAGly(GCC) fragments from WT and ire1-deletion (ire1∆) C. neoformans treated or not treated with TM (5 μg/ml). Total RNA was isolated and probed with a probe specific for the tRNAGly(GCC). 5.8S rRNA was used as the loading control. The expression of IRE1 and GAPDH (loading control) was analysed by WB. Ribonucleolytic activity of IRE1 was confirmed HXL1 splicing assay using RT-PCR analysis of unspliced/spliced (u/s) HXL1. Arrows: TM-induced IRE1 cleavage sites. e (Upper) Primer extension analysis of tRNAGly(GCC) fragments in C. neoformans treated or not treated with TM (5 μg/ml) for 2 h. (Lower) Secondary structure of C. neoformans mature tRNAGly(GCC) and IRE1 cleavage sites at anticodon stem loop are illustrated. Red arrow: TM-induced IRE1 cleavage sites. f Proposed model for the IRE1α selective generation of 5′-tRH-GlyGCC that contributes to cellular adaptation upon ER stress presented in diverse eukaryotic organisms from yeast to humans. Source data are provided as a Source Data file.

References

    1. Kim, H. K., Yeom, J. H. & Kay, M. A. Transfer RNA-Derived Small RNAs: Another Layer of Gene Regulation and Novel Targets for Disease Therapeutics. Mol. Ther.28, 2340–2357 (2020). - PMC - PubMed
    1. Fu, H. et al. Stress induces tRNA cleavage by angiogenin in mammalian cells. FEBS Lett.583, 437–442 (2009). - PubMed
    1. Yamasaki, S., Ivanov, P., Hu, G. F. & Anderson, P. Angiogenin cleaves tRNA and promotes stress-induced translational repression. J. Cell Biol.185, 35–42 (2009). - PMC - PubMed
    1. Honda, S. et al. Sex hormone-dependent tRNA halves enhance cell proliferation in breast and prostate cancers. Proc. Natl Acad. Sci. USA112, E3816–E3825 (2015). - PMC - PubMed
    1. Saikia, M. et al. Angiogenin-cleaved tRNA halves interact with cytochrome c, protecting cells from apoptosis during osmotic stress. Mol. Cell. Biol.34, 2450–2463 (2014). - PMC - PubMed

Publication types

Associated data

LinkOut - more resources