Comparative Study
. 2024 Oct 28;14(1):25833.
doi: 10.1038/s41598-024-74504-3.

A clinical comparison of a digital versus conventional design methodology for transtibial prosthetic interfaces

Affiliations
Comparative Study

A clinical comparison of a digital versus conventional design methodology for transtibial prosthetic interfaces

Duncan R C Lee et al. Sci Rep. .

Abstract

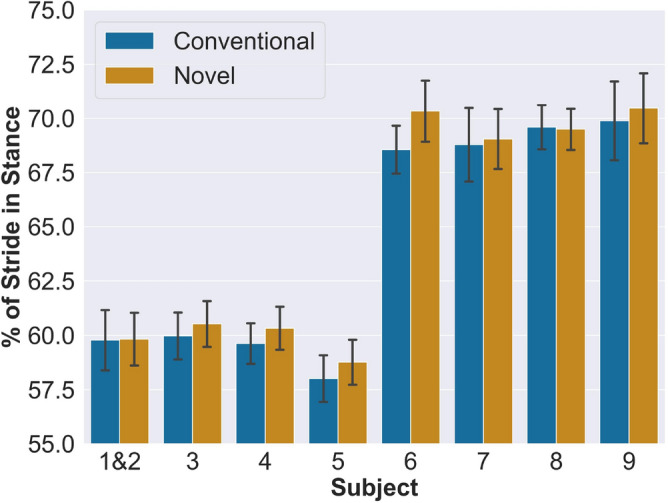
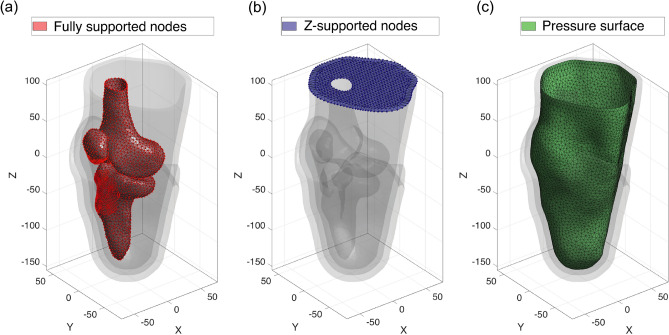
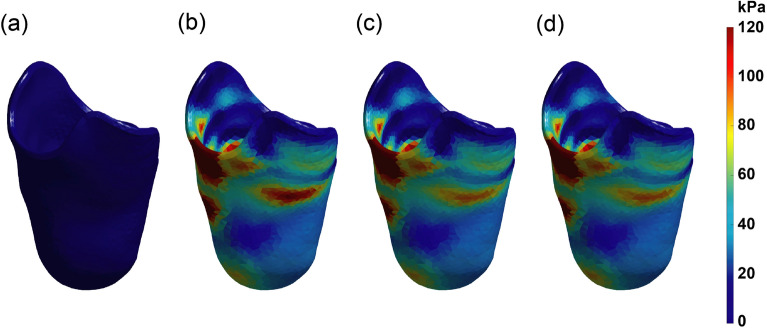
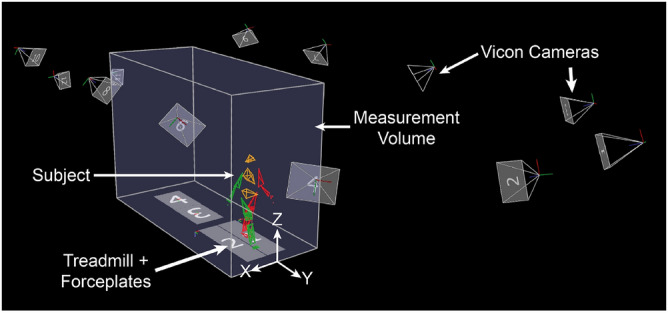
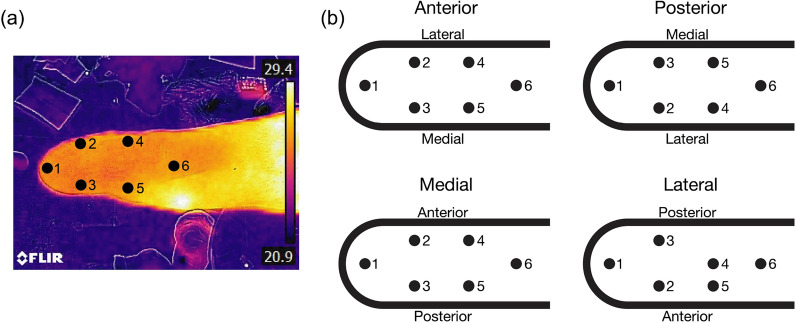
A transtibial prosthetic interface typically comprises a compliant liner and an outer rigid socket. The preponderance of today's conventional liners are mass produced in standard sizes, and conventional socket design is labor-intensive and artisanal, lacking clear scientific rationale. This work tests the clinical efficacy of a novel, physics-based digital design framework to create custom prosthetic liner-socket interfaces. In this investigation, we hypothesize that the novel digital approach will improve comfort outcomes compared to a conventional method of liner-socket design. The digital design framework generates custom transtibial prosthetic interfaces starting from MRI or CT image scans of the residual limb. The interface design employs FEA to simulate limb deformation under load. Interfaces are fabricated for 9 limbs from 8 amputees (1 bilateral). Testing compares novel and conventional interfaces across four assessments: 5-min walking trial, thermal imaging, 90-s standing pressure trial, and an evaluation questionnaire. Outcome measures include antalgic gait criterion, skin surface pressures, skin temperature changes, and direct questionnaire feedback. Antalgic gait is compared via a repeated measures linear mixed model while the other assessments are compared via a non-parametric Wilcoxon sign-rank test. A statistically significant ([Formula: see text]) decrease in pain is demonstrated when walking on the novel interfaces compared to the conventional. Standing pressure data show a significant decrease in pressure on novel interfaces at the anterior distal tibia ([Formula: see text]), with no significant difference at other measured locations. Thermal results show no statistically significant difference related to skin temperature. Questionnaire feedback shows improved comfort on novel interfaces on posterior and medial sides while standing and the medial side while walking. Study results support the hypothesis that the novel digital approach improves comfort outcomes compared to the evaluated conventional method. The digital interface design methodology also has the potential to provide benefits in design time, repeatability, and cost.

Keywords: 3D printing; Comfort; Custom; Digital design; FEA-based optimization; Prosthetics.


Conflict of interest statement

Authors Duncan R.C. Lee, Xingbang Yang, Dana Solav, Kevin M. Moerman, Christina I. Meyer, Aaron M. Jaeger, and Hugh M. Herr are listed as inventors on patent applications related to the presented transtibial liner-socket design methodology. All other authors do not have any competing interests.

Figures

Fig. 1
Fig. 1
Per-subject antalgic gait averages for conventional and novel interfaces. Subjects 6–9 walked at slower speed.
Fig. 2
Fig. 2
Anterior distal tibia normalized pressure values for conventional and novel interfaces, per subject.
Fig. 3
Fig. 3
Questionnaire scores for sitting, standing, and walking pressure on each limb. The questions asked were variations of “Rate the pressure you feel in the novel interface compared to your conventional interface when you are sitting/standing/walking”, depending on the activity the patient had just performed. A score of 50 indicates that the subject felt equivalent pressure in both the novel and conventional interface. A score greater than 50 indicates that the subject felt that the novel interface had a preferable pressure level and distribution than the conventional interface, whereas a score below 50 indicates that the conventional interface had preferable pressure compared to the novel interface.
Fig. 4
Fig. 4
Map of digital prosthetic interface design framework to evaluation, based on Fig. 3 in Moerman et al., modified and updated. (A) 3D imaging via MRI or CT. For each subject, a series of medical images covering the complete lower leg and part of the upper leg were obtained. Parameters for imaging are given in Table B6 in the supplementary materials. (B) Biomechanical model reconstruction through segmentation. Components including tibia, femur, patella, patella tendon, and skin were segmented and reconstructed separately and assembled based on their actual position and orientation. (C) Digital image correlation (DIC). Details given in the Digital Image Correlation subsection. (DE) Preliminary socket and liner design. A direction for body weight loading based on the mechanical axis of human standing was defined. The model was reoriented with this load line parallel to the z axis. Preliminary liner and the socket designs were based on the morphology of the biomechanical limb model, without fitting pressures applied. (F) Pressure region definitions for the socket and the liner design. The liner contains four pressure regions: distal, lower leg (below-knee), knee (around-knee) and upper leg (above-knee) The socket contains four regions: distal, fibular head, patellar tendon, and residual (rest of socket). Details given in the digital design subsection. (GJ) Finite element simulation and optimization loop. The aim was to make the load distribution more even, maximize load bearing around patella bar region, and minimize pressure around sensitive regions after applying body weight. Details given in the digital design subsection. (K) Further modification such as mesh manipulation and liner extension. The modifications were based on subject fitting feedback and measure quadriceps data. (L) Fabrication by 3D printing. (M) Clinical evaluation. Kinematics, pressure in the interface between the skin and the liner, thermal images, and questionnaires were collected and to evaluate comfort of the interface.
Fig. 5
Fig. 5
Overview of the limb 3D biomechanical model creation. (A) Image section planes. (B) Contouring + levelset processing. Tibia shown as example. (C) Surface model generation, with 2D triangle elements. (D) Registration marker reconstruction in MRI model. (E) DIC skin alignment. Blue points are MRI marker positions and red points are matching DIC locations. (F) Model after MRI and DIC skin registration. (G) Final biomechanical model with MRI skin replaced by DIC skin and with local axes.
Fig. 6
Fig. 6
Detailed look at the interface design algorithm. (D) Interface model generation. (D-a) Load line direction indicated by the central red line. (D-b) Socket cutline control points. (D-c) Cutline refinement. Blue line represents the cutline on the mesh, red line is the final smooth spline. (E) Input geometric meshed model for FEA. (F) Pressure region definitions for the socket and the liner design. (G-J) Finite element simulation and pressure optimization. (K) Further modification. (K-a) Final liner model with the top extruded to the middle of the thigh. (K-b) Extended distal tibia region. Red shows the extended region, and yellow and green show the taper region to smoothly integrate into the socket. (K-c) Extended fibular head region. Colorations are the same as for K-b.
Fig. 7
Fig. 7
The boundary conditions of the biomechanical model for FEA. (a) The fixed nodes on the bone surfaces. (b) z-fixed nodes at the proximal surface of the model. (c) The skin surface, on which pressure is applied.
Fig. 8
Fig. 8
(a) Load before body weight is applied (preliminary geometry). (b) Load after 1 iteration of FEA. (c) Load after 2 iterations. (d) Load after 3 iterations. Very little change occurs beyond 3 iterations.
Fig. 9
Fig. 9
(a) Load map on the liner outer surface after 1 iteration of FEA before any manual modifications. (b) Socket load map after 3 iterations of FEA. (c) Fabricated liner. (d) Fabricated socket that has been aligned by a prosthetist and attached to a pylon through a socket pyramid secured by epoxy, heat-shrink, and tape.
Fig. 10
Fig. 10
Experimental setup at the Cambridge location.
Fig. 11
Fig. 11
(a) An example thermal image, showing the anterior view of a right leg with ROI locations. The thermal scale was linearly interpolated based on the color bar. (b) The layout of the 6 ROIs for each image direction of the right leg for thermal data processing. The positions would be mirrored medial-laterally for a left-affected subject. ROI 4 was positioned at the fibular head for anterior, posterior, and lateral images. The fibular head is not visible in the medial view.
Fig. 12
Fig. 12
Force sensitive resistor locations for measuring pressure on a left leg. (a) anterior view; (b) posterior view.

References

    1. Murphy, E. F. Sockets, linings, and interfaces. Clin. Prosthet. Orthot.8, 4–10 (1984).
    1. Edwards, M. L. Lower limb prosthetics. In Clinician’s Guide to Assistive Technology 297–310. 10.1016/B978-081514601-8.50026-4 (Elsevier, 2002).
    1. McDonald, C. L., Westcott-McCoy, S., Weaver, M. R., Haagsma, J. & Kartin, D. Global prevalence of traumatic non-fatal limb amputation. Prosthet. Orthot. Int.45, 105–114. 10.1177/0309364620972258 (2021). - PubMed
    1. Highsmith, J. T. & Highsmith, M. J. Common skin pathology in LE prosthesis users. J. Am. Acad. Phys. Assist.20, 33–36. 10.1097/01720610-200711000-00018 (2007). - PubMed
    1. Spittle, M., Collins, R. J. & Conner, H. The incidence of pressure sores following lower limb amputations. Pract. Diabetes Int.18, 57–61. 10.1002/pdi.139 (2001).

Publication types

LinkOut - more resources