. 2024 Oct 28;14(1):25815.
doi: 10.1038/s41598-024-73943-2.

Glutamine and serum starvation alters the ATP production, oxidative stress, and abundance of mitochondrial RNAs in extracellular vesicles produced by cancer cells

Affiliations

Glutamine and serum starvation alters the ATP production, oxidative stress, and abundance of mitochondrial RNAs in extracellular vesicles produced by cancer cells

Maria Bugajova et al. Sci Rep. .

Abstract

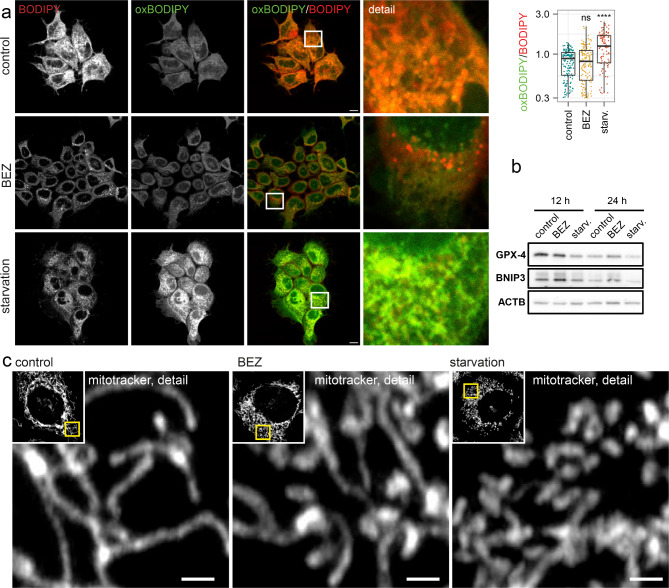
Induction of autophagy represents an effective survival strategy for nutrient-deprived or stressed cancer cells. Autophagy contributes to the modulation of communication within the tumor microenvironment. Here, we conducted a study of the metabolic and signaling implications associated with autophagy induced by glutamine (Gln) and serum starvation and PI3K/mTOR inhibitor and autophagy inducer NVP-BEZ235 (BEZ) in the head and neck squamous cell carcinoma (HNSCC) cell line FaDu. We compared the effect of these different types of autophagy induction on ATP production, lipid peroxidation, mitophagy, RNA cargo of extracellular vesicles (EVs), and EVs-associated cytokine secretome of cancer cells. Both BEZ and starvation resulted in a decline in ATP production. Simultaneously, Gln starvation enhanced oxidative damage of cancer cells by lipid peroxidation. In starved cells, there was a discernible fragmentation of the mitochondrial network coupled with an increase in the presence of tumor susceptibility gene 101 (TSG101) on the mitochondrial membrane, indicative of the sorting of mitochondrial cargo into EVs. Consequently, the abundance of mitochondrial RNAs (mtRNAs) in EVs released by FaDu cells was enhanced. Notably, mtRNAs were also detectable in EVs isolated from the serum of both HNSCC patients and healthy controls. Starvation and BEZ reduced the production of EVs by cancer cells, yet the characteristic molecular profile of these EVs remained unchanged. We also found that alterations in the release of inflammatory cytokines constitute a principal response to autophagy induction. Importantly, the specific mechanism driving autophagy induction significantly influenced the composition of the EVs-associated cytokine secretome.


Conflict of interest statement

The authors declare no competing interests.

Figures

Fig. 1
Fig. 1
ATP production in FaDu cells and expression of proteins involved in the autophagy machinery. (a) Expression of autophagy-related proteins ULK1 and its phosphorylated forms p-ULK1 (Ser 757) and p-ULK1 (Ser 556), ATG5, ATG7, SQSTM1, GABARAP, and LC3; p indicates phosphorylation. Uncropped western blots for this figure are shown in supplementary Fig. S1. (b) Densitometric analyzes: the ratio of ULK1 phosphorylation on Ser 757 to ULK1 expression; the ratio of ULK1 phosphorylation on Ser 556 to ULK1 expression; the ratio of ULK1 phosphorylation on Ser 556/ Ser 757; the ratio of GABARAP II/I; the ratio of LC3 II/I. (c) l ATP production based on Seahorse parameters OCR (oxygen consumption rate) and ECAR (extracellular acidification rate). OM = oligomycin; FCCP = carbonyl cyanide-p-trifluoromethoxyphenylhydrazone; rot = rotenone; AA = antimycin A. P-values from group comparisons based on the t-test are shown. Asterisks represent statistical significance (* p < 0.05; ** p < 0.01; *** p < 0.001).
Fig. 2
Fig. 2
An increase in lipid peroxidation accompanied by depletion of GPX4 and changes in the mitochondria after Gln-starvation. (a) Lipid peroxidation assessed by the Image-iT Lipid Peroxidation Kit; shift from red to green fluorescence is observable upon oxidation by lipid hydroperoxides. Scale bar: 10 μm, detail 20 × 20 μm. (b) Protein expression of antioxidant defense protein GPX4 and mitophagy-associated protein BNIP3.Uncropped western blots for this figure are shown in supplementary Fig. S1. (c) Changes in the mitochondrial network structure. MitoTracker Red stained mitochondria undergo significant remodeling during Gln deprivation such as extensive fragmentation and swelling. Scale bar:1 μm.
Fig. 3
Fig. 3
Immunofluorescence images of FaDu cells under glutamine starvation or treated with NVP-BEZ235. MitoTracker Red, autophagy-related proteins, BNIP3 and TSG101. (a) Confocal immunofluorescence images of MitoTracker Red/BNIP3/LC3 and their mutual colocalization. Scale bar: 5 μm (detail 1 μm) (b) Confocal immunofluorescence images of MitoTracker Red and TSG101 colocalization, and MitoTracker Red and p62 colocalization. Scale bar: 5 μm (c) Pearson correlations depicting the rate of colocalization of BNIP3, LC3 p62, and TSG101 with mitochondria.
Fig. 4
Fig. 4
Characterization of cytokines and extracellular vesicles produced by FaDu cells after NVP-BEZ235 treatment or glutamine starvation. (a) Conditioned media (CMs) preparation scheme. Large EVs (larger than 220 nm), apoptotic bodies, or free cytokines were removed during CM preparation. These CMs were used for the cytokine array.(b) Heatmap of normalized cytokine levels in CM after NVP-BEZ235 treatment or glutamine starvation. This CM should not contain large EVs (larger than 220 nm) apoptotic bodies or free cytokines. (c) (left column) Cryo-electron microscopy of non-collapsed extracellular vesicles demonstrating the native character of isolated vesicles with an apparently intact double membrane. Scale bar equals 50 nm. Negative staining transmission electron micrograph of cup-shaped extracellular vesicles. Shown is a heterogeneous population of vesicles consisting of a range of sizes (30–200 nm) with low densities typical for exosomes. Scale bar equals 1000 nm (the middle column) and 100 nm (the right column). TEM microscopy was performed on a fresh sample of EVs not subjected to freezing temperatures.(d) Size and concentration of EVs assessed by NanoSight nanoparticle analyzer. The sample was diluted 65x before measurement Numbers indicate peak size.(e) Characterization of isolated EVs. Protein expression of EpCAM CD9 Cav-1 flotillin-1 annexin V and TSG101.  (f) Protein expression of EpCAM in FaDu cells. Uncropped western blots for this figure are shown in supplementary Fig. S1.
Fig. 5
Fig. 5
The RNA content of EVs produced by FaDu cells and its changes after autophagy modulation. (a) Representation of different RNA biotypes in EVs produced by FaDu cells. Sequencing of each treatment variant was performed in tetraplex. (b) Volcano plot of changes in RNA content of FaDu-derived EVs due to Gln starvation and NVP-BEZ-235. Significant changes in expression are marked in red (upregulated; HC_log2FC > 1 and HC_padj < = 0.05) or blue (downregulated; HC_log2FC < 1 and HC_padj < = 0.05). FC = fold change, MT = mitochondrial.(c) Categories of biological processes from the GO database. Changes in biological processes which can be influenced by RNA cargo changes caused by Gln starvation.
Fig. 6
Fig. 6
Expression of mitochondrial RNAs in EVs isolated from sera of HNSCC patients and healthy controls. (a) Differential expression in HNSCC patients (N = 41) and controls (N = 20) did not reveal a significant difference in the expression of any of the analyzed genes. (b) Heatmap showing relationship with clinicopathological indicators. Shown as log 2-fold change (FC) relative to the mean of the controls. All selected genes show higher levels in the oropharyngeal location (vs. all other locations). See supplementary Table S1 for details.

References

    1. Briukhovetska, D. et al. Interleukins in cancer: from biology to therapy. Nat. Rev. Cancer. 21, 481–499 (2021). - PMC - PubMed
    1. Raudenska, M., Balvan, J. & Masarik, M. Crosstalk between autophagy inhibitors and endosome-related secretory pathways: a challenge for autophagy-based treatment of solid cancers. Mol. Cancer. 20, 140 (2021). - PMC - PubMed
    1. Zhao, J., Zhai, B., Gygi, S. P. & Goldberg, A. L. mTOR inhibition activates overall protein degradation by the ubiquitin proteasome system as well as by autophagy. Proceedings of the National Academy of Sciences 112, 15790–15797 (2015). - PMC - PubMed
    1. Tan, H. W. S., Sim, A. Y. L. & Long, Y. C. Glutamine metabolism regulates autophagy-dependent mTORC1 reactivation during amino acid starvation. Nat. Commun.8, 338 (2017). - PMC - PubMed
    1. Zhu, Y. et al. L-Glutamine deprivation induces autophagy and alters the mTOR and MAPK signaling pathways in porcine intestinal epithelial cells. Amino Acids. 47, 2185–2197 (2015). - PubMed

MeSH terms

LinkOut - more resources