. 2024 Oct 28;14(1):25852.
doi: 10.1038/s41598-024-76860-6.

Light inducible gene expression system for Streptomyces

Affiliations

Light inducible gene expression system for Streptomyces

Ryuta Noya et al. Sci Rep. .

Abstract

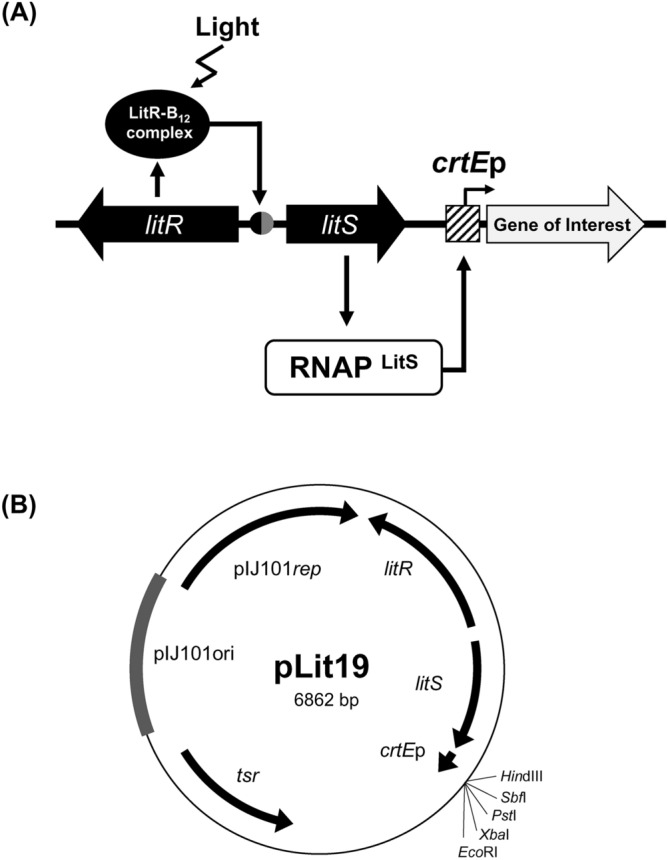
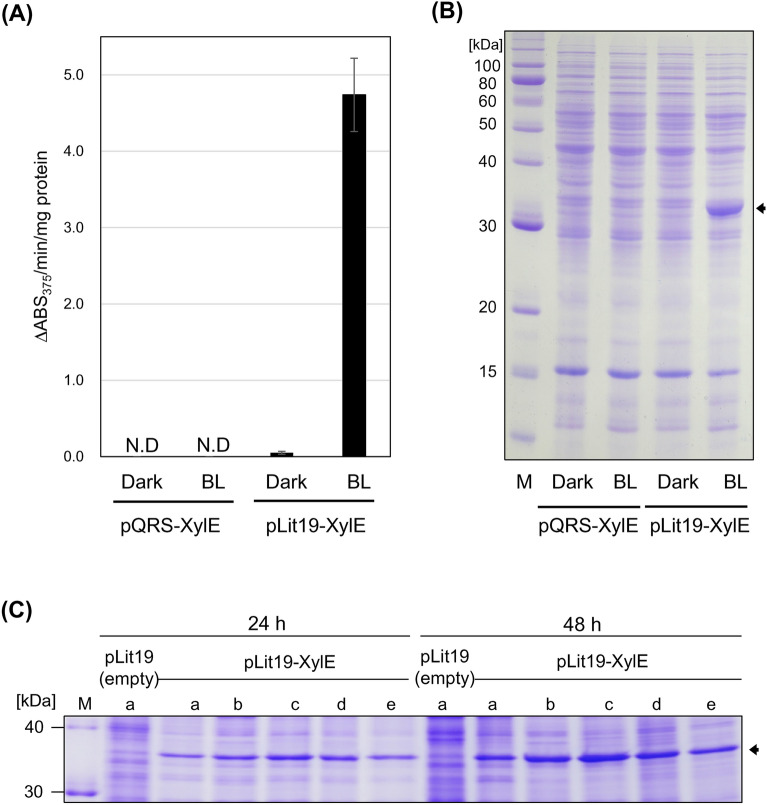
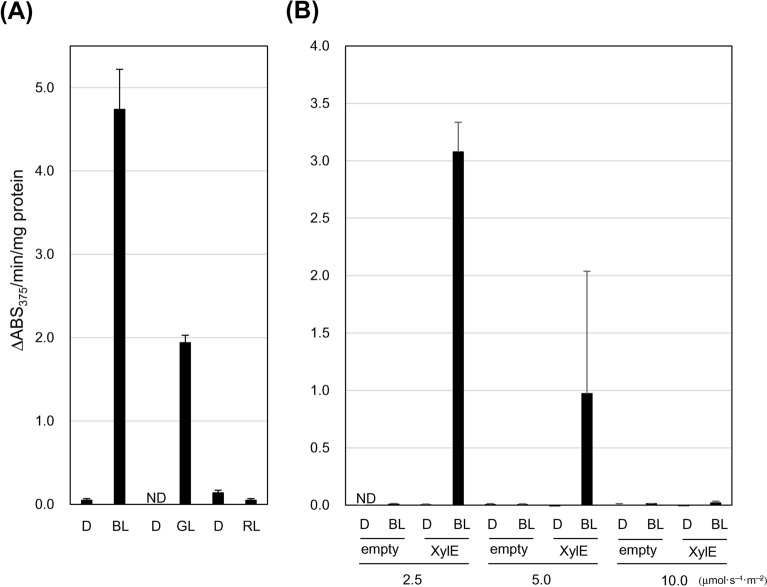
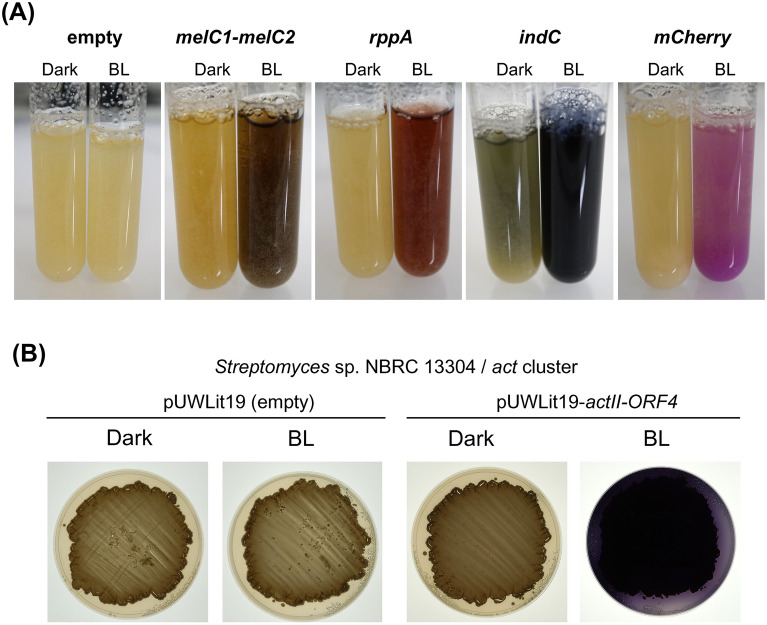
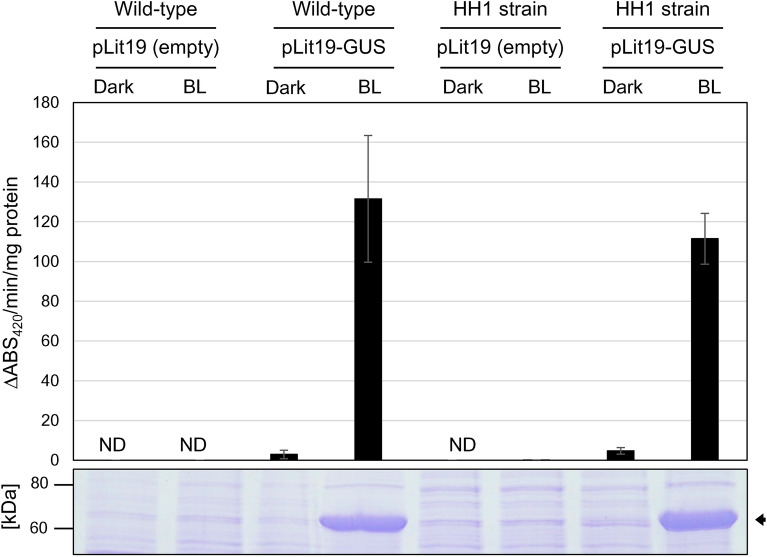
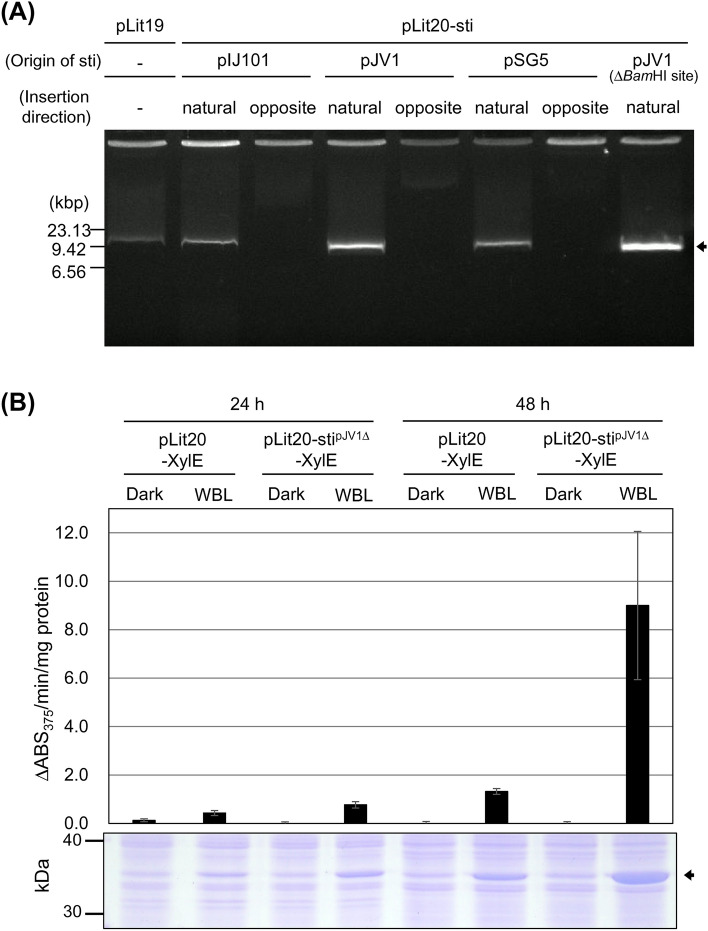
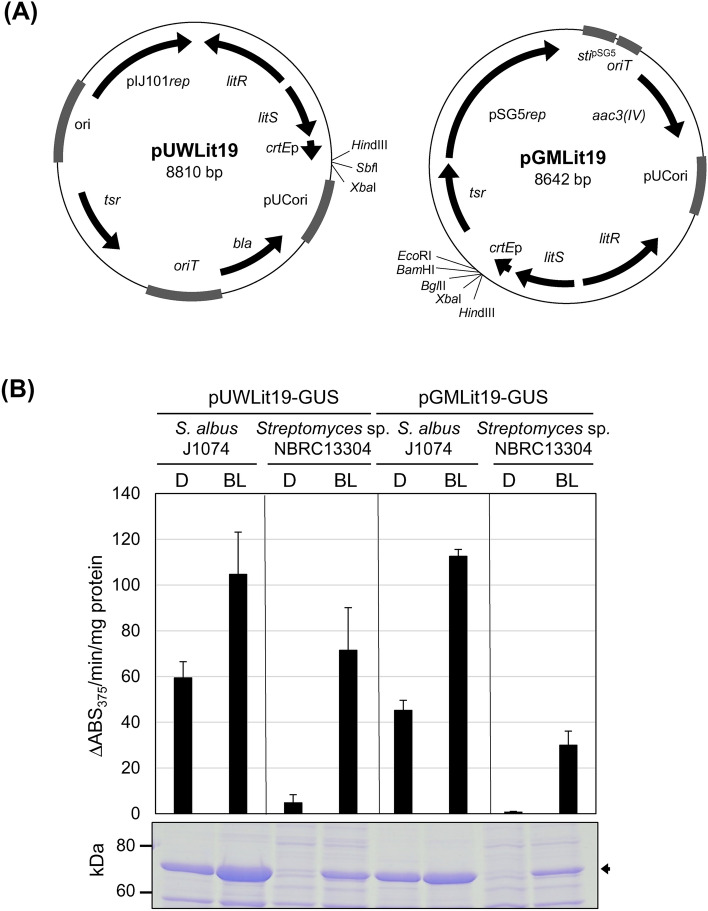
The LitR/CarH family comprises adenosyl B12-based photosensory transcriptional regulators that control light-inducible carotenoid production in nonphototrophic bacteria. In this study, we established a blue-green light-inducible hyperexpression system using LitR and its partner ECF-type sigma factor LitS in streptomycin-producing Streptomyces griseus NBRC 13350. The constructed multiple-copy number plasmid, pLit19, carried five genetic elements: pIJ101rep, the thiostrepton resistance gene, litR, litS, and σLitS-recognized light-inducible crtE promoter. Streptomyces griseus transformants harboring pLit19 exhibited a light-dependent hyper-production of intracellular reporter enzymes including catechol-2,3-dioxygenase and β-glucuronidase, extracellular secreted enzymes including laccase and transglutaminase, and secondary metabolites including melanin, flaviolin, and indigoidine. Cephamycin-producing Streptomyces sp. NBRC 13304, carrying an entire actinorhodin gene cluster, exhibited light-dependent actinorhodin production after the introduction of the pLit19 shuttle-type plasmid with the pathway-specific activator actII-ORF4. Insertion of sti fragment derived from Streptomyces phaeochromogenes pJV1 plasmid into pLit19 increased its light sensitivity, allowing gene expression under weak light irradiation. The two constructed Escherichia coli-Streptomyces shuttle-type pLit19 plasmids were found to have abilities similar to those of pLit19. We successfully established an optogenetically controlled hyperproduction system for S. griseus NBRC 13350 and Streptomyces sp. NBRC 13304.

Keywords: Streptomyces; Light-inducible; LitR; Optogenetics; Recombinant protein.


Conflict of interest statement

The authors declare no competing interests.

Figures

Fig. 1
Fig. 1
Light-inducible transcription via LitR and LitS (A) and its application to a hyper-production system (B). (A) Schematic model of the litRlitS regulatory system. Under dark conditions, LitR protein in complex with adenosyl B12 (B12) represses the bidirectional promoters of litR and litS. Upon sensing the blue-green light, LitR-B12 activates the transcription of the litS promoter, and RNA polymerase containing σLitS directs the transcription from the crtE promoter (crtEp). A gene of interest cloned into the multiple cloning site (MCS) is specifically and highly expressed in response to light stimuli. (B) Schematic representation of pLit19, a light-inducible hyper-expression vector. pLit19 is a self-replicative plasmid in Streptomyces carrying the pIJ101 replication region (pIJ101ori) and pIJ101rep gene, thiostrepton resistance gene (tsr), litR, litS, crtEp, and unique cloning sites as shown in its restriction enzyme name.
Fig. 2
Fig. 2
Light-inducible overexpression of XylE. (A) Transformants harboring the prototype pQRS–XylE and the modified-type pLit19–XylE were grown in a shaking culture for 48 h under dark and blue light (BL; center light wavelengths: 450 nm; 3 μmol s–1 m–2). XylE activity in the cell-free extract was calculated as a change in absorbance at 375 nm per min per total 1 mg protein (ΔABS375nm/min/mg). n = 3. Error bars represent the mean ± standard deviation (SD). ND, not detected due to the lower limit of detection of XylE activity. (B) Intracellular total proteins produced by the transformants carrying pQRS–XylE or pLit19–XylE were separated via sodium dodecyl sulfate-polyacrylamide gel electrophoresis (SDS-PAGE) and visualized using Coomassie Brilliant Blue R-250 (CBB) staining. The arrow indicates the band corresponding to XylE based on the deduced molecular mass. Lane M indicates the standard molecular weight (MW) marker. (C) Transformants harboring pLit19 (empty as a control) and pLit19–XylE were grown in a shaking culture for 24 and 48 h under blue light (BL; 3 μmol s–1 m–2). Five types of culture media were used: YMP-glucose (a), TSB (b), ISP2 (c), Bennett’s glucose (d), and Bennett’s maltose (e). Intracellular total proteins in the transformants were analyzed via SDS-PAGE and CBB staining. The weight (mg) of wet cells per 1 mL culture broth is shown in Supplementary Table S1. The original and unprocessed versions of the full-length gels are included in Supplementary Fig. S6 and S7.
Fig. 3
Fig. 3
Light wavelengths and intensity activating the LiEX system. XylE activity is expressed as ΔABS375 nm/min/mg. n = 3. Error bars represent the mean ± SD. ND, not detected due to the lower limit of detection of XylE activity. (A) Transformants harboring pLit19–XylE were grown in a shaking culture for 48 h in the dark (D) and under blue (BL, 3 μmol s–1 m–2), green (GL, 1 μmol s–1 m–2), and red (RL, 3 μmol s–1 m–2) light, with center light wavelengths of 450, 530, and 660 nm, respectively. The data for the D and BL conditions is identical to that of Fig. 2. (B) Transformants harboring pLit19 (empty as a control) and pLit19–XylE were grown in a shaking culture for 48 h in the dark and under BL (2.5, 5.0, and 10.0 μmol s–1 m–2).
Fig. 4
Fig. 4
High production of secreted enzymes. Transformants harboring pLit19 with the gene encoding the secreted enzymes (SLAC, EpoA, TGase, XylA, XlnC, PhoD1, and AbfA) were grown in a shaking culture for 24 h and 48 h in the dark and under blue light (BL, 3 μmol s–1 m–2). The cell-free supernatant produced by the transformants was concentrated 50-fold and analyzed by SDS-PAGE and CBB staining. Asterisks indicate bands corresponding to the secreted enzymes. Lane M indicates the standard MW marker. The weights (mg) of wet cells per 1 mL culture broth are shown in Supplementary Table S3. Original and unprocessed versions of the full-length gel are shown in Supplementary Fig. S8.
Fig. 5
Fig. 5
High production of SLAC and TGases. (A) Transformants harboring pLit19 (empty as a control) and pLit19–SLAC were grown in a shaking culture for 24 h and 48 h under blue (3 μmol s–1 m–2), green (3 μmol s–1 m–2), and red (3 μmol s–1 m–2) light. Five types of culture media were used: YMP-glucose (a), TSB (b), ISP2 (c), Bennett’s glucose (d), and Bennett’s maltose (e). The cell-free supernatant produced by the transformants was concentrated 50-fold and analyzed via SDS-PAGE and CBB staining. Arrows indicate the bands corresponding to the secreted enzymes. Lane M indicates the standard MW marker. (B) Transformants harboring pLit19–SLAC were grown in a shaking culture with YMP-glucose, TSB, and ISP2 liquid media under BL (3 μmol s–1 m–2) in the absence (left) and presence (right) of 10 μM CuSO4. (C) Transformants harboring pLit19-TGase of S. netropsis NBRC 12880 and S. mobaraensis NBRC 13819 were cultured in TSB or ISP2 liquid media under BL (3 μmol s–1 m–2). In (B) and (C), cell-free culture supernatants (10 μL) prepared every 24 h for seven days were analyzed. The original and unprocessed version of the full-length gel is included in Supplementary Figs. S9–S17.
Fig. 6
Fig. 6
Production of pigment secondary metabolites and fluorescence protein. (A) Transformants of pLit19 harboring melC1-melC2 genes for melanin, rppA for flaviolin, indC for indigoidine, and mCherry for red fluorescence protein were grown in a shaking culture for 48 h in the dark and under BL (3 μmol s–1 m–2). Then, the culture broth with cells was transferred to a test tube, and photographs were taken. (B) Transformants of Streptomyces sp. NBRC 13304 carrying the entire actinorhodin (act) biosynthesis gene cluster and pUWLit19 (empty as a control) or pUWLit19-actII-ORF4 were cultured on YMP-glucose solid medium for five days in the dark and under blue light (BL, 3 μmol s–1 m–2), and act production was observed as a blue pigment.
Fig. 7
Fig. 7
A-factor-deficient HH1 strain functions as a host for the LiEX system. Streptomyces griseus wild-type (WT) and HH1 strains harboring pLit19 (empty as a control) or pLit19–GUS (GUS) were grown in a shaking culture for 48 h in the dark and under BL (3 μmol s–1 m–2). GUS activity is expressed as ΔABS410 nm/min/mg. n = 3. Error bars represent the mean ± SD. ND, not detected due to the lower limit of detection of GUS activity. Total intracellular proteins were analyzed using SDS-PAGE and CBB staining (shown at the bottom). The arrow indicates the band corresponding to GUS. Lane M indicates the standard MW marker. The original and unprocessed version of the full-length gel was included in Supplementary Fig. S18.
Fig. 8
Fig. 8
Analysis of ribosome-binding sites (RBSs). (A) Nucleotide sequences of RBSnitA, RBSw52, and RBSsav2794 are indicated by red letters. HindIII restriction site and ATG codon of XylE are indicated by underlined and blue letters, respectively. (B) Transformants carrying pLit19–XylE retaining or not retaining RBSnitA, RBSw52, and RBSsav2794 in the preceding region of xylE were cultured for 48 h in the dark and under BL (3 μmol s–1 m–2), and their XylE activities were determined. n = 3. Error bars represent the mean ± standard deviation. ND, not detected due to the lower limit of detection of XylE activity. Intracellular proteins of the transformants were analyzed via SDS-PAGE and CBB staining (shown at the bottom). The arrow indicates the band corresponding to XylE. The original and unprocessed version of the full-length gel was included in Supplementary Fig. S19.
Fig. 9
Fig. 9
Consensus sequence of light-inducible crtE promoter. (A) Evaluation system of light-inducible crtEp. Expression of mCherry in pLit19–mCherry-A (positive control) is directed via transcription of crtEp and litSp. The expression in pLit19–mCherry-B (screening vector) is directed only by crtEp as ttsbiB is located between litS and crtEp. mCherry in pLit19–mCherry-C is not expressed as (i) pLit19–mCherry-C does not have crtEp, and (ii) ttsbiB is present downstream of litS. Transformants of S. griseus carrying the above plasmids were cultured on YMP-glucose solid medium for two days in the dark and under white light (WL, 1.3 μmol s–1 m–2), and mCherry expression was observed as a red color. (B) Consensus sequences of three-type crtEp, including the wild-type (upper), light-inducible type (middle), and non-expressing type (bottom). Logos obtained by MEME analysis were shown. Original nucleotide sequences are shown in Supplementary Figs. S2, S4, and S5.
Fig. 10
Fig. 10
Increase in light sensitivity via insertion of stipJV1Δ. (A) Plasmids (pLit19, pLit20-stipIJ101, pLit20-stipJV1, pLit20-stipSG5, and pLit20-stipJV1Δ) were purified from transformants cultured for two days in 10 mL of YMP-glucose liquid media. The purified DNA was treated with KpnI, RNase, and Plasmid-Safe ATP-Dependent DNase, and separated via 0.8% agarose gel electrophoresis, and visualized via ethidium bromide staining under UV irradiation. (B) Transformants harboring pLit20–XylE or pLit20-stipJV1Δ–XylE were grown in a shaking culture for 24 and 48 h in the dark and under weak blue light (WBL; 1 μmol s–1 m–2). XylE activity is expressed as ΔABS375 nm/min/mg. n = 3. Error bars represent the mean ± SD. Total intracellular proteins were analyzed via SDS-PAGE and CBB staining (shown at the bottom). The arrow indicates the band corresponding to XylE. The original and unprocessed versions of the full-length gels are included in Fig. S20 and S21.
Fig. 11
Fig. 11
Functions of E. coli–Streptomyces shuttle-type pUWLit19 and pGMLit19 in S. albus J1074 and Streptomyces sp. NBRC 13304. (A) Schematic representation of the shuttle vectors, pUWLit19 and pGMLit19. bla, ampicillin resistance gene; aac3(IV), apramycin resistance gene; pUCori, replication origin of E. coli; oriT, origin of transfer; pIJ101rep and ori, replicon of Streptomyces from pIJ101; pSG5rep and ori, replicon of Streptomyces from pGM160; thiostrepton resistance gene (tsr); litR, litS, and crtEp, a light-sensing conversion module; stipSG5. Unique cloning sites are indicated by their restriction enzyme names. (B) S. albus J1074 and Streptomyces sp. NBRC 13304 harboring pUWLit19–GUS or pGMLit19–GUS were grown in a shaking culture for 48 h in the dark (D) and under BL (3 μmol s–1 m–2). GUS activity is expressed as ΔABS410 nm/min/mg (shown at the top). n = 3. Error bars represent the mean ± SD. Total intracellular proteins produced by the transformants were analyzed using SDS-PAGE and CBB staining (shown at the bottom). The arrow indicates the band corresponding to GUS based on the deduced molecular mass. The original and unprocessed version of the full-length gel is included in Supplementary Fig. S22.

References

    1. Chater, K. F. Recent advances in understanding Streptomyces. F1000Res5, 2795 (2016). - PMC - PubMed
    1. Quinn, G. A., Banat, A. M., Abdelhameed, A. M. & Banat, I. M. Streptomyces from traditional medicine: sources of new innovations in antibiotic discovery. J. Med. Microbiol.69, 1040–1048 (2020). - PMC - PubMed
    1. Beg, Q. K., Kapoor, M., Mahajan, L. & Hoondal, G. S. Microbial xylanases and their industrial applications: a review. Appl. Microbiol. Biotechnol.56, 326–38 (2001). - PubMed
    1. Jung, E. D. et al. DNA sequences and expression in Streptomyces lividans of an exoglucanase gene and an endoglucanase gene from Thermomonospora fusca. Appl. Environ. Microbiol.59, 3032–43 (1993). - PMC - PubMed
    1. Fuchsbauer, H.-L. Approaching transglutaminase from Streptomyces bacteria over three decades. FEBS J.289, 4680–4703 (2022). - PubMed

MeSH terms

LinkOut - more resources